EXPLORING THE POTENTIAL OF AERIAL PHOTOGRAMMETRY FOR 3D MODELLING OF HIGH-ALPINE ENVIRONMENTS
Klaus Legat a, Kjersti Moe b, Daniela Poli b*, Erik Bollmannb a
Vermessung AVT ZT GmbH, Eichenweg 42, 6460 Austria –[email protected] b
Terra Messflug GmbH, Eichenweg 42, 6460 Austria – (d.poli, k.moe, e.bollmann)@terra-messflug.at
KEY WORDS: Large-format aerial cameras, Dense Image Matching, Georeferencing, ALS, Glaciers
ABSTRACT:
High-alpine areas are subject to rapid topographic changes, mainly caused by natural processes like glacial retreat and other geomorphological processes, and also due to anthropogenic interventions like construction of slopes and infrastructure in skiing resorts. Consequently, the demand for highly accurate digital terrain models (DTMs) in alpine environments has arisen. Public administrations often have dedicated resources for the regular monitoring of glaciers and natural hazard processes. In case of glaciers, traditional monitoring encompasses in-situ measurements of area and length and the estimation of volume and mass changes. Next to field measurements, data for such monitoring programs can be derived from DTMs and digital ortho photos (DOPs). Skiing resorts, on the other hand, require DTMs as input for planning and – more recently – for RTK-GNSS supported ski-slope grooming. Although different in scope, the demand of both user groups is similar: high-quality and up-to-date terrain data for extended areas often characterised by difficult accessibility and large elevation ranges.
Over the last two decades, airborne laser scanning (ALS) has replaced photogrammetric approaches as state-of-the-art technology for the acquisition of high-resolution DTMs also in alpine environments. Reasons include the higher productivity compared to (manual) stereo-photogrammetric measurements, canopy-penetration capability, and limitations of photo measurements on sparsely textured surfaces like snow or ice. Nevertheless, the last few years have shown strong technological advances in the field of aerial camera technology, image processing and photogrammetric software which led to new possibilities for image-based DTM generation even in alpine terrain. At Vermessung AVT, an Austrian-based surveying company, and its subsidiary Terra Messflug, very promising results have been achieved for various projects in high-alpine environments, using images acquired by large-format digital cameras of Microsoft’s UltraCam series and the in-house processing chain centred on the Dense-Image-Matching (DIM) software SURE by nFrames.
This paper reports the work carried out at AVT for the surface- and terrain modelling of several high-alpine areas using DIM- and ALS-based approaches. A special focus is dedicated to the influence of terrain morphology, flight planning, GNSS/IMU measurements, and ground-control distribution in the georeferencing process on the data quality.
Based on the very promising results, some general recommendations for aerial photogrammetry processing in high-alpine areas are made to achieve best possible accuracy of the final 3D-, 2.5D- and 2D products.
* Corresponding author
1. INTRODUCTION
Mapping missions in alpine terrain are often characterized by harsh environments, limited accessibility, difficult topographic conditions (steep surfaces, great elevation ranges, limited satellite visibility, etc.) and short seasons (bounded by weather, lighting conditions and snow coverage). Despite these challenges, mapping quality has reached a level that was not conceivable only a few years ago. In the era of digital globes, we are used to complete geodata coverage even of the most remote spots.
Not least boosted by climate change, alpine environments are subject to continuous alteration caused by natural phenomena like glacier retreat and permafrost thawing, avalanches, land- and mudslides, and flooding. The surfaces that often appear hard and denying are actually very vulnerable. In addition, anthropogenic interventions also cause persistent changes; especially in the Alps, man has conquered and populated large territories with objectives as diverse as transportation, energy generation, and recreation. Just like in the lowlands, these uses drive the need for geodata both accurate and up to date.
Examples of uses include:
Infrastructure planning and construction (roads, dams, tunnels, powerlines, ropeways),
Sediment monitoring for water reservoirs, Glacier- and natural-hazard monitoring, Disaster documentation,
Slope management in skiing resorts.
Surveying engineers play a rather small but crucial role in these interdisciplinary fields of work. The choice of the optimal solution to a given mapping task is decisive for the whole lifecycle of the project. This choice is driven by various factors such as:
The characteristics of the area of interest: e.g. size, location, terrain morphology (absolute height and elevation range, inclination, exposition), accessibility. The desired mapping products: e.g. digital surface
models (DSMs), digital terrain models (DTMs), digital ortho photos (DOPs).
The desired product quality: accuracy, resolution. The International Archives of the Photogrammetry, Remote Sensing and Spatial Information Sciences, Volume XL-3/W4, 2016
The available time for reaction (e.g. in case of natural hazards) and production.
Environmental conditions: e.g. weather conditions, vegetation status, snow coverage.
While the most demanding tasks still require terrestrial (in-situ) surveying using total stations, levels, GNSS equipment or laser scanners, airborne (remote) sensing has become a serious competitor (in terms of price and quality) also for small project areas, thanks to the advent of unmanned airborne vehicles (UAVs). These platforms fill the dwindling gap between in-situ missions and “classical” airborne mapping missions flown with helicopters or fixed-wing aircraft (Immerzeel et al., 2014). Over the last two decades, ALS has become the standard technology for (multi-temporal) modelling, even of alpine surfaces (Janke, 2013, Helfricht et al., 2014). Aerial photogrammetry was not competitive due to limited performance of (manual) stereo-photogrammetric measurements, missing canopy penetration, and poor texture resolution on homogeneous surfaces like snow or ice. Nevertheless, the last few years have shown substantial technological advances in the field of aerial camera technology, image processing and photogrammetric software which led to new possibilities for image-based DSM and DTM generation. This paper focuses on recent aerial photogrammetric missions of AVT in alpine environments performed with large-format digital frame cameras and the combination of the image-based mapping products with other sources. In Section 2, the approach followed for data acquisition and modelling is described. Selected results are reported and the comparison with ALS data is critically commented in Section 3. Conclusions and recommendations are found in Section 4.
2. DATA ACQUISION AND MODELLING
2.1 Equipment
Since its founding in 1970, Vermessung AVT has always sought to work in line with and advance the state-of-the-art in surveying and mapping. Therefore, we are in the comfortable position that we can offer a broad palette of different solutions, platforms and sensors, including combinations of different approaches. Due to our location in the heart of the Tyrolean Alps, mountainous environments have always been our main working field. Via its subsidiary Terra Messflug based at Salzburg, Austria, AVT has access to large-format digital cameras of Microsoft’s UltraCam (UC) series.
Between 2009 and early 2015, we made our flights with an UC X-prime (XP) with 17.310 pixels across and 11.310 pixels along flight direction (pixel size 6 x 6 µm²). Our new UC Eagle f100 has been in use since early 2015. The image size has grown to 20.010 pixels across and 13.080 pixels along flight direction (pixel size 5.2 x 5.2 µm²). The basic camera architecture (four panchromatic and four colour cones), focal length (100.5 mm), viewing angles (54.6° across, 37.3° along), and geometric accuracy (2 µm) are very similar (UC Eagle, 2016).
The camera is suspended in a gyro-stabilized mount and supported by GNSS/INS equipment from IGI (Aerocontrol IMU II-d 256 Hz with drift better than 0.1°/h, NovAtel OEM V-3).
2.2 Flight planning
The use of existing DTM data for planning is essential, especially for alpine environments. Special care has to be placed on spatial coverage, ground-sampling distance (GSD),
forward overlap (should be 75% or better for DIM purposes), lateral overlap (strong impact on mission costs, preferably 50% or better), and exposure intervals (might become critical with great terrain-height variations in a given strip).
Due to project requirements, the shape of the perimeter is often far from optimal (rectangular with a well-balanced relation between length and width). Areas of interest like skiing slopes or glacier tongues are typically long-stretched with “tentacles” down the main valleys.
In many cases, extensions must be made to form a block that allows for benevolent error propagation up to the boundaries of the actual area of interest. Variable flight directions as well as cross and valley strips may be required, especially if great height ranges must be covered.
Re-flights due to missing coverage and/or insufficient resolution are very costly (or even impossible in case of rapid surface changes) and should be generally avoided.
2.3 Mapping mission
To fulfil the demanding requirements of high-alpine surveying missions, the time window for data acquisition must be chosen very precisely. Various aspects must be considered:
Seasonal impacts: vegetation status, snow cover; Daily impacts: lighting conditions, weather, wind; Special requirements from customers (e.g. change
analysis in a specific period of the year).
As a consequence time windows for data acquisition are usually very short; often a quick response is essential, in particular for disaster documentation.
2.4 Georeferencing
A very critical stage in every photogrammetric project – and especially in alpine environments – is the determination of image orientation which is generally achieved by GNSS/INS-supported Aerial Triangulation (AT). Although very valuable as an approximate step, direct georeferencing does not provide the required accuracy level.
Alpine areas are characterised by steep, often inaccessible, and partly homogeneous surfaces. Therefore, georeferencing must be made with a minimal number of (possibly signalized) ground control points (GCPs). As inaccurate image orientation would impair the performance of DIM algorithms and, thus, the quality of the final products, special care has to be devoted to uniform tie-point distribution within the images, GNSS/INS data quality, and optimal GCP configuration (in relation to the project perimeter and terrain geomorphology).
Issues impacting georeferencing include:
The geodetic datum and height system of the final products. The used map projection induces position-dependent distortions in planimetry that must be considered also in altimetry.
Earth-curvature and refraction modelling must be adjusted to strategies applied within the DIM software.
GNSS trajectory determination. While precise point positioning (PPP) may be an option for very remote areas, kinematic baseline estimation implying one or more reference stations is generally preferred for demanding alpine missions. Special care must be devoted to correct ambiguity resolution, with The International Archives of the Photogrammetry, Remote Sensing and Spatial Information Sciences, Volume XL-3/W4, 2016
forward/backward differencing being a valuable tool for (internal) quality estimation.
GNSS reference stations: When using an existing network, its spatial characteristics must be considered (separation from and distribution around the project area, absolute height of the stations, atmospheric modelling, etc.). In case of doubt, one or more local reference stations should be deployed.
GNSS/INS integration has made its way from a “nice to have” option to a standard step in most airborne mapping systems. Turn-key solutions exist and yield acceptable results in most mapping missions, especially for stable and high-flying fixed-wing aircraft. Computational settings must fit to the mathematical modelling applied by the AT software (e.g. angle definition, rotation sequence, boresight definition, sensor eccentricity).
Tie-point measurements. The vast majority of tie points are usually derived automatically with adequate quality. However, in case of great GSD variations between neighbouring images (adjacent strips flown on different height levels), lighting and/or shadow changes, systematic errors may arise that must be corrected by statistical analysis and gross-error detection. Manual ties are often required when different flight days are involved. The high overlaps required for DIM projects typically yield very stable image blocks; the high number of multi-ray ties putting a strong weight on the image measurements. A-priori standard deviations. The outcome of
least-squares adjustment is strongly influenced by the choice of relative weighting of tie points (automatic and manual), GNSS/INS data, and GCPs. The a-priori values must be chosen realistically – and it must be analysed whether the choice reflects reality. GNSS trajectory data, e.g., may show very nice internal quality figures but do not fit to the other measurements. One reason might be inadequate tropospheric modelling in projects that require great variation of absolute height between flight strips. GCP distribution. As a rule of thumb, GCPs should be
located in all corners of a photo block. However, this is often not possible in alpine projects. Cross strips may help bridging inaccessible areas. GCP quality is another issue in difficult environments where GNSS masking is a frequent challenge.
Check points. Independent checks raise the reliability of an AT significantly. Independence is achieved by sufficient separation from adjacent GCPs. Most ideally, check points and GCPs form a shifted pattern similar to a chessboard.
Self-calibration by additional parameters. Although often tempting, self-calibration of the camera must be treated with special care in alpine projects. Such photo blocks are often not suited for camera calibration. The additional parameters tend to hide contradictions in the AT that have other origins. Quality control must escort the project through all
phases of georeferencing. The more independent the control is, the higher the reliability of the results.
2.5 Dense image matching
The advances that have been achieved in DIM in the last couple of years are tremendous. Semi-Global Matching (SGM) has revolutionised the field (Hirschmüller, 2008).
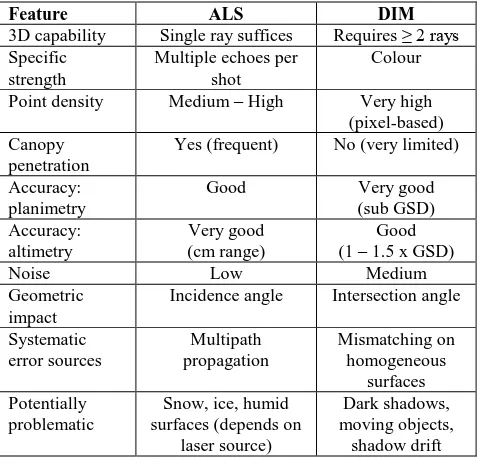
At AVT, we have used the software package SURE (short for Surface Reconstruction) by nFrames since 2013 (SURE, 2016). We have conducted a wide variety of different projects in terms of location, size, environmental conditions, GSD, forward and lateral overlap (Poli et al., 2014). We have learned that DIM point clouds have different properties than ALS point clouds – and that both have their strengths and weaknesses. Clearly, the most fundamental difference is that a photogrammetric 3D point always requires intersecting at least two image rays while laser scanning provides a 3D point from a single shot-echo couple. Several other features are listed in Table 1. Note that this comparison is indicative and may vary dependent on mission parameters.
Table 1: Comparison of some important features of point clouds from ALS and DIM.
Feature ALS DIM
3D capability Single ray suffices Requires ≥ 2 rays Specific
Yes (frequent) No (very limited)
Accuracy: penetration capability is of minor importance.
We have found that the combination of existing ALS point clouds with newly produced DIM point clouds is an optimal approach for DSM/DTM updating and change detection. Thereby, the weaknesses of the one technique may be overcome by the strengths of the other.
2.6 Classification and modelling
In most cases, point clouds are only an intermediate result. DTM generation requires assignment of the points into at least two classes (ground / off-ground), but usually many more are desired (e.g. according to the ASPRS standard). Basically, point clouds from DIM can be handled very similarly as ALS point clouds, keeping in mind the different properties, strengths and weaknesses of the respective technique.
While a point cloud is a 3D data set, both DTM and DSM are only 2.5-dimensional, meaning that for every point in the mapping plane, only one height value exists. Again, the algorithms used for ALS modelling can be applied in a very similar way also for DIM data sets.
3. PROJECT EXAMPLES
At AVT, very promising results have been achieved using aerial images acquired with our UltraCam sensors and our in-house processing chain based on Match-AT and SURE. The projects were executed in 2014 and 2015 for applications like glacier monitoring, disaster documentation, sediment documentation in water reservoirs, and skiing-resort management. In many of these projects, ALS-derived DTMs were available from earlier epochs and could be used for comparison and quality assessment on unchanged elements, or for volume / mass change estimation. In some cases, on-site measurements could be used for checking purposes.
3.1 Example 1: Sediment monitoring at Gepatsch reservoir Gepatsch Ferner is the largest ice glacier in Tyrol. Its melt water feeds Gepatsch reservoir in Kaunertal at around 1770 m. The artificial lake with dimensions of 6 km (north-south) and 1 km (east-west) is formed by a bank dam and is used for electricity generation by the local energy provider TIWAG (Figure 1). Sediment deposit is controlled in a several-year cycle, partly by ultrasonic measurements (max. depth is around 100 m) and partly after draining by airborne methods. In 2010, the surrounding of the reservoir was mapped by helicopter-based ALS and photography, serving as a reference data set for the latest mapping mission performed by AVT.
Figure 1. Gepatsch reservoir seen from the north with high water level (image © www.kaunergrat.at).
The flight mission parameters are summarized in the following:
Project area approx. 6 km² Height range 1610 to 2150 m Mean water level: 1703.75 m Camera: UltraCam Eagle f100
Flight epoch: 11 November 2015, 13:00 CET Three flight strips, 130 images
GSD between 4.5 and 6.5 cm
Overlaps ≥ 75% (forward), ≥ 60% (lateral) GCPs: four (3D) + six (2D)
For quality control, five 3D and eight 2D check points were used. The AT sigma naught was 0.6 µm (0.12 pix). DIM was run in SURE with target resolution of 5 cm, processing on a work station took approx. 50 h. Examples of the resulting DIM quality are shown in Figure 2 and Figure 3. The fine structures of the bank dam (particle size around 2 m) and the sediments accumulated by the river are very well visible.
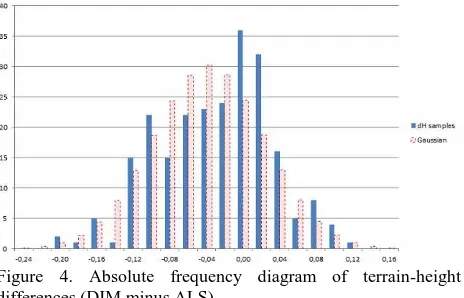
The DIM results were compared to the ALS DTM at 50 cm resolution produced in 2010. The height differences analysed at 230 locations enclosing the reservoir showed an offset of 4.0 cm and a standard deviation of 6.1 cm, with largely random behaviour (see Figure 4). The data fit together within 1 pixel of the photo mission.
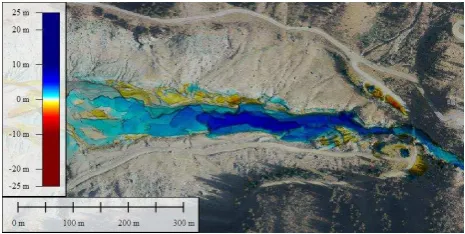
The offset was corrected by adjusting the DIM to the ALS data and then the two data sources were merged. The ALS data were retained in the unchanged parts (especially in the overgrown areas), while the DIM data were used to model the new state of the reservoir floor. The main results are the terrain changes between 2010 and 2015 in the upper sections of the lake. The observed differences are very reliable and correspond with the expectations (Figure 5 and Figure 6; both figures are rotated 90° counter-clockwise).
Figure 2. Example of the DIM point cloud around the dam with the overflow cone in the centre.
Figure 3. Example of an image draped onto the DIM surface.
Figure 4. Absolute frequency diagram of terrain-height differences (DIM minus ALS).
Figure 5. Terrain changes between 2010 and 2015 in the upper zone of the lake.
Figure 6. Detail with cross section of the DTM difference.
3.2 Example 2: Disaster documentation at See / Paznauntal While sediment deposit as shown in the previous example is a relatively slow process, extreme precipitation within short periods often leads to abrupt and – most likely – disastrous alterations of the terrain. Such a situation occurred in early summer 2015 in several valleys west of Innsbruck (Sellrain, Paznauntal). AVT was mandated by the local government of Tyrol and by “Wildbach- und Lawinenverbauung” to document these disasters with accurate airborne mapping data. The example shown here is from the village See in Paznauntal (about 100 km from Innsbruck). In this case, the major challenge was short response time as is typical for disaster monitoring.
The photo mission parameters are:
Project area approx. 12 km² Height range 980 to 2250 m Camera: UltraCam Eagle f100
Flight epoch: 10 June 2015, 09:30 CEST (two days after the landslide)
Eight flight strips, 160 images GSD between 4 and 12 cm
Overlaps ≥75% (forward), ≥ 75% (lateral)
The AT gave sigma naught of 0.8 µm (~ 0.15 pix), then DIM in SURE was run with target resolution 10 cm. The processing time on a work station was about 40 h.
The strong damages caused by the mudflow can be estimated in Figure 7, Figure 8 and Figure 9.
Figure 7. Landslide at See / Paznauntal, © Florian Leitner (www.alpinesicherheit.com/2015/mure-see-paznaun/)
Figure 8. Ortho photo detail from See.
The data processing was done in a very similar way as described in Section 3.1, i.e. the point cloud from DIM was adjusted to and merged with the existing ALS DTM and the terrain changes were taken from the photo mission.
Figure 10 shows an overlay of terrain changes and ortho photo. The dark blue area in the bottom right is the existing flood detention basin that was too small for this extreme event. Its western part collapsed under the vast pressure of the advancing masses, shown in red and orange. The mass balance obtained from our data was considered for the planning of the new flood detention basin.
Figure 9. Surface changes visualized on the image-based DSM. The International Archives of the Photogrammetry, Remote Sensing and Spatial Information Sciences, Volume XL-3/W4, 2016
Figure 10. Ortho photo detail overlaid by terrain changes in the village part close to the flood detention basin.
Figure 11 shows a zoom in the upper part of the torrent, where break-lines and uprooted trees are clearly visible. Our results were very well in line with expert estimations of the magnitude of the mudslide.
Figure 11. Ortho photo detail overlaid by terrain changes in the upper section of the torrent. The profile direction is from northwest to southeast.
3.3 Example 3: Up-to-date terrain modelling in Oetztal and Pitztal
Oetztaler Gletscher (Soelden) and Pitztaler Gletscher are well-known glacier skiing resorts in Tyrol. AVT has been working in both areas for several decades and was mandated with two airborne mapping projects in 2014 and 2015. Both campaigns are characterized by very demanding accuracy requirements (standard deviations of 10 cm in planimetry and 15 cm in altimetry, respectively) and great height ranges (more than 1700 m in 2014 and more than 2000 m in 2015, respectively). The latter require very careful analysis of tie-point residuals in the AT. The DIM target resolution was 10 cm in both cases. The aim of the earlier campaign was the generation of high-resolution geodata (DOP with 10 cm high-resolution, DTM with 25 cm resolution) as planning criteria for the connection of the two skiing resorts by a chain of new ropeway assets.
The aim of the second campaign was the production of accurate DTM data as basis for precise ski-slope management. Thereby, the current local snow depth is derived from RTK-GNSS measurements taken during ski-slope grooming and comparison with the snow-free terrain height at the same spot. Accurate knowledge of the current spatial distribution of snow magnitude allows for optimized resource management (technical snow production, ski-slope grooming). Especially for glacier areas, the currentness of the DTM data is decisive for the correct function of the snow-depth measurements.
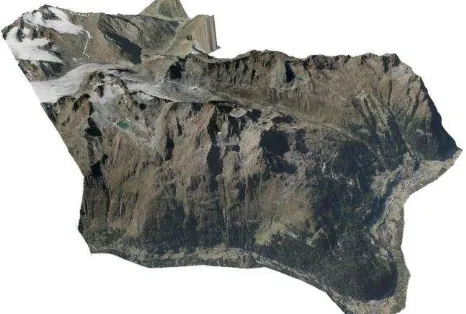
The parameters of the two flight missions and AT results are summarized in Table 2; a combined perspective overview is shown in Figure 12. Although the 2015 flight covers a larger area and a greater height range, the number of images is lower than in 2014. This is due to the increased footprint of the UC Eagle compared to the UC-XP.
Table 2. Mission parameters and AT results for Oetztal and Pitztal.
2014 2015
Project area approx. (km²) 45 60
Height range (m) 1680-3440 1310-3370
Camera type (UC) XP Eagle f100
Flight date 04 Oct. 30 Aug.
Flight time (CEST) 11:20-13:20 15:30-17:20 Flight strips / images (total) 27 / 1144 21 / 1078 Cross / valley strips included 3 / 0 3 / 3
GSD range (cm) 3.3-12.3 3.7-11.6
Overlap forward / lateral (%) ≥75 / ≥ 50 ≥ 75 / ≥ 50 AT: sigma naught (µm / pix) 1.1 / 0.18 0.7 / 0.13
SURE processing time 180 h 150 h
A partial area of some 8 km² is covered by both campaigns. This allows analysing the retreat of the skiing glaciers in Oetztal within a period of 11 months (Figure 13). The results are biased by the partial snow cover in the 2014 mission that was completely missing in the 2015 mission (such differences in conditions at flight epoch must always be taken into account when analysing differences). The very plausible difference results document that the relative homogeneity of the snow surfaces does not pose a problem to DIM.
ALS DTM data from 2010 were available for the complete mission area of 2014. As in the previous examples, the very good correspondence of the DTM data from ALS and DIM could be confirmed even for these very challenging missions (Figure 14).
Figure 12. Perspective overview of the mission areas (2015 foreground, 2014 background), view direction west.
Figure 13. Retreat of the skiing glaciers in Oetztal between 04 Oct. 2014 and 30 Aug. 2015. Rectangular cyan and blue areas close to the glaciers show snow reservoirs covered by protective foil.
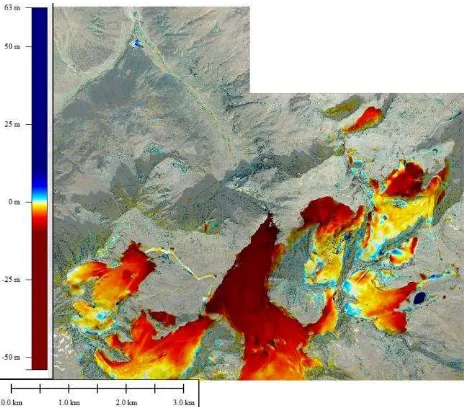
Figure 14. Retreat of the glaciers in Pitztal and Oetztal between 2010 and 2014. Maximal vertical melting is more than 50 m at the tongues.
4. CONCLUSIONS
In the last years, AVT has gathered large experience in the surface- and terrain modelling of high-alpine areas using DIM, through various projects in Austria, Germany and Italy. If flight planning and georeferencing are conducted with special care to terrain morphology and cover, and suitable DIM algorithms are used (in our case, SURE by nFrames), it is possible to generate 3D point clouds with comparable accuracy as in ALS, even on areas where traditionally photogrammetry was not performing well.
From the results shown, DIM proved to be an excellent approach for terrain updating and change detection. It is particularly well suited for alpine environments including glacier monitoring where canopy penetration is of minor importance. It can even be the preferred solution compared to ALS as it is not concerned by reflectance problems over snow and ice. Furthermore, the efficiency of large-format digital cameras (resolution, footprint size) outrivals even the latest laser scanners.
ACKNOWLEDGEMENTS
We thank our customers Tiroler Wasserkraft AG, Wildbach- und Lawinenverbauung, Amt der Tiroler Landesregierung, Oetztaler Gletscherbahnen and Pitztaler Gletscherbahnen for the contracts and the possibility to use the data in this paper.
REFERENCES
Janke, J. R., 2013. Using airborne LiDAR and USGS DEM data for assessing rock glaciers and glaciers. Geomorphology Volume 195, 1 August 2013, Pages 118–130.
Helfricht, K., Kuhn, M., Keuschnig, M., Heilig, A., 2014. Lidar snow cover studies on glaciers in the Ötztal Alps (Austria): comparison with snow depths calculated from GPR measurements. The Cryosphere, 8, 41–57.
Hirschmüller, H., 2008. Stereo Processing by Semi-Global Matching and Mutual Information. IEEE Transactions on Pattern Analysis and Machine Intelligence, 30(2), pp. 328-341.
Immerzeel, W.W., Kraaijenbrink, P.D.A., Shea, J.M., Shrestha, A.B., Pellicciotti, F., Bierkens, M.F.P., de Jong, S.M., 2014. High-resolution monitoring of Himalayan glacier dynamics using unmanned aerial vehicles. Remote Sensing of Environment, 150, pp. 93-103.
Poli, D., Legat, K., Gasser, R., Picchio, S., Bucceri, N., Gariboldi, D., 2014. La fotogrammetria area per la modellazione 3D del territorio in automatico: la Provincia di Venezia. Atti Conferenza ASITA 2014 (on CDROM).
SURE, 2016. http://nframes.com/ (last access January 2016).
UC Eagle, 2016.
http://www.microsoft.com/en-us/ultracam/ultracameagle.aspx (last access January 2016). The International Archives of the Photogrammetry, Remote Sensing and Spatial Information Sciences, Volume XL-3/W4, 2016