CONSTRUCTING A COMPREHENSIVE TOOL FOR DERIVING DRAINAGE
NETWORK USING SEMI-OPEN SOURCE TOOLS AND COMPARISION ON
DIFFERENT DEM DATA SOURCES
Prasun Kumar Gupta a, Pratik Yadav a, *,
a Indian Institute of Remote Sensing, Dehradun - (prasunkgupta, pratik.yadav.284)@gmail.com
Commission IV, WG VIII/9
KEY WORDS: Drainage network, DEM, Hydrology tools, Python, ArcPy
ABSTRACT:
Digital elevation model (DEM) provides elevation information in raster format for an area which help in analysis as these phenomena are gravity depended. Hydrological study requires creation of drainage network map. DEM is the primary input for this process. Generally 6 or more processes are required to be completed to get the drainage network. These are available in form of hydrology tools in the ArcGIS software. These processes are manual and time consuming which increases the chances of human error. An automated process is constructed in this paper which aims to create a tool that can handle multiple files in an intelligent manner.
The input DEM plays a significant role in hydrological studies. This study attempts to do a comparative study to analyse the variation in the drainage network and the intermediate products with the change in the input DEM.
A tool is created using ArcPy site package in Python programming language to integrate all required hydrology tools. The script is then used to create a tool in ArcGIS 10 which takes location as an input parameter and perform the process on all the DEM files inside the directory. The tool creates separate directory for every DEM file and thus reduces the chances of file mismanagement. The proposed tool is tested on two different datasets namely ASTER GDEM and Cartosat DEM. The tool runs efficiently on both the datasets and thus provides results to compare the drainage pattern produced by these different data sources.
1. INTRODUCTION
DEM or Digital Elevation Models are raster datasets that store elevation points for very pixel. These height points or elevation data is very essential in the hydrological modelling as these phenomena are gravity depended and thus the height plays an important role in their study (Callow, Van Niel, & Boggs, 2007). The current ecosystem of GIS software provide a tools related to hydrological studies but lack in file handling and integration of various tools which are dependent on each other for input. These tools help to analyse and study the drainage pattern of a terrain. The primary input is the DEM of the terrain for these tools (Elgy, 2001). Further hydrological processing tools depends on the resolution of this input DEM (Li & Wong, 2010). Thus for a same area the drainage pattern can have variation depending on the input DEM resolution.
The current study will try to construct a tool that integrate and automate the various hydrology tools available in ArcGIS to analyse drainage pattern using ArcPy (Dobesova, 2011, Zandbergen, 2013). The comparison of various DEM sources and the variation of the tool output on the input DEM data are also studied.
2. BACKGROUND
ArcGIS 10 provides 12 tools in the hydrology toolbox section which are 1)Basin 2)Fill 3)Flow Accumulation 4)Flow Direction 5)Flow Direction 6)Flow Length 7)Sink 8)Snap Pour point 9)Stream link 10)Stream order 11)Stream to Feature and
* Corresponding author.
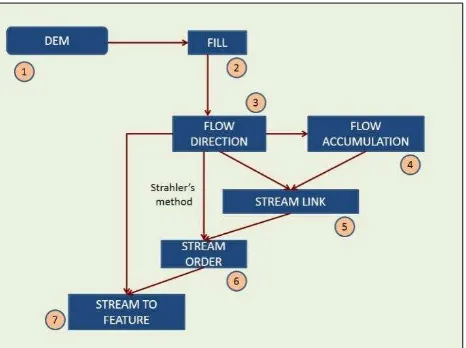
12)Watershed. A majority of these tools uses the output of the previous tool and thus are interdependent. Out of the 12 tools, 6 tools are used to produce feature data from a raster DEM input. This process is widely used by hydrology experts and is generally time consuming (Zhan & Huang, 2004). Also if the number of files is large it becomes a tedious job and chances of human errors increase. Thus tools which automate the process and capable to handling files in an efficient manner will be very useful as it will reduce the time and chances of errors. The primary input is DEM raster file and the further dependence is described in Fig 1.
Figure 1. The flow dependency of various tools on each other. The International Archives of the Photogrammetry, Remote Sensing and Spatial Information Sciences, Volume XL-8, 2014
ISPRS Technical Commission VIII Symposium, 09 – 12 December 2014, Hyderabad, India
This contribution has been peer-reviewed.
3. METHODOLOGY
The primary task was to first develop a workflow of how the tools are dependent on each other and understanding the parameters related to each tool. Following is the detailed description of the tools and their required parameters.
1. Fill – Since a DEM file can have inaccuracy causing creation of sink area in the result, it is required to apply FILL tool which takes DEM file as input and produces sink less DEM raster file as output.
2. Flow Direction –This tool creates a raster of flow direction from each cell to its steepest down slope neighbour. The input is the DEM raster file and the output is a raster with each pixel depicting a direction in the form of a colour (8 directions).
3. Flow Accumulation – This tool creates a raster of accumulated flow into each cell. The input is the flow direction file and the output is a raster with each cell depicting the numbers of cells accumulating their flow towards it. Thus the higher value indicates that the specific cells receives more accumulation and can be identified a potential water stream.
4. Stream link –This tool assigns unique value to section of a raster linear network between intersections. It takes 2 raster inputs which are flow accumulation and flow direction and gives a raster as output
5. Stream order- This tool assigns a numeric order to the streams depending on the number of streams join as a branch. It takes stream link and flow direction as input and produces a raster where different colours depict the various order of the streams.
6. Stream to Feature – This tool coverts the raster stream network to a vector format where line features represent different. It takes stream order and flow direction as input and produces a shape file as output.
Figure 2. The workflow of the tool
The second task was to tackle the issue of file handling. A work flow, as represented in Fig 2, was formulated. As shown in the figure, the user will input a Location/Directory contain various DEM files in IMG format and the Location/Directory where he wants to store the output. The algorithm will use the name of the files and make directory in the output folder to store the produced files. For every DEM file, as specific directory will be made and will contain the various produced output files.
Figure 3. The GUI of the tool in ArcGIS.
Using ArcPy module, a script was constructed which where these tools were combined. The script was then used to create the tool in ArcGIS 10. The option to create files was given with the help of check box thus enable user to select which files he wants to create. The produced tool’s GUI is shown in the Fig 3.
Figure 4. Location of Study area located in the Siwaliks region. The International Archives of the Photogrammetry, Remote Sensing and Spatial Information Sciences, Volume XL-8, 2014
ISPRS Technical Commission VIII Symposium, 09 – 12 December 2014, Hyderabad, India
This contribution has been peer-reviewed.
Figure 5. Terrain map of Dehradun and selected part of DEM
The created tool is used on two different DEM dataset which are (1) ASTER GDEM 30m resolution and (2) Cartosat 1 DEM 30m resolution. The study area selected was a hilly terrain area near Dehradun, Uttarakhand, India which is in the Himalayan-Siwaliks region and provides a good area for hydrological study due to its hilly terrain. The same year dataset for the study area was acquired and thus two sets of data were created using the tool, depicting the same area, but with input of different resolutions.
Figure 6. Cartosat Pan DEM and ASTER GDEM of study area.
4. RESULTS
The tool performs its function efficiently and produces separate directories for every input file. Its saves only the one which are selected by the user in the tool GUI and thus avoids saving of intermediate files which are not required by the user and helps to reduced wastage of storage space.
Figure 7. The output feature shape file of the process on ASTER DEM and Cartosat DEM.
The tool was tested for its time efficiency by comparing the same amount of work done by a professional GIS expert and the tool performs much faster than the user with zero errors. The various output files produced in the process are compared in Fig 7 and 8.
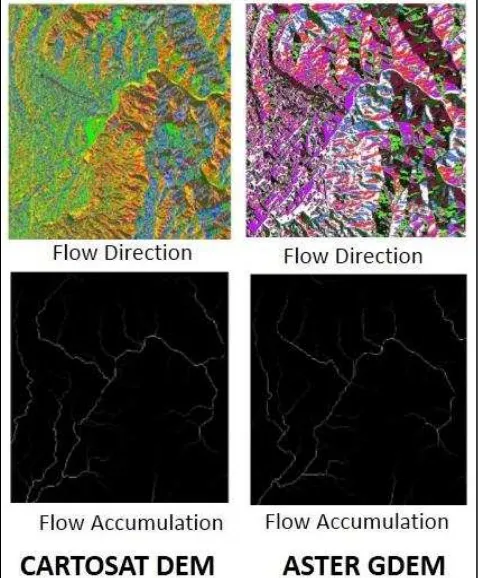
The close observation on the features shows that the output Cartosat DEM is much variation from ASTER GDEM. This observation is same almost for all the intermediate output raster files.
Figure 8. Flow direction (top) and flow accumulation (bottom) raster produced by the tool using different DEM.
5. CONCLUSIONS
Thus the proposed tool is capable of handling multiple files in an intelligent manner and performs the various functions of hydrology. The tool is capable to operate much faster than the usual manual approach.
Since the tool integrates six hydrology tools in one master tool it significantly reduces effort and time used for such analysis. The tool can handle multiple DEM files in a given folder and store output in different folders for each of the input DEM files. This tool is much faster than the conventional method of using various tools separately and creates an error free workflow with no chances of mistakes (as observed in the test run).
There were a few limitation of the proposed tool. The basin tool has not been integrated. But, this can be improved on in the further versions. At present only small datasets can be handled. Only layer files can be presently used in the tool. The naming of file should also be checked as Arc GIS has a specific number of characters for saving file
The International Archives of the Photogrammetry, Remote Sensing and Spatial Information Sciences, Volume XL-8, 2014 ISPRS Technical Commission VIII Symposium, 09 – 12 December 2014, Hyderabad, India
This contribution has been peer-reviewed.
REFERENCES
Callow, J. N., Van Niel, K. P., & Boggs, G. S. (2007). How does modifying a DEM to reflect known hydrology affect subsequent terrain analysis?, Journal of Hydrology, 332(1-2), 30–39. doi:10.1016/j.jhydrol.2006.06.020
Dobesova, Z. (2011). Programming language python for data processing. In Electrical and Control Engineering (ICECE), 2011 International Conference on, 4866-4869. IEEE.
Elgy, J. (2001). Airborne remote sensing for urban drainage.
Urban Water. Retrieved from
http://www.sciencedirect.com/science/article/pii/S146207 5801000383
Li, J., & Wong, D. W. S. (2010). Effects of DEM sources on hydrologic applications. Computers, Environment and
Urban Systems, 34(3), 251–261.
doi:10.1016/j.compenvurbsys.2009.11.002
Zandbergen, P. A. (2013). Python scripting for ArcGIS. Esri Press. ISBN:1589482824
Zhan, X., & Huang, M.-L. (2004). ArcCN-Runoff: an ArcGIS tool for generating curve number and runoff maps.
Environmental Modelling & Software, 19(10), 875–879.
doi:10.1016/j.envsoft.2004.03.001
The International Archives of the Photogrammetry, Remote Sensing and Spatial Information Sciences, Volume XL-8, 2014 ISPRS Technical Commission VIII Symposium, 09 – 12 December 2014, Hyderabad, India
This contribution has been peer-reviewed.