CLIMATE AND LULC CHANGE SCENARIOS TO STUDY ITS IMPACT ON
HYDROLOGICAL REGIME
S. P. Aggarwal1, Vaibhav Garg, Prasun K. Gupta, Bhaskar R. Nikam and Praveen K. Thakur
Indian Institute of Remote Sensing, Indian Space Research Organisation, Dept. of Space, Govt. of India, 4, Kalidas Road, Dehradun– 248 001, Uttarakhand, India - (spa, vaibhav, prasun, bhaskarnikam, praveen)@iirs.gov.in
Commission VIII, WG VIII/4
KEY WORDS: hydrology, climate, modeling, impact analysis, remote sensing, GIS
ABSTRACT:
Climate change, whether as a natural cycle variability and/or due to anthropogenic reasons, is affecting and likely to further affect the water resources, which is a vital necessity for existence of life form. The predicted intensification of hydrological cycle would change all of its constituents both in time and space domain. This is a long term phenomenon and the necessity is to understand the intensity of the effects on various aspects of water resources by way of scientific studies backed by the available field data. Therefore, in the present study, the impact of climate and land use land cover change on entire India under different assumed plausible hypothetical scenarios has been studied. These scenarios were developed by increasing; temperature by 1, 2 and 30C; rainfall by 5, 10 and 15%; and then the combination of both. To carry out this analysis, variable infiltration capacity (VIC) semi-distributed macroscale hydrological model has been investigated. It was found that slight change in climate may pose huge difference on hydrological cycle and its component.
1
Corresponding author.
1. INTRODUCTION
Since the beginning of concern over the possible consequences of global warming, it has been widely recognized that changes in the cycling of water between land, sea, and air could have very significant impacts across many sectors of the economy, society, and the environment. The climate change and its impact on hydrological processes are of widespread concern and a great challenge to researchers and policy makers in this changing environment. Moreover, understanding the hydrologic response of very large river basins or entire country offers new challenges and opportunities for hydrologists. The impacts of climate change on hydrology usually are studied by defining scenarios for changes in climatic inputs to a hydrological model in two ways: (i) studies using GCM/RCMs directly to predict impact of climate change scenarios (ii) studies using hydrological models with assumed plausible hypothetical climatic inputs (IPCC, 2001b). The three key issues confronted here are: constructing scenarios that are suitable for hydrological impact assessments; developing and using realistic hydrological models; and understanding better the linkages and feedbacks between climate and hydrological systems. In the present analysis these issues were critically analysed and addressed as discussed below.
The rainfall and temperature drives the hydrological cycle, influencing hydrological processes in a direct or indirect way. A large number of studies have been carried out to analyze the trends of variation in these parameters over India/Indian Sub-continent. The projections indicate that the warming would vary from region to region, accompanied by increase and decrease in precipitation (Sahai et al., 2003; Gadgil et al., 2004; Goswami et al., 2006; Ghosh et al., 2009). In addition, there would be change in the variability of climate, and changes in frequency and intensity of some extreme climatic phenomenon. Flood
magnitude and frequency are likely to increase in most regions, and low flows are likely to decrease in many regions. However, there have been very few studies addressing the issue directly, largely due to difficulties in defining credible scenarios for changes in flood producing climatic events. As it may be observed from these findings, studies using hydrological model with assumed plausible hypothetical climatic inputs would be useful for assessing impacts of climate change on water resources. The evolution of soil-vegetation-atmosphere transfer schemes (SVATS) models, those are applicable to large areas and river basins, has solved the second and third issue to large extent. Therefore, in the present study, the impact of climate and land use land cover change on entire India under different assumed plausible hypothetical scenarios has been studied.
2. STUDY AREA AND ITS CLIMATE
India has been known for vast variability in availability of water resources in the country. The main land mass of India is located between 8o4’ N and 37o6’ N latitude to 68o7’ E and 97o25’ E longitude with the geographical area of 3,287,263 km2. India is endowed with almost all the important topographical features such as high mountains in north, extensive plateaus, wide plains traversed by mighty rivers and ocean in south which influence its climate. That is why; India is a country with extremes of climate. The presence of Himalaya has an important bearing on the climate and water resources of the country. The Himalayan ranges are the primary source of rivers which derive their flow from rainfall, snow and glacier melt. Moreover, Himalayas act as a meteorological barrier due to which the Indian sub-continent experiences tropical monsoon. The temperature in country varies from 47oC at many places in summer to low as -40oC at few places in Himalayas. The rainfall distribution is also extreme as some places receive negligible rainfall, where,
Cherrapunji alone receives highest rainfall in the world around 11,000 mm per annum. These widely varying climatic conditions in conjunction with range of topographic and soil properties lead to a complex water resources distribution over the country.
In India several studies have been carried out to determine the changes in temperature and rainfall and its association with climate change. However, investigators used different data length and now studies have been reported using more than a century data.
2.1 Temperature Trend in India
A study by Pant and Kumar (1997) on the seasonal and annual air temperature of India from 1881 to 1997 shows that there has been an increasing trend of mean annual temperature by the rate of 0.570C per 100 years. The trend of all India mean annual surface air temperature anomalies is shown in Figure 1. An analysis of temperature data of 125 stations distributed all over India shows an increase of 0.420C, 0.920C and 0.090C in annual mean temperature, mean maximum temperature and mean minimum temperature respectively over the last 100 years (CWC and NIH, 2008). In a similar study, Hingane et al. (1985) analysed long term temperature records (1901 - 1982) of 73 stations and again found increasing trend of mean annual surface air temperature over India. It was observed that about 0.40C warming has taken place on country scale during the period of eight decades. It has been observed that the changes in temperature in India/Indian-Subcontinent over last century are broadly consistent with global trend of increase in temperature. However, the studies carried out on regional basis show varying trends. Hingane et al. (1985) observed that trend of increase in mean annual temperature over the entire country was a result of rise in the maximum temperature; but later studies carried out by Sinha Ray et al. (1997) have shown that the changes in mean annual temperature are partly due to rise in the minimum temperature related to enhanced extent of urbanisation. Thereafter findings by Mukhopadhyay et al. (1999) have confirmed that there is clear signal of urbanisation in these warming, i.e. that there is a steeper rise in the minimum temperature in urban locations. Further, examination of long-term variation in the annual mean temperature of highly industrial and densely populated cities like Mumbai and Kolkata has shown increasing trend in annual mean temperature by 0.840C and 1.390C per 100 years, respectively (Hingane, 1995). These warming rates are much higher than the values reported for the country as a whole.
Figure 1. All India mean annual surface air temperature anomalies (1881 - 1997) [Source: Pant and Kumar (1997)]
2.2 Rainfall Trend in India
Studies related to change in rainfall over India have shown that there is no clear trend of increase or decrease in average annual rainfall over the country (Mooley and Parthasarathy, 1984; Sarkar and Thapliyal, 1988; Thapliyal and Kulshrestha, 1991; Lal, 2001). The examination of trend of annual rainfall over India has indicated that 5 year running mean has fluctuated from normal rainfall within ± one standard deviation (Thapliyal and Kulshrestha, 1991). Summer monsoon rainfall anomalies for all India are shown in Figure 2. Though the monsoon rainfall in India is found to be trendless over a long period of time, particularly on the all India scale (Mooley and Parthasarathy, 1984), but there are pockets of significant long-term rainfall changes (Koteswaram and Alvi, 1969; Jagannathan and Parthasarathy, 1973; Raghavendra, 1974; Chaudhary and Abhyankar, 1979).
A comprehensive study using the monthly rainfall data for 306 stations distributed over India was attempted by Rupa Kumar et al. (1992). It was noticed that areas of north-east peninsula, north-east India and north-west peninsula indicate widespread decreasing trend in the Indian summer monsoon rainfall. On the other hand, a widespread increasing trend in monsoon rainfall over the west coast, central peninsula and north-west India. The decreasing trend ranges between -6 to -8% of the normal per 100 years while the increasing trend is about 10 to 12%.
Figure 2. All India summer monsoon rainfall anomalies (1871 - 1999) [Source: Lal (2001)]
A warmer climate may lead to intensification of the hydrological cycle, resulting in higher rates of evaporation and increase of liquid precipitation. These processes, in association with a shifting pattern of precipitation, may affect the spatial and temporal distribution of runoff, soil moisture, groundwater reserves etc. and may increase the frequency of droughts and floods. Increase in extreme climatic events will be of great consequence owing to the high vulnerability of the region to these changes.
3. SCENARIO DEVELOPMENT
In order to predict the future change in temperature as well as temporal and spatial variability in monsoon rainfall over India, many studies have been carried out. In one such analysis, Lal (2001) developed the four SRES emission scenarios based on the data generated in numerical experiments with Atmosphere and Ocean coupled Global Circulation Model of the CCSR/NIES, Japan. It was projected that over the inland regions of the Indian sub-continent, the mean surface
temperature may rise between 3.50C and 5.50C by 2080. On seasonal basis, the projected surface warming is higher in winter then during summer monsoon. The spatial pattern of temperature change has a large seasonal dependency. The spatial distribution of the surface warming suggests that north India may experience an annual mean surface warming of 30C rise or more by 2050s. GCM models have simulated peak warming of 30C over north and central India in winter. Over much of the southern peninsula, the warming is likely to be under 20C during winter season. The surface temperature rise would be more pronounced over northern and eastern region (~20C) during the monsoon season.
The increase in annual mean precipitation over the India sub-continent is projected to be 7 to 10% by 2080s. Winter precipitation may decrease by 5 to 25% in the Indian sub-continent. An increase of 10 to 15% is projected in area average summer monsoon rainfall over the Indian sub-continent. Over north-west India, during monsoon season an increase of about 30% or more is suggested by 2050s. The western semi-arid margins of India could receive higher than normal rainfall in the warmer atmosphere. It is also likely that date of onset of summer monsoon over India could become more variable in future. IPCC (2001a, b) has indicated that variability in Asian summer monsoon is expected to increase along with changes in the frequency and intensity of extreme climate events in this region. All climate models simulated an enhanced hydrological cycle and increase in annual mean rainfall over South Asia (under non-aerosol forcing). Future projection of increase in temperature and changes in precipitation over Indian subcontinent are shown in Table 1.
Table 1. Climate change projections for the Indian sub-continent [Source Lal (2001)] Based on these studies and IPCC A2/B2 recommendations, 16 hypothetical combination of scenarios were developed for the present analysis by increasing; temperature by 1, 2 and 30C; rainfall by 5, 10 and 15%; and their combination.
4. HYDROLOGICAL MODEL SET-UP AND DATA ASSIMILATION
An effort has been made to investigate advantageous SVAT ‘variable infiltration capacity (VIC)’ model to assess runoff potential and other hydrological components for entire India. VIC is a semi-distributed macroscale hydrological model designed to represent surface energy, hydrological fluxes and states at scales from large river basins to the entire globe (Liang, 1994; Liang et al., 1994; Liang et al., 1996). It is grid based model which quantifies the dominant hydro-meteorological
process taking place at the land surface atmospheric interface. In the present study, the model was forced with daily precipitation, maximum and minimum air temperature procured from Indian Meteorological Department (IMD) at daily time step on 25 x 25 km grid. The 25 x 25 km grid map laid over land mass of India is shown in Figure 3. It was identified that 4707 number of grids lie on land mass and are to be run for analysis. The base map in the figure is GTopo30 digital elevation model (DEM) with resolution 3 arc seconds, which has been used for elevation and slope parameters.
Figure 3. GTopo 30 DEM map of India showing its location In order to implement VIC model, five main input files are required namely forcing, soil parameter, vegetation parameter, vegetation library and global parameter file in ASCII format. 4.1 Meteorological Forcing File
In the present study, as the model was employed in water balance mode, the meteorological parameters considered to force the model were daily precipitation, daily minimum and maximum temperature. The 0.50 x 0.50 precipitation; and 10 x 10 minimum and maximum temperature gridded data of IMD have been procured for the period of 1991 - 2005 (Rajeevan and Bhate, 2008). For each grid, forcing files containing daily precipitation, minimum and maximum temperature from 1991 to 2005 have been generated using the programming in IDL. 4.2 Soil Parameter File
The soil parameter file describes the unique soil properties (in addition to several other variables) for each grid cell in the model domain. As mentioned above VIC2L has been adopted in the present analysis, hence, 02 layers of soil with 300 mm and 700 mm depth have been considered. The soil information, namely soil texture, bulk density and saturated hydraulic conductivity correspond to each layer depth has been extracted from FAO’s digitized soil map of the world at scale of 1:5,000,000 (FAO, 2003). The related other soil variables such as maximum velocity of baseflow; fraction of maximum soil moisture where non-linear baseflow occurs; average soil temperature; particle density; fractional soil moisture content at the critical and wilting point; surface roughness; residual moisture of each layer have been picked as the standard values, those are provided at VIC website. All these parameters have been designated for each grid along with its longitude, latitude, median elevation, mean annual rainfall and initial soil moisture to initiate the model.
4.3 Vegetation Parameters and Vegetation Library File
The vegetation parameter and vegetation library files were prepared from global land cover classification map generated by The University of Maryland Department (UMD) of Geography at a 1 km nominal spatial resolution (Hansen et al., 1998; 2000). The vegetation parameter file defines the number of vegetation types in each grid cell, along with their fractional coverage, root depth and its fraction. The vegetation library file defines the different landcover types allowed in the simulation and corresponding influencing parameters namely architectural resistance; minimum stomatal resistance; leaf-area index; shortwave albedo; vegetation roughness length and displacement height; trunk ratio; and height at wind speed is measured. In this file, a flag has to be assigned to indicate whether or not the current vegetation type has an overstory. The values of these parameters correspond to each LULC class is available in LDAS 8th
database and MM5 Terrain dataset (http://ldas.gsfc.nasa.gov/nldas/NLDASmapveg.php).
4.4 Global Parameter File
This is the main input file of VIC model which sets simulation options, such as start/end dates and modes of operation; compiling the locations of the above prepared input files and directory which will store output files.
5. RESULTS AND DISCUSSION
The hydrological simulation of the entire India has been carried out using VIC model at 25 x 25 km grid. Initial run was carried out for the base year 1995, which was normal rainfall year. It was found that the estimated runoff is in close agreement as per Indian conditions. The perfect water balance resulted for entire landmass of India in the base year, provided impetus to study the impact of climate/land cover change by developing various scenarios.
The set up VIC hydrological model was run for modified meteorological forcing files based on rainfall and temperature increase as per scenarios developed. It was found that runoff increase manifold with increase in overall rainfall percentage. However, increase in temperature, which is mainly attributed due to urban sprawl, reduces the runoff generation slightly. The time series of estimated runoff for each scenario is presented in Figure 4. A table of summary of analysis of each scenario is given in Table 2. It can easily be noticed that increase in rainfall, increase runoff manifold, whereas, increase in temperature reduces runoff slightly.
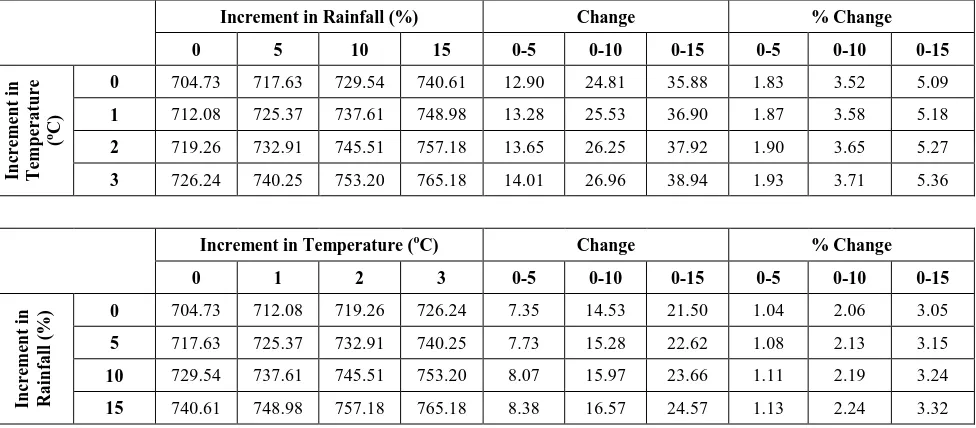
Simultaneously, an analysis to study the effect of climate change on evapotranspiration (ET) for the developed scenarios has also been carried out. The summary of results is presented in Table 3. It can be seen that ET is showing increasing trend in both the cases.
Increment in Rainfall (%)
0 5 10 15
In
crem
en
t i
n
T
em
p
era
tu
re (
0 C)
0
1
2
3
Increment in Temperature (0C)
0 1 2 3
In
crem
en
t i
n
R
a
in
fa
ll
(
%)
0
5
10
15
Figure 4. Time series of estimated runoff of each scenario
Table 2. Summary of runoff estimation analysis of each scenario
Increment in Rainfall (%) Change % Change
0 5 10 15 0-5 0-10 0-15 0-5 0-10 0-15
Increment in Temperature (0C) Change % Change
0 1 2 3 0-5 0-10 0-15 0-5 0-10 0-15
Table 3. Summary of ET estimation analysis of each scenario
Increment in Rainfall (%) Change % Change
0 5 10 15 0-5 0-10 0-15 0-5 0-10 0-15
Increment in Temperature (oC) Change % Change
0 1 2 3 0-5 0-10 0-15 0-5 0-10 0-15
In the present study, an attempt has been made to study the impact of climate and LULC change on water resources of India. It has been reported in literature that temperature and rainfall may increase in India in years to come. Therefore, different scenarios were developed with incrementing temperature by 10C, 20C and 30C; rainfall by 5%, 10%, 15%; and combination of these two. The VIC semi-distributed macro-scale hydrological model has been investigated for hydrological simulation.
As a general tendency in land cover change, open forest usually gets converted into agriculture/urban settlement, in such a case, slight increase in runoff and corresponding decrease in ET was predicted. Same kind of trend has been found, in case of agriculture converts into urban/settlements.
In climatic variation scenarios, an increase in runoff and ET has been predicted. It was observed that due to urbanisation temperature increases, and affects the hydrology. Consequently, results in increase in runoff, which may lead to urban flooding also. With increase in rainfall as well as temperature, an increasing trend in ET has been identified. The results are encouraging for climate and LULC change point of view. The model results will help planners in land use policy planning; and formulating mitigation and adaptation in different land cover and climate change scenarios.
It may also be concluded that the VIC model results in idealistic hydrology as it takes into account a large number of parameter influencing the process. It was realized that to study such complex hydrological interaction between land surface and atmosphere over a large region, it requires enormous data, in this regard; remote sensing data may play an important role.
Acknowledgement
The authors sincerely acknowledge the developers of VIC hydrological model and Dr. P.S. Roy, Director, IIRS for all the support extended during this work.
References
pattern foretell Gujarat climate becoming arid. Mausam, 30, pp. 85–90
CWC (Central Water Commission) and NIH (National Institute of Hydrology), 2008. Preliminary Consolidated Report on
Effect of Climate Change on Water Resources. Ministry of
Water Resources, Government of India, New Delhi.
FAO, 2003. The digitized soil map of the world and derived soil
properties (version 3.5). FAO Land and Water Digital Media
Series 1. FAO, Rome.
Gadgil S, Vinayachandran PN, Francis PA, Gadgil S. 2004. Extremes of the Indian summer monsoon rainfall, ENSO and equatorial Indian Ocean oscillation. Geophysical Research
Letters 31: L12213. DOI:10.1029/2004GL019733.
Ghosh, S., Luniya, V. and Gupta, A. 2009. Trend analysis of Indian summer monsoon rainfall at different spatial scales
Atmos. Sci. Let. 10, pp. 285–290.
Goswami BN, Venugopal V, Sengupta D, et al. 2006. Increasing trend of extreme rain events over India in a warming
environment. Science 314: 1442. DOI:
10.1126/science.1132027.
Hansen, M., DeFries, R., Townshend, J.R.G., Sohlberg, R., 1998. UMD Global Land Cover Classification, 1 Kilometer,
1.0, Department of Geography, University of Maryland, College
Park, Maryland.
Hansen, M., DeFries, R., Townshend, J.R.G., Sohlberg, R., 2000. Global land cover classification at 1km resolution using a decision tree classifier. International Journal of Remote
Sensing, 21, pp. 1331-1365.
Hingane, L. S., 1995. Is a signature of socio-economic impact written on the climate? Climatic Change 32, pp. 91–101. Hingane, L. S., Rupa Kumar, K. & Ramanamurthy, B. V., 1985. Long term needs of surface air temperature in India. Int. J.
Climatol., 5, pp. 521–528.
IPCC (Intergovernmental Panel on Climate Change), 2001a.
Climate Change—The Scientific Basis (ed. by J. T. Houghton,
Y. Ding, D. J. Griggs, M. Noguer, P. J. van der Linden, X. Dai, K. Maskel & C. A. Johnson). Cambridge University Press, UK. IPCC, 2001b. Climate Change—Impacts, Adaptations and
Vulnerability (ed. by J. J. McCarthy, O. F. Canziani, N. A.
Leary, D. J. Dokken & K. S. White). Cambridge University Press, Cambridge, UK.
Jagannathan, P., Parthasarathy, B., 1973. Trends and periodicities of rainfall over India. Monthly Weather Review 101, pp. 371–375.
Koteswaram, P., Alvi, S.M.A., 1969. Secular trends and periodicities in rainfall at west coast stations in India. Current
Science, 101, pp. 371–375.
Lal, M. (2001) Climatic change – Implications for India’s water resources. J. Indian Water Resour. Soc., 21, pp. 101–119. Liang, X., 1994. A two-layer variable infiltration capacity land surface representation for general circulation models. Water
Resour. Series, TR140, Univ. of Washington, Seattle.
Liang, X., Lattenmaier, D. P., Wood, E. F. and Burgess, S. J., 1994. A simple hydrologically based model of land surface, water, and energy flux for general circulation models. J.
Geophys. Res., 99(D7), pp. 14,415-14,428.
Liang, X., Lettenmaier, D.P. and Wood, E.F., 1996. One-dimensional statistical dynamic representation of subgrid spatial variability of precipitation in the two-layer variable infiltration capacity model. J. Geophys. Res., 101(D16), pp. 21,403-21,422. Mooley, D.A., Parthasarathy, B., 1984. Fluctuations in All-India summer monsoon rainfall during 1871-1978. Climatic
Change, 6, pp. 287-301.
Pant, G. B., Kumar, K. R. 1997. Climates of South Asia. John Wiley & Sons Ltd., Chichester, UK.
sub-divisions of Maharashtra state. Indian J. Met. Geophys., 25, pp. 197–210.
Rajeevan, M., J. Bhate, 2008. A high resolution daily gridded rainfall Data Set (1971-2005) for Mesoscale Meteorological Studies, NCC res. report no.9.
Rupa Kumar, K., Pant G. B., Parthasarathy, B., Sontakke, N. A. 1992. Spatial and sub-seasonal patterns of the long-term trends of Indian summer monsoon rainfall. Int. J. of Climatol., 12, pp. 257-268.
Sahai AK, Grimm AM, Satyan V, Pant GB. 2003. Long-lead prediction of Indian Summer Monsoon Rainfall from global SST evolution. Climate Dynamics 20: 855–863.
Sarkar, R. P., Thapliyal V. 1988. Climatic change and variability. Mausam, 39, pp. 127–138
Sinha Ray, K. C., Mukhopadhayay, R. K., Chowdhury, S. K., 1997. Trends in maximum minimum temperatures and sea level pressure over India. INTROPMET-97, IIT New Delhi, 2–5 December 1997.
and trends over India. Mausam, 42, pp. 333–338.
![Figure 2. All India summer monsoon rainfall anomalies (1871 - 1999) [Source: Lal (2001)]](https://thumb-ap.123doks.com/thumbv2/123dok/3232929.1396405/2.595.61.287.584.724/figure-india-summer-monsoon-rainfall-anomalies-source-lal.webp)
![Table 1. Climate change projections for the Indian sub-continent [Source Lal (2001)]](https://thumb-ap.123doks.com/thumbv2/123dok/3232929.1396405/3.595.329.513.185.358/table-climate-change-projections-indian-continent-source-lal.webp)