TOTAL COLUMN METHANE RETRIEVALS USING THE TROPOSPHERIC
INFRARED MAPPING SPECTROMETER OVER SUNGLINT
N. Larsen a, *, J. Kumer b, R. Rairden b, K. Jablonski c
a
Lockheed Martin Advanced Technology Laboratories, 4301 N Fairfax Drive, Arlington, VA, USA - [email protected]
b
Lockheed Martin Advanced Technology Center, Palo Alto, CA, USA - (jack.kumer, rick.rairden)@lmco.com c
Lockheed Martin ISGS, Valley Forge, PA, USA - [email protected]
Commission VIII, WG VIII/3
KEY WORDS: Exploration, Oceans, Aerial, Hyper Spectral, Detection, Sensor, Algorithms
ABSTRACT:
Because it is a greenhouse gas, the detection of methane concentrations is a global issue. Additionally, the presence of methane is indicative of potential valuable petroleum and natural gas deposits. Therefore methane seep detection is useful for petroleum exploration around the world. The detection of methane, and other absorbing gases, over water is an issue for passive systems because one is seeking to detect an absorbing gas over an absorbing surface. The solution to this dilemma is to use the sun/sensor geometry for sun glint off of water to measure the absorbing gas over a reflecting surface, and therefore significantly increase the signal to noise of the measurement being taken. In September of 2010 Lockheed Martin performed a proof of concept by demonstrating from an airship over San Francisco Bay the capability of the Tropospheric Infrared Mapping Spectrometer’s (TIMS) hyper spectral sensor to passively measure methane, CO, and water vapor over sunglint water. The Lockheed Martin prototype TIMS sensor system is a hyper spectral grating spectrometer instrument that operates in the 2.3 micron spectral region at 0.25 cm-1 resolution. The Lockheed Martin retrieval algorithm developed applies the kCARTA (kCompressed Atmospheric Radiative Transfer Algorithm) with Jacobians, with the HITRAN 2008 lineshape parameters, to retrieve the total column amount of atmospheric species along with the calibrated TIMS sensors radiometric input. A cell with known amount of methane was placed into the input to the TIMS to simulate atmospheric enhancements near the water surface. The amount in the cell was retrieved well within the uncertainty of 1% of the amount in the cell. Multi frame retrievals on data in which the cell was not placed into the input beam demonstrated 1% precision. In addition, in situ surface measurements were done over a landfill park, where measurements of methane were taken over known hotspots. This research allows for the future development of a system to measure methane, and other gases, for climate and petroleum exploration capabilities.
* Corresponding author. This is useful to know for communication with the appropriate person in cases with more than one author. 1. INTRODUCTION
The Lockheed Martin (LM) Tropospheric Infrared Mapping Spectrometers (TIMS) sensor, (Kumer et al., 2008) currently under development will detect surface enhancements (over the atmospheric background) of methane over land, in addition to the very challenging problem of its detection over water. In addition to being a greenhouse gas of increasing relevance, methane gas seeps are indicative of both subterranean petroleum sources and oil/gas pipeline leaks. LM researchers analyzed Airborne Visible Infrared Imaging Spectrometer (AVIRIS) instrument sunglint imagery of California, and detected positive methane hotspots. These results led LM scientists to demonstrate an innovative proof-of-concept technique for detecting methane over water when sunglint is present. This technique was performed with the TIMS instrument from an airship over the southern waters of San Francisco Bay. The ability to passively image methane, and other absorbing gases, over the water is challenging due primarily to the low Signal-to-Noise (SNR) resulting from a low surface reflectance. By imaging sunglint regions the background reflectance is high, which allows for methane retrievals to be performed. TIMS retrievals were radiometrically calibrated and a LM Methane Retrieval Algorithm developed.
2. METHODS 2.1 Prior Research
In 2008-2009 LM scientists in the Atmospheric Sensing Petroleum and Climate Research (ASPECT) team researched the detection of methane over sunglint using data from the NASA JPL AVIRIS instrument to show sensitivities to methane seeps of ~200 ppm off of the coast of Santa Barbara, CA where well-known hydrocarbon sources exist (Figure 1). Simulation and Modeling had shown that the detection of methane over sunglint was theoretically possible (Larsen and Stamnes, 2006). The AVIRIS imagery used was collected under less than ideal conditions (very low reflectivity of 3-10%– virtually no sun-glint) and for a less than ideal instrument (AVIRIS moderate spectral resolution, compared to the TIMS sensor). Using the AVIRIS Reflectance imagery data at the methane absorption features located near 2.3 microns, the LM ASPECT team developed a Normalized Differential Methane Index (NDMI) to identify the methane seeps over the water, given by Equation 1.
)
where R(2.3) = AVIRIS Reflectance at 2.3 m R(2.1) = AVIRIS Reflectance at 2.1 m
Figure 1. ASPECT Methane detection results, using a Normalized Differential Methane Index to identify regions of high methane content, these points correlated to known seep locations off of Santa Barbara, CA.
The illustration in Figure 1 demonstrates two sequential parallel AVIRIS flight paths (~5 minutes apart): (1) from the Holly Seep with a trajectory across the Goleta Seep, followed by (2) a path downwind of the first path across the Coal Oil Point Seep. In this image the correlation between the methane seeps and the locations of highest NDMI is apparent, with the highest methane amounts (>250 ppm) being over the known seep regions.
Despite the low sunglint in the data, the research demonstrated that the technique is viable, and researchers hypothesized that more accurate results could be obtained under proper conditions with a more advanced instrument. From these positive results the LM team researched the use of the TIMS sensor for measuring methane over sunglint.
2.2 TIMS flown on Airship
In September 2010, LM deployed the TIMS sensor to collect data over sunglint water of the southern tip of the San Francisco Bay as well as over-ground data for in-situ measurements in Mountainview Park, CA. The day turned out to be a success with over 500 sample spectra collected over sunglint, and hundreds of readings taken over both Moffet Field and a park (built over a landfill). It was a perfect day for collecting sunglint data as well, with sunny cloud free skies and little wind.
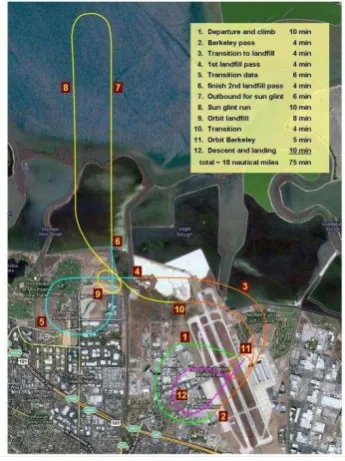
Figure 2 shows the route the airship took over the San Francisco bay area. The airship started over the Moffet Field hangar (1), Flew over Moffet field (2). From Moffet, the airship continued over the Mountainview park landfill where LM took in situ methane measurements (4). After hovering over the park for in situ measurements, the airship headed for gathering sunglint data over the water. The airship made one loop over the water to take numerous samples (7-8). Before heading back
over the landfill, the airship paused for a second collection for ground-based in situ measurements (9), and then back to
Moffett Field
Figure 2. The Route of the Airship with TIMS
to land (12). Hundreds of data samples were taken during this experiment.
2.3 TIMS Sensor
The LM TIMS sensor uses low noise 2D arrays fed by a grating mapping spectrometer. TIMS uses a Littrow spectrometer design, which provides a compact package for achieving high spectral resolution with no moving parts.
A camera was operating and aimed from the airship over the region of measurement (Figure 3). The line in the image represents the TIMS sensor-imaging slit for collecting reflection data from the water below on the camera frame.
Figure 3. Camera image from the Airship over region of no sunglint. Linear line is the TIMS sensors imaging slit.
In Figure 3 the TIMS mirror is not rotated forward and the view is directly to nadir, out of the sunglint area. There is no light reflected up to the airship from the water in this case.
Figure 4 shows the corresponding spectral image of the no-sunglint case, of Figure 3. The TIMS imagery vertical axis is spatial in content, while the horizontal axis is spectral in content. This spectral image is identical with the zero level of the TIMS instrument used in calibration.
Figure 4. TIMS spectral image (spatial on vertical axis, spectral on horizontal axis) over no sun-glint.
Figure 5 shows the camera image for the mirror rotated to look into the ~45° forward sunglint, limited by the airship floor viewport size. The TIMS clear field of view extends to the green line due to a 10 cm offset. The entire length of the slit is fully illuminated by the sunglint region.
Figure 5. Spectral image region outline over the camera image over sunglint
The corresponding spectral image to the previous image (Figure 5) is shown in Figure 6. There are 512 pixels along the spatial extent of the slit (vertical in this image). A 1024 pixel spectrum is laid out horizontal in this image for each of the 512 pixels along the slit. These are atmospheric absorption spectra of CH4, H2O and CO in the sunlight that has passed through the atmosphere and reflected nearly specular (the sunglint) off the surface water back up to the TIM. The slits spatial range
Figure 6. Spectral image used in radiometric calibration spectral dimension is horizontal, while the spatial dimension of the split is along the vertical axis. (vertical axis) is 30.48 m from the airship’s 457.2 m height. The spectral range of the TIMS sensor (horizontal axis) in Figure 6 is 2.3200 to 2.3421 m from left to right, with a spectral resolution of 0.08 nm. The curvature of the spectral lines is a feature of the off axis optical design, which is accounted for in the radiometric calibration. To simulate the presence of a known amount of methane over the water a cell with methane was placed in front of the aperture of the TIMS instrument. Measurements were taken multiple times with and without the cell of methane in place.
For radiometric calibration there were initial concerns of variable sunglint spectral reflectance. However the behavior of reflectance over sunglint in the ShortWave Infrared (SWIR) was constant, so this was not an issue, allowing spectra in the image to be normalized by reflectance ratios. For this analysis two of the 512 spectra available have been analyzed, with one spectra used in the retrieval; this processing may be automated to use more of the spectra to improve the accuracy, and by dwelling upon a location accuracy may be further improved.
2.4 Lockheed Martin Methane Retrieval Processing The LM Methane Retrieval Algorithm uses the UMBC kCARTA (Desouza-Machado et al., 1997). Along with the TIMS calibrated radiometric input the retrieval algorithm uses optical depths computed using kCARTA code. This kCARTA package uses a table of precompressed optical depths, generated using the HITRAN 2008 lineshape parameters, to rapidly compute the actual optical depths for a realistic Earth atmosphere, at a high spectral resolution.
The LM Methane Retrieval Algorithm as a first guess uses the co-located National Oceanic Atmospheric Association (NOAA) National Centers for Environmental Prediction Global Forecast System (NCEP GFS) forecast profiles for temperature, pressure, humidity and ozone fields, as well as the US Standard gas profiles for the rest of the atmospheric gases. The retrieval first uses radiances with no gas cell present. The window channels are used to estimate the surface reflectivity, followed by using the water lines to adjust the column water amount, and the CH4 lines to adjust the CH4 column. Having determined the atmospheric parameters, the retrieval then uses the TIMS radiance spectra with the gas cell present, to first determine a new surface reflectance, followed by a multiplier for the amount of gas present in the cell. The measured and computed radiances are converted to effective brightness temperatures during the retrieval process. Currently the water and CH4 multipliers are determined using a simple scaling adjustment. Incorporation of an Optimal Estimation retrieval scheme in the future could International Archives of the Photogrammetry, Remote Sensing and Spatial Information Sciences, Volume XXXIX-B8, 2012
further enhance speed of processing and performance. A more detailed description of the ASPECT Retrieval Algorithm, illustrated in Figure 7, is the first step is to run the NCEP atmospheric profile, sun/sensor geometry, through KLAYERS algorithm and then kCARTA algorithm two times, this is done to raise the simulated methane column amount, and rerun kCARTA (once using optical depth KLAYER profile (A) and once with perturbed KLAYER profile (B)).
From profiles A and B we have formed our Jacobian matrix. This matrix is the change in the radiance as a function of a change in the amount of methane; the Jacobian derived is then used in a comparison to the measured radiometrically calibrated data to the reflected scaled unit matched spectral radiance. This is a spectral comparison of the difference in measured data and the reflectance scaled unit matched radiance spectra divided by the perturbation amount (or the change of methane in the state
Figure 7. Lockheed Martin Methane Retrieval Processing Diagram
of the system). The result is a calculated spectra that is generated applying the methane perturbation amount, and the difference from the measured spectra and is determined. If this value is near the order of the noise then the spectra agrees with the measurement, if not then one must resume the loop illustrated in Figure 7 and iterate the Jacobian calculation once more while applying small changes in methane amount, CH4, until the spectral difference converges (i.e., is less than noise). This retrieval algorithm is shown in Figure 7. The calculation from KLAYERS through kCARTA and are done, and we manually adjust the reflectivity factor and iterations of Jacobian calculations to calculate total column CH4. As is illustrated in the retrieval algorithm figure, there are components of the retrieval algorithm that are currently done manually (green boxes in Figure 7). We propose in future efforts to automate these to enable an algorithm for ASPECT retrieval that does not include a ‘man in the loop.’ We have done retrievals on both the data over the sunglint with and without the methane cell.
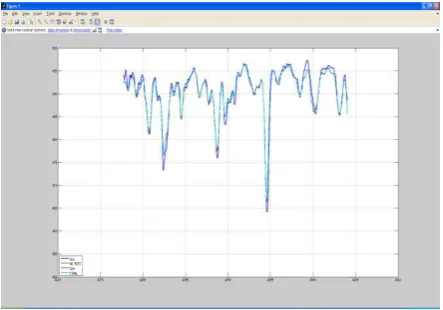
Data and calculations are shown in Figure 8. The final results of running the ASPECT Retrieval Algorithm (Figure 7) upon the sunglint collections retrieved the amount 0.903 atm-cm of CH4 in the gas cell. The gas cell was known to contain 0.908 atm-cm of CH4 to 1% accuracy.
Figure 8. This graph shows a methane retrieval spectra collected over the sunglint. The dark blue line is the observation, green is with no perturbation, red is the methane amount perturbed, aqua is the reflectivity factor and purple is the final calculation with reflectivity applied.
3. CONCLUSIONS
The analysis demonstrated retrieval of a gas cell simulated enhancement in the total atmospheric CH4 column of 0.908 atm – cm with 1% accuracy. This is an equivalent sensitivity to an enhancement of 200 ppm in the first meter of the atmosphere. In a parallel effort Kumer et al., 2011, have calibrated and used the data from consecutive frames with the absorption cell NOT in the beam and showed retrieval of total atmospheric column to 1% precision. There is potential to considerably improve the precision. For example, for the use of all spectra (in this study only two out of the 512 taken along a given slit of a TIMS collection) the precision is theoretically expected to improve to the order of an 18 ppm enhancement in the first meter of the atmosphere sensitivity. This research constitutes an important step in demonstrating sounding CH4 enhancements over water by the use of high-resolution spectral measurement of sun glint.
REFERENCES
Desouza-Machado, S., Strow, L., Hannon, S., Dec. 1997. kCompressed Atmospheric Radiative Transfer Algorithm (kCARTA). Proceedings SPIE, 3220, Satellite Remote Sensing of Clouds and Atmosphere II, Joanna D. Haigh; Ed., pp. 156-162.
Kumer, J.B., Roche, A.E., Rairden, R.L., Mergenthaler, J.L., Doolittle, J.H., Blatherwick, R.D., Hawat, T., Chatfield, R.B., July 2008. Tropospheric Infrared Mapping Spectrometers (TIMS) to Provide Measurements with much Improved Vertical, Temporal, and Spatial Resolution in the Lower Troposphere. Geoscience and Remote Sensing Symposium, 2008. IEEE International. III-522 – III-525.
Kumer, J.B., Rairden, R., Roche, A., Chatfield, R., 2011. NASA ESTO IIP Tropospheric Infrared Mapping Spectrometers (TIMS) Demonstration First Deployment on an Airship: Preliminary Results. Hyperspectral Imaging and Sounding of the Environment, Optical Society of America Technical Digest (CD) (Optical Society of America), paper HTuD2.
Larsen, N. and K. Stamnes, Feb. 2006. Methane Detection from Space: Use of Sunglint. Optical Engineering. 45, 016202.1-016202.8.
ACKNOWLEDGEMENTS
We thank Dr. Sergio DeSouza-Machado of the Physics Department of the University of Maryland Baltimore County for his development of Kcarta (kCompressed Atmospheric Radiative Transfer Algorithm), and his patience and assistance using this code.