REMOTE-SENSING-BASED BIOPHYSICAL MODELS FOR ESTIMATING LAI
OF IRRIGATED CROPS IN MURRY DARLING BASIN
Indira Wittamperuma1, Mohsin Hafeez1, 2, Mojtaba Pakparvar3and John Louis4
1School of Environmental Sciences, Charles Sturt University, Wagga Wagga NSW 2678, Australia.
Email: [email protected]
2
GHD Pty Ltd, 201 Charlotte Street, Brisbane QLD, 4000
3
Faculty of Bioscience Engineering Gent University, 673 Cupour Links, Gent 9000, Belgium
4
School of Computing and Mathematics, Charles Sturt University, Wagga Wagga NSW 2678, Australia.
KEY WORDS: GIS, LAI, LANDSAT TM, NDVI, Remote Sensing,
ABSTRACT:
Remote sensing is a rapid and reliable method for estimating crop growth data from individual plant to crops in irrigated agriculture ecosystem. The LAI is one of the important biophysical parameter for determining vegetation health, biomass, photosynthesis and evapotranspiration (ET) for the modelling of crop yield and water productivity. Ground measurement of this parameter is tedious and time-consuming due to heterogeneity across the landscape over time and space. This study deals with the development of remote-sensing based empirical relationships for the estimation of ground-based LAI (LAIG) using NDVI, modelled with and without atmospheric correction models for three irrigated crops (corn, wheat and rice) grown in irrigated farms within Coleambally Irrigation Area (CIA) which is located in southern Murray Darling basin, NSW in Australia. Extensive ground truthing campaigns were carried out to measure crop growth and to collect field samples of LAI using LAI- 2000 Plant Canopy Analyser and reflectance using CROPSCAN Multi Spectral Radiometer at several farms within the CIA. A Set of 12 cloud free Landsat 5 TM satellite images for the period of 2010-11 were downloaded and regression analysis was carried out to analyse the co-relationships between satellite and ground measured reflectance and to check the reliability of data sets for the crops. Among all the developed regression relationships between LAI and NDVI, the atmospheric correction process has significantly improved the relationship between LAI and NDVI for Landsat 5 TM images. The regression analysis also shows strong correlations for corn and wheat but weak correlations for rice which is currently being investigated.
1. INTRODUCTION
LAI is a dimensionless vegetation biophysical parameter which defines the status of the vegetation growth and it is a key input parameter in crop growth and yield models (Doraiswamy et al., 2005), plant photosynthesis (Duchemin et al., 2006), evapotranspiration (ET) and carbon flux (Chen et al., 2007). Therefore, direct or indirect estimation of LAI measurements are key input in many ecosystem models.
The direct method of LAI calculation involves steps including leaf collection, area determination and measurement of dry weight of leaves to derive the ratios of leaf area and mass per unit ground area (Zheng et al., 2009). In many agricultural and forestry applications, LAI was directly estimated to assess crop growth and health of vegetation around the globe. Sarlikioti et al., (2011) measured LAI destructively to explore a way for the online estimation of LAI and PAR interception in two greenhouse grown crops (tomato and sweet paper). Casanova et al., (1998) monitored the rice crop status during the growing season using LAI at Ebro Delta in Spain. These researchers estimated LAI directly by measuring the leaf blade of the rice crop with a LI-300 Area Meter. Even though the direct measurements of LAI provide more accurate estimation, it is time consuming and work intensive to use over large agricultural areas which are rapidly changing over the time.
In the indirect method, LAI is estimated in terms of canopy gap fraction or gap size distribution. The hand held optical instruments such as plant canopy analysers (LI-COR LAI-2000) are usually used to measure canopy gap fraction. Liu et al., (2010) has used indirect measurements of LAI-2000 plant canopy analyzer to compare the LAI estimates derived from vertical gap fraction measurements obtained from digital colour photography over the top of canopy of corn, soybean and wheat canopies in Eastern Canada. The performance of indirect methods using hand held instruments can only provide reasonable estimates if the basic assumptions such as data is collected at dawn or dusk conditions are strictly followed (Wilhelm et al., 2000) and this method is not practical to collect LAI data over large vegetation areas.
Some studies have been carried out to estimate LAI in terms of vegetation indices derived from spectral measurements either using hand held instruments by physically being in the field or from remote sensing images. Colombo et al., (2003) derived LAI in terms of different vegetation indices for five different vegetation types: soybean, corn, vineyards, poplar plantation and deciduous forest in Colombano region, Italy. They used spectral data from an IKONOS panchromatic-multispectral image to derive different spectral vegetation indices. Haboudane et al., (2004) also developed the predictive equations in the same way to predict LAI for three crop types: corn, beans, and peasin Canada but they used ground measured reflectance data to derive vegetation indices. The simple and common approach to derive LAI from remote sensing is to develop empirical equations between LAI and vegetation indices (Yi et al., 2008) as remote sensing measurements are more reliable due to its spatial and temporal distribution. NDVI is one of the vegetation indices which is simple and frequently used to estimate LAI (Qi et al., 2000). Moreover, it is required to establish individual empirical equations for each vegetation type as the empirical coefficients of equations vary with the vegetation type (Colombo et al., 2003)
This paper deals with the development of empirical relationships between ground based LAI (LAIG) and NDVI measured from satellite images for three common
irrigated crops (corn, wheat and rice) grown in the Murray Darling Basin (MDB).
2. METHODOLOGY
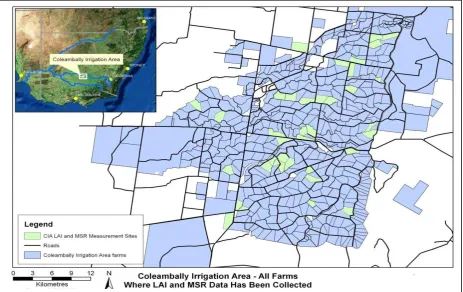
The study was carried out in the Coleambally Irrigation Area (CIA) located in southern MDB in Australia (Figure 1). The Murray Darling Basin is the Australia’s most important agricultural region, and contains 65% of total amount of Australian irrigated areas (ANCID, 2005) Principal summer crops grown include rice, soybeans, maize (corn) and grapes (November – April), while principal winter crops include wheat, oats, barley and canola (May – October). The CIA covers approximately 79,000 ha of intensive irrigation. Surface water is diverted to the area from the Murrumbidgee River at Gogeldrie Weir. The average annual precipitation and evapotranspiration is about 396 mm and 1677 mm respectively.
LAI on ground measurements, spectral data for NDVI and other corresponding crop-growth measurements were collected in the site during the summer and winter seasons of 2010-11. Every seven to ten days during the cropping seasons, field visits were planned to coincide with the important phenological development stages of the crops, satellite overpass day and favourable weather conditions in order to guarantee cloud-free satellite images on important growth stages of crops (Table 1).
Table 1: Landsat 5 TM image acquisition dates and ground measurement dates of wheat corn and rice crops in CIA
2.1 Reflectance measurements
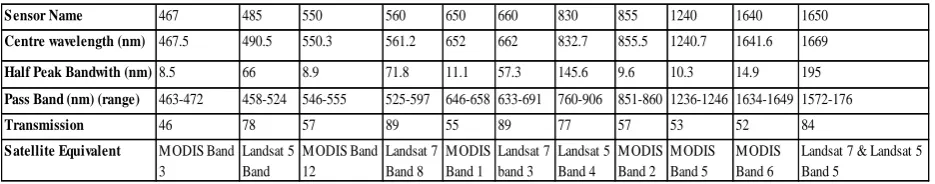
Table 2: Filters fitted to the CROPSCAN MSR
Reflectance is measured using a hand-held Multi-Spectral Radiometer (MSR) (CROPSCAN, 1995). This instrument is fitted with 11 filters. The filter bandwidths are similar to selected MODIS and Landsat 5 TM and Landsat 7 ETM+ bands (Table 2). Field surveys were conducted to capture spectral signatures for three irrigated crops in the study area. These surveys were planned to acquire crop reflectance data using MSR and collected data was checked and cleaned for bad readings
In row crops, satellite values will include crop and soil reflectance. In this study, for row crops such as corn, three scans per GPS point were made and taken the average values. The three scans were taken, one scan directly above the plant, another one half plant half inter-row space and the third directly above the inter-inter-row space. This way sampling bias is removed and a more accurate representation of the reflectance was gathered.
MSR measurements were taken along two parallel transects (>30m apart), at 50 sample GPS points in the corn field with a 30m interval between consecutive sample points. Similarly, reflectance was measured in wheat farms with 15 sample points along a single transect. A 30m gap distance was maintained in both farms, to avoid mixed vegetation class effect on spectral data of the Landsat 5 TM satellite images (30m spatial resolution). The coordinates of all the sample points were collected using a hand held GPS in GIS file format during the field work.
Ground based NDVI (NDVIG) was calculated from the combination of red (band 6, central wave length 662 nm) and near infra-red (band7, central wave length 832.7 nm) reflectance values of MSR using equation 1.
(1)
2.2 LAI measurements
LAI-2000 Plant Canopy Analyser was used to collect LAI measurements in different paddocks of three crops in the CIA. LAI-2000 measures the diffuse sun light at five zenith angle ranges with midpoints of 7°, 23°, 38°, 53° and 67° simultaneously. By taking measurements at above and below the canopy of vegetation, the the corresponding corn, rice and wheat farms .In addition crop heights were also taken at same sample points on corresponding dates. The programme FV 2000 was used to download the collected LAI-2000 data files and to analyse them. The programme was further used to recompute the downloaded data by eliminating bad readings, changing rings and canopy models.
Image Date Ground
2010/09/06 2010/09/08 2010/11/02 2010/11/02 2010/12/27 2010/12/21 2010/09/22 2010/09/27 2010/11/18 2010/11/18 2011/01/05 2011/01/10
2010/10/24 2010/10/22 2010/12/04 2010/12/04 2011/01/28 2011/01/20 2010/11/02 2010/11/05 2010/12/27 2010/12/27 2011/02/06 2011/02/09 2010/11/18 2010/11/18 2011/01/05 2011/01/05 2011/03/01 2011/02/28 2010/12/04 2010/12/06 2011/01/28 2011/01/28 2011/03/26 2011/03/17 2011/02/06 2011/02/06 2011/04/02 2011/04/04
2011/03/01 2011/03/01
Wheat Corn Rice
S ensor Name 467 485 550 560 650 660 830 855 1240 1640 1650
Centre wavelength (nm) 467.5 490.5 550.3 561.2 652 662 832.7 855.5 1240.7 1641.6 1669
Half Peak Bandwith (nm) 8.5 66 8.9 71.8 11.1 57.3 145.6 9.6 10.3 14.9 195
Pass Band (nm) (range) 463-472 458-524 546-555 525-597 646-658 633-691 760-906 851-860 1236-1246 1634-1649 1572-176
Transmission 46 78 57 89 55 89 77 57 53 52 84
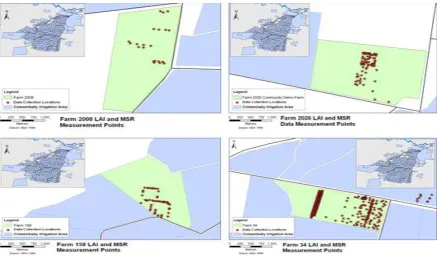
Figure 2: Spectral and LAI data collection sites at various CIA locations
2.3 Satellite measurements
Landsat 5TM satellite images for the whole cropping period were downloaded and processed to extract NDVI data. Firstly the images were pre-processed and reflectance data (relative at sensor reflectance -Toar) was further processed and transformed into absolute ground/surface reflectance (Surf) using two atmospheric correction models: Mid Latitude Summer (MLS) and United States (US) standards in Grass 7.0 environment. Both the models can be used under Australian conditions where both models gave almost identical results. Using all forms of reflectance measurements, different NDVI maps were created for each crop. The first one was created using the reflectance which was not corrected for the atmospheric error (NDVIToar), the second by using the reflectance values which was corrected for atmospheric errors using MLS model (NDVIMLS), and the third one was created in the same way but using the US model (NDVIUS).These maps were used to extract corresponding NDVI values at field sample points.
The LAIG, NDVIG, NDVIToar and NDVISurf values were used appropriately to develop different regression models and analysed the reliability of data sets and presented in following figures (3 to 10). Due consideration was given to phenological growth of crops in selecting the trend lines between different data sets regardless of best fit trend line. The shape of fitted lines is in the harmony with the crop growth phenology and shows that the NDVI saturates when crops are close to harvesting stage giving a good correlation.
3. RESULTS AND DISCUSSION
Error! Reference source not found.Figure 3 shows the regression relationships between LAIG and NDVIToar for corn. The corresponding regression relationship between LAIG and NDVIMLS and LAIG and NDVIUS is shown in Figure 4 and 5. It is clear that the atmospheric correction process has significantly improved the results of the relationship between LAI and NDVI for Landsat 5 TM.
Figure 3: Relationship of LAIG and NDVITOAR for corn crop Figure 4: Relationship of LAIG and NDVIMLS for corn crop
y = 0.1653ln(x) + 0.5475
R² = 0.8309
0.00 0.10 0.20 0.30 0.40 0.50 0.60 0.70 0.80 0.90 1.00
0 1 2 3 4 5 6
N
D
V
I To
a
r
LAI
Gy = 0.1547ln(x) + 0.6621
R² = 0.8892
0.00 0.10 0.20 0.30 0.40 0.50 0.60 0.70 0.80 0.90 1.00
0 1 2 3 4 5 6
N
D
V
IM
L
S
For comparison, Figure 6 shows the regression model between the grounds measured NDVI (NDVIG) and the ground measured values for LAI (LAIG) for the corn crop in the CIA. It is interesting to note that this regression relationship is not as good as either the MLS derived NDVI or US derived NDVI or NDVI derived from raw uncorrected reflectance at the top of the atmosphere. Analysis shows strong correlations and the coefficient of
determination (R2) for corn for four different correlations (LAIG - NDVIG , LAIG – NDVIToar , LAIG – NDVIMLS and LAIG – NDVIUS) were found to be 0.81, 0.83 , 0.89 and 0.88, respectively.
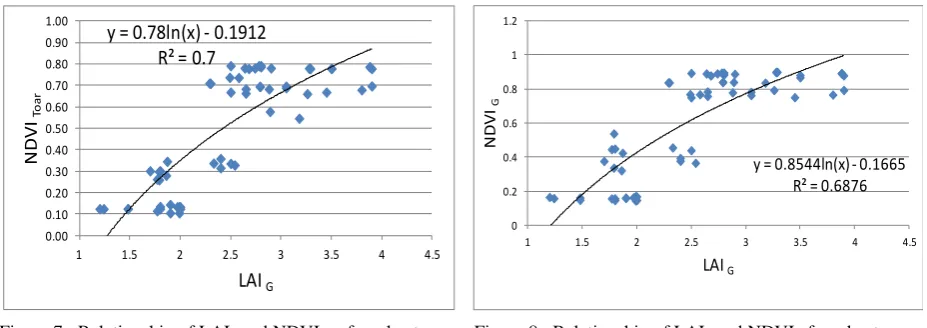
In a similar way, these relationships were developed for wheat crop and results are shown in Figures 7, 8, 9 and 10.
Analysis shows strong correlations for these two crops. The coefficient of determination (R2) for wheat for four different correlations (LAIG – NDVIToar, LAIG - NDVIG, LAIG – NDVIMLS and LAIG – NDVIUS) were found to be 0.70, 0.69, 0.72 and 0.71, respectively. In contrast, R2 for rice for these relationships were poor and were found to be 0.02, 0.08, 0.2 and 0.1, respectively.
4. CONCLUSION
The models for estimation of LAIG from freely available Landsat 5 TM were developed for the conditions in Australia. The resolution of satellite images are reasonably good to correlate point data measured at sample points in different farms. Developed models can be applied with any satellite images which are having thermal bands (e.g. NOAA–AVHRR, ASTER, MODIS)
All models developed for corn and wheat have very promising co-relations for the derivation of LAIG. These strong correlations allow for the potential use of developed models to estimate ground based LAI and they can be used to address various agricultural landscape issues within irrigated agriculture of Murray Darling Basin in Australia. However the corresponding relationships for rice are weak, most probably this is due to the mixed spectral reflectance of plant-water-soil, as rice crop is grown in flooded fields throughout the cropping season. The possible reasons for weak relationships for the rice crop are currently being investigated using various modelling techniques and field investigations which will be reported separately in the future research.
Among all models, the atmospherically corrected relationships are higher in accuracy. Moreover, the correction based MLS model showed the highest coefficient of determination. However, any model could be used based on the availability of data and requirement.
REFERENCES
ANCID. 2005. Australian irrigation water provider. Benchmarking Report for 2003/2004 based ecosystem-atmosphere simulation scheme (EASS)--Model formulation and test with multiple-year data. Ecological Modelling 209(2-4): 277-300.
Colombo, R., Bellingeri, D., Fasolini, D., Marino, C. M. 2003. Retrieval of leaf area index in different vegetation types using high resolution satellite data. Remote Sensing of Environment 86(1): 120-131.
CROPSCAN, 1995. Multispectral Radiometer (MSR): User's manual and technical reference. CROPSCAN, Rochester
Doraiswamy, P.C., Sinclair, T.R., Hollinger, S., Akhmedov, B., Stern, A., Prueger, J., 2005. Application of MODIS derived parameters for regional crop yield assessment. Remote Sensing of Environment 97, 192–202.
Duchemin, B.; Hadriab, R.; Errakib, S.; Bouleta, G.; Maisongrandea, P.; Chehbounia, A.; Escadafala, R.; Ezzaharb, J.; Hoedjesa, J.C.B.; Kharroud, M.H.; Khabbab, S.; Mougenota, B.; Oliosoe, A.; Rodriguezf, J.C.; Simonneauxa, V. 2006. Monitoring wheat phenology and irrigation in Central Morocco: On the use of relationships between evapotranspiration, crops coefficients, leaf area index and remotely-sensed vegetation indices. Agric. Water Manage. 79, 1-27.
Haboudane, D., Miller, J. R., Tremblay, N., Pattey, E., Vigneault, P. 2004. Estimation of leaf area
index using ground spectral measurements over agricultural crops: Prediction capability assessment of optical indices. XXth ISPRS Congress:"Geo-Imagery Bridging Continents". Istanbul, Turkey 12-23 July 2004. Commission VII, WG VII/1.
Huete, A. R. 1988. "A soil-adjusted vegetation index (SAVI)." Remote Sensing of Environment 25(3): 295-309.
Liu, J., Pattey, E. 2010. Retrieval of leaf area index from top-of-canopy digital photography over agricultural crops. Agricultural and Forest Meteorology 150(11): 1485-1490.
Qi, J., Kerr, Y. H., Moran, M. S., Weltz, M., Huete, A. R., Sorooshian, S., Bryant, R. 2000. Leaf area index estimates using remotely sensed data and BRDF models in a semiarid region. Remote Sens. Environ., 73, 18– 30.
Sarlikioti, V., Meinen., E ., Marcelis, L. F. M. 2011 Crop Reflectance as a tool for the online monitoring of LAI and PAR interception in two different greenhouse Crops. Biosystems Engineering 108(2): 114-120.
Stroppiana, D ., Boschetti, M. Confalonieri, R., Bocchi, S., Brivio, P.A. 2006. Evaluation of LAI-2000 for leaf area index monitoring in paddy rice. Field Crops Res. 99:167–170.
Wilhelm, W.W., Ruwe, K., Schlemmer, M.R., 2000. Comparison of three leaf area index meters in a corn canopy. Crop Sci. 40, 1179–1183. Yi, Y., Yang, D.,Huang, J.,Chen, D. 2008. Evaluation of
MODIS surface reflectance products for wheat leaf area index (LAI) retrieval. ISPRS Journal of Photogrammetry and Remote Sensing 63(6): 661-677.