Google Maps API, V2
Adding
Where
To Your Applications
Scott Davis
The Pragmatic Bookshelf
Many of the designations used by manufacturers and sellers to distin-guish their products are claimed as trademarks. Where those designations appear in this book, and The Pragmatic Programmers, LLC was aware of a trademark claim, the designations have been printed in initial capital letters or in all capitals. The Pragmatic Starter Kit, The Pragmatic Pro-grammer, Pragmatic Programming, Pragmatic Bookshelf and the linkingg
device are trademarks of The Pragmatic Programmers, LLC. Useful Friday Links
• Source codefrom this book and other resources.
• Free updates to this PDF
• Errata and suggestions.To report an erratum on a page, click the
link in the footer. Every precaution was taken in the preparation of this book. However, the publisher assumes no responsibility for errors or omissions, or for damages that may result from the use of information (including program listings) contained herein.
To see what we’re up to, please visit us at
http://www.pragmaticprogrammer.com
Copyright © 2006 The Pragmatic Programmers LLC. All rights reserved.
This PDF publication is intended for the personal use of the individual whose name appears at the bottom of each page. This publication may not be disseminated to others by any means without the prior consent of the publisher. In particular, the publication must not be made available on the Internet (via a web server, file sharing network, or any other means). Produced in the United States of America.
Bo o ks he lf Pr a
g
Contents
1 Google Maps 1
1.1 A Brief History . . . 2
1.2 Here’s the Game Plan . . . 3
2 For Those in a Hurry... 5
2.1 The Simple Map . . . 5
2.2 Adding navigation components . . . 7
2.3 Setting the initial map type . . . 8
2.4 Creating a Point and an Info Window . . . 10
3 The Excruciating Details 12 3.1 Core Objects . . . 12
3.2 Map Controls . . . 12
3.3 User Data . . . 13
3.4 Events . . . 13
3.5 AJAX . . . 13
4 Core Objects 14 4.1 GMap2 . . . 14
4.2 GLatLng . . . 15
4.3 GLatLngBounds . . . 16
5 Map Control Objects 20 5.1 Panning . . . 20
5.2 Zooming . . . 20
5.3 Changing the Map Type . . . 22
5.4 GOverviewMap . . . 23
rida
y
s
CONTENTS CONTENTS iv
6 User Data Objects 25
6.1 GMarker . . . 25
6.2 GIcon. . . 26
6.3 Info Windows . . . 31
6.4 GPolyline . . . 35
7 Events 39 7.1 GEvent . . . 39
7.2 GBrowserIsCompatible . . . 42
7.3 GMap Events . . . 42
7.4 Event Handlers . . . 44
7.5 GMarker Events . . . 45
7.6 Simple Examples . . . 46
7.7 A Real-World Example . . . 48
8 AJAX 59 8.1 DHTML and AJAX . . . 59
8.2 GXmlHttp . . . 60
8.3 Geocoder Web Services . . . 61
8.4 Revisiting the Real-World Example . . . 64
9 Where do we go from here? 69
Chapter 1
Google Maps
The Google Maps API, version 2 (http://www.google.com/apis/maps/) is a great way to dip your toe into the world of web mapping. You don’t have to worry about finding and managing your own data, installing and configuring your own server, or creating your own cross-browser AJAX mapping framework from scratch. It’s a pro-grammer’s dream—with a little bit of JavaScript and a few lati-tude/longitude points, you are off to the races.
It is, however, aimed squarely at programmers. You will be neck-deep in JavaScript from the get-go. If all you want is a simple map without having to program it yourself, there is an easier way: Yahoo! Maps (http://developer.yahoo.net/maps/) provides a simple service that allows you to pass in an XML list of points and get a fully rendered map out on the other side. You can give it either lat/long points or plain old street addresses. Yahoo! handles everything for you—creating the points on the map, handling pop-up “bubbles” over your data points, the whole nine yards. You can pass in custom icons, html links, and descriptive text for each item in the XML. You get quite a bit of flexibility for a canned application.
The Google Maps API gives you the same functionality as Yahoo! Maps—pop-up bubbles (called Info Windows in Google-speak), cus-tom icons, and so on—but you have to be much more deeply involved in the implementation. After all, Google Maps is an API, not a finished application. You get all of the pieces, but there is “some assembly required.”
rida
y
s
CHAPTER 1. GOOGLE MAPS A BRIEF HISTORY 2
react to every click on the map, every drag, every zoom. You have fine-grained control of your custom icons—the image, the shadow, even specifying the tie-points to the map and the Info Window. You have access to terabytes of high-resolution satellite imagery. But the most important thing is that you have a map component that can be seamlessly embedded in your own webpage.
1.1
A Brief History
Ahh, living at the speed of the Internet – ain’t it grand?
Google Maps was released in beta on February 7, 2005. The drag-gable map interface created a sensation. It was a “Wizard of Oz / Technicolor” moment for most web users. Who knew that a web application could be that smooth and responsive? For that matter, who knew that you could even do such a thing in a web browser?
On February 18, 2005, Jesse James Garrett of Adaptive Path pub-lished a seminal article that gave a name to this new style of web development: Ajax: A New Approach to Web Applications. Suddenly, Google Maps wasn’t simply a revolutionary mapping application; it became the poster-child for all web applications. Tim O’Reilly (founder of O’Reilly Media, Inc.) coined another phrase, “Web 2.0”, that helped further define the difference between how web applica-tions used to behave versus the new “Google Maps” way.
On June 29, 2005, Google released version 1 of their Mapping API. This allowed us to move from being simply consumers of the maps to actual producers. (Presumably, it’s the reason you’re reading this book right now.)
On April 3, 2006, Google released version 2 of the Mapping API.
CHAPTER 1. GOOGLE MAPS HERE’S THE GAMEPLAN 3
While this new version brought many exciting new features to the table (increased zoom levels, additional map controls, and the ability to overlay your own imagery on the map), it also broke compatibil-ity with the previous version. As you read articles on the web or browse code examples, be wary of the date of publication. If you don’t specifically see “v2” featured prominently, chances are good that the code simply won’t work as advertised. This book has been upgraded to allow you to take full advantage of the latest release, version 2.
Now that you know the history of the API, let’s dive right in with some code examples.
1.2
Here’s the Game Plan
We’ll start with a quick walk-through to satisfy the Attention-Deficit Disorder crowd. Then we’ll swing back around cover each compo-nent in excruciating detail.
I encourage you toplay with the maps, live, as you read along. Dizzy
http:// www.mapmap.org/ googlemaps/ examples.html
Gillespie once said that “reading about music is like dancing about architecture”—it loses something in the translation. Google Maps practically beg to be played around with. You can also download
the codeand run the examples on your own server.
http:// www.mapmap.org/ googlemaps/ downloads.html
rida
y
s
CHAPTER 1. GOOGLE MAPS HERE’S THE GAMEPLAN 4
friendly alert box from Google reminding you to apply for your own key.
Before we get too far, we should cover the lawyerly stuff. Google provides the Google Maps API for free, and in return they require that your resulting application is free as well. You can use it for commercial purposes, but you cannot charge your users to view the map. You can password protect access to it only if passwords are free and issued to anyone who asks for one. For more information, see http://www.google.com/apis/maps/faq.html.
Chapter 2
For Those in a Hurry...
Sometimes the quickest way to learn a new API is to see some code in action. In later chapters we’ll talk about what this code is actually doing in greater detail. For now, let’s just dive in.
2.1
The Simple Map
Let’s take a look at the simplest possible Google Map application.
File 1
<!DOCTYPE html PUBLIC "-//W3C//DTD XHTML 1.0 Strict//EN"
"http://www.w3.org/TR/xhtml1/DTD/xhtml1-strict.dtd">
<html xmlns="http://www.w3.org/1999/xhtml">
<head>
<script src="http://maps.google.com/maps?file=api&v=2&key=xyz"
type="text/javascript"></script>
</head>
<body>
<div id="map" style="width: 500px; height: 400px"></div>
<script type="text/javascript">
var map = new GMap2(document.getElementById("map"));
//zoom levels 0-17+, 0 == world
map.setCenter(new GLatLng(39.754286, -104.994637), 16);
</script>
</body>
</html>
Let’s examine the interesting parts of the code:
• The <script> tag imports the Google Maps library. This is where you place your key.
rida
y
s
CHAPTER 2. FOR THOSE IN A HURRY... THE SIMPLE MAP 6
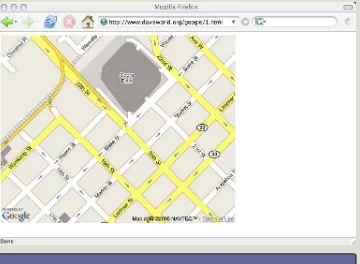
Figure 2.1: The simplest possible Google Maps application.
anything you’d like—we named it “map” (clever, eh?). In the CSS styling, we defined the size of the map in pixels.
• new GMap2() creates the map. In the constructor of the GMap2 object, we pass in the <div> using DOM.
• map.setCenter(), as the name implies, centers the map on a particular latitude/longitude point. It also zooms into the level specified. Google uses a 17 point scale; zoom level 0 will show you the entire world, zoom level 17 is zoomed into the street level.
See Figure2.1 for the resulting map.
CHAPTER 2. FOR THOSE IN A HURRY... ADDING NAVIGATION COMPONENTS 7
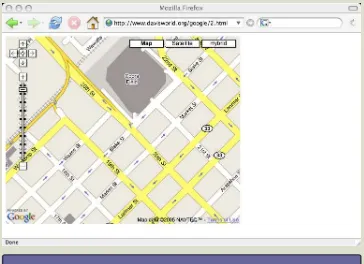
Figure 2.2: Adding map controls to your map.
2.2
Adding navigation components
Now let’s add some simple components to the map that will allow us to zoom and change the map type, as shown in Figure2.2 .
File 2
<!DOCTYPE html PUBLIC "-//W3C//DTD XHTML 1.0 Strict//EN"
"http://www.w3.org/TR/xhtml1/DTD/xhtml1-strict.dtd">
<html xmlns="http://www.w3.org/1999/xhtml">
<head>
<script src="http://maps.google.com/maps?file=api&v=2&key=xyz"
type="text/javascript"></script>
</head>
<body>
<div id="map" style="width: 500px; height: 400px"></div>
rida
y
s
CHAPTER 2. FOR THOSE IN A HURRY... SETTING THE INITIAL MAP TYPE 8
var map = new GMap2(document.getElementById("map"));
map.setCenter(new GLatLng(39.754286, -104.994637), 16);
map.addControl(new GLargeMapControl());
map.addControl(new GMapTypeControl());
</script>
</body>
</html>
Let’s examine the interesting parts of the code:
• The GLargeMapControl allows the user change the zoom level of the map.
• The GMapTypeControl allows the user to flip between the Map, Satellite, and Hybrid views.
2.3
Setting the initial map type
In addition to letting the user change map types, you can set the initial type programmatically.
File 3
<!DOCTYPE html PUBLIC "-//W3C//DTD XHTML 1.0 Strict//EN"
"http://www.w3.org/TR/xhtml1/DTD/xhtml1-strict.dtd">
<html xmlns="http://www.w3.org/1999/xhtml">
<head>
<script src="http://maps.google.com/maps?file=api&v=2&key=xyz"
type="text/javascript"></script>
</head>
<body>
<div id="map" style="width: 500px; height: 400px"></div>
<script type="text/javascript">
var map = new GMap2(document.getElementById("map"));
map.setCenter(new GLatLng(39.754286, -104.994637), 16);
map.addControl(new GLargeMapControl());
map.addControl(new GMapTypeControl());
CHAPTER 2. FOR THOSE IN A HURRY... SETTING THE INITIAL MAP TYPE 9
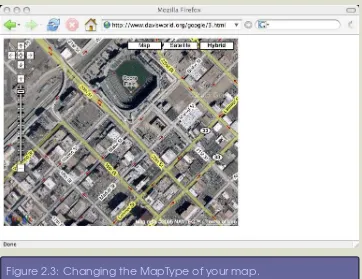
Figure 2.3: Changing the MapType of your map.
// map.setMapType(G_NORMAL_MAP);
// map.setMapType(G_SATELLITE_MAP);
map.setMapType(G_HYBRID_MAP);
</script>
</body>
</html>
Let’s examine the interesting parts of the code:
• map.setMapType() sets the default view of the map: one of G_NORMAL_MAP, G_SATELLITE_MAP, or G_HYBRID_MAP.
rida
y
s
CHAPTER 2. FOR THOSE IN A HURRY... CREATING APOINT AND ANINFOWINDOW 10
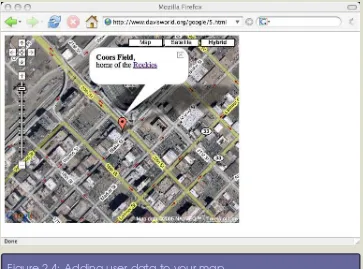
Figure 2.4: Adding user data to your map.
2.4
Creating a Point and an Info Window
In this final example, we’ll create a point on the map and display an Info Window (see Figure2.4 ).
File 4
<!DOCTYPE html PUBLIC "-//W3C//DTD XHTML 1.0 Strict//EN"
"http://www.w3.org/TR/xhtml1/DTD/xhtml1-strict.dtd">
<html xmlns="http://www.w3.org/1999/xhtml">
<head>
<script src="http://maps.google.com/maps?file=api&v=2&key=xyz"
type="text/javascript"></script>
</head>
<body>
<div id="map" style="width: 500px; height: 400px"></div>
<script type="text/javascript">
CHAPTER 2. FOR THOSE IN A HURRY... CREATING APOINT AND ANINFOWINDOW 11
var map = new GMap2(document.getElementById("map"));
var coorsFieldPoint = new GLatLng(39.754286, -104.994637);
map.setCenter(coorsFieldPoint, 16);
map.addControl(new GLargeMapControl());
map.addControl(new GMapTypeControl());
map.setMapType(G_HYBRID_MAP);
//create marker, add to map overlay
var coorsFieldMarker = new GMarker(coorsFieldPoint);
map.addOverlay(coorsFieldMarker);
//create Info Window (html)
var coorsFieldHtml = '<b>Coors Field</b>,<br /> home of the ' +
'<a href="http://www.coloradorockies.com">Rockies</a>'; coorsFieldMarker.openInfoWindowHtml(coorsFieldHtml);
</script>
</body>
</html>
Let’s examine the interesting parts of the code:
• We could have passed an anonymous point as the first param-eter to map.setCenter(). Instead we created a GLatLng called
coorsFieldPointthat can be reused later in the code.
• new GMarker()creates a “pushpin” for coorsFieldPoint.
• map.addOverlay()adds theGMarker to the map.
rida
y
s
Chapter 3
The Excruciating Details
Now that you have a better idea of what can be done with the Google Maps API, let’s go back and look at things in greater details. We have only scratched the surface up to this point.
The Google Maps API is made up of 20 basic objects. The objects fall into five categories: Core, Map Controls, User Data, Events, and AJAX.
3.1
Core Objects
The core objects are the basic building blocks of a map.
• GMap2
• GLatLng
• GLatLngBounds
3.2
Map Controls
Map Control objects allow the user to manipulate the map.
• GLargeMapControl
• GSmallMapControl
• GSmallZoomControl
• GMapTypeControl
• GScaleControl
• GOverviewMapControl
• GControlPosition
CHAPTER 3. THEEXCRUCIATINGDETAILS USERDATA 13
• GMapType
3.3
User Data
User Data objects allow the developer to add custom data to the map.
• GMarker
• GIcon
• GInfoWindowTab
• GPolyline
3.4
Events
Event objects allow the developer to react to user actions, such as drags and clicks.
• GEvent
3.5
AJAX
AJAX objects allow the developer to make asynchronous calls to web services and update the display without having to refresh the entire page.
• GXmlHttp
• GXml
rida
y
s
Chapter 4
Core Objects
The Core objects are the basic building blocks of your map. While you may not use AJAX or work with GEvents in every application, you’d be hard pressed to avoid using these elements.
4.1
GMap2
A GMap2 object, not surprisingly, is your map. You can have as
GMap2
many GMap2s as you’d like on your page.
The GMap2 constructor has one required argument—container.
When Google upgraded their API from v1 to v2, they claimed that is was “designed to be 99% backwards-compatible with the previous version of the API”. While that’s a nice thought, the reality of the situation is many things
changed.Manythings... (See the 6 page
upgrade documentfor details.)
One of the most significant changes was the move from aGMapobject to aGMap2. Although the originalGMapis preserved in the new API, all of the cool stuff requires you to use aGMap2. And more than a simple name change, Google changed the constructor as well as many of the key methods hanging off of it.
If you see code examples that use theGMap
object, chances are good that they are a bit long in the tooth. Caveat emptor.
This is an HTML div. The id attribute of the div is the unique name of the map. By default, the GMap2 uses the size of the div specified in the style attribute to determine the size of the map.
<div id="map" style="width: 800px; height: 500px"></div>
<script type="text/javascript">
var map = new GMap2(document.getElementById("map"));
</script>
If you’d like more than one map on your page, simply give the divs unique ids. (You can also add a GOverviewMapControl to achieve the same effect as our example here. We’ll look at custom controls in the next chapter.)
<div id="overviewMap" style="width: 200px; height: 125px"></div>
<div id="detailMap" style="width: 800px; height: 500px"></div>
<script type="text/javascript">
var overviewMap = new GMap2(document.getElementById("overviewMap"));
var detailMap = new GMap2(document.getElementById("detailMap"));
CHAPTER 4. COREOBJECTS GLATLNG 15
4.2
GLatLng
The maps we’ve defined up to this point are missing two critical pieces: the center point and the zoom level. Without these two addi-tional pieces of information, the maps cannot be rendered.
A GLatLong object is a single Latitude/Longitude point. A common
GLatLong
point of confusion (no pun intended) is the proper order of the ordi-nates. In mathematics, we’re used to (x,y) ordering. That is a (lon-gitude, latitude) point, geographically speaking. SoGLatLong points are really (y,x) ordered. Later in the book, we talk aboutGPointsthat refer to a specific pixel location on the screen. GPointsuse conven-tional (x,y) ordering. Confused yet? Yeah, me too.
The other order of business we need to take care of is the zoom level of the map. The zoom level is an integer ranging from 0-18, where 18 is zoomed in to the street level. A zoom level of 1 displays the whole world if your map size is set towidth: 550px; height: 525px.
Zoom level 0, interestingly enough, zooms you out to the place where you can see several world maps stitched together at the interna-tional date line. Why on Earth would you want to see several world maps at once? It boils down to the trickiness of displaying a round world on a flat map.
rida
y
s
CHAPTER 4. COREOBJECTS GLATLNGBOUNDS 16
(Neat trick, if you ask me...)
Themap.setCenter( ) method should be used to initialize your GMap. After the map has been rendered for the first time, you can continue to use map.setCenter( ) with both arguments, or adjust the prop-erties independently using map.setCenter( ) with a single GLatLng
and map.setZoom( ) with an integer zoom value. To query the map
for the current state of these properties, use map.getCenter( ) and
map.getZoom( ).
<div id="overviewMap" style="width: 200px; height: 125px"></div>
<div id="detailMap" style="width: 800px; height: 500px"></div>
<script type="text/javascript">
overviewMap = new GMap2(document.getElementById("overviewMap"));
detailMap = new GMap2(document.getElementById("detailMap"));
//NOTE: This is the geographic center of the US
var usCenterPoint = new GLatLng(39.833333, -98.583333);
overviewMap.setCenter(usCenterPoint, 1);
detailMap.setCenter(usCenterPoint, 7);
</script>
4.3
GLatLngBounds
The GLatLngBounds object represents the geographic size of our
GLatLngBounds
map. (“Bounding Box” is a common cartographic term used to describe the size of a map.) It is a two element array of GLatLngs. The first element is the lower-left corner of the map; the second one is the upper-right corner.
The physical size of the map doesn’t change—it is defined by the style attribute of the HTML div. But the geographic bounds of the map are constantly changing. Each time you pan, you are looking
CHAPTER 4. COREOBJECTS GLATLNGBOUNDS 17
at a new bounding box. Even if your center point doesn’t change, when you zoom in or out your bounding box changes. Recall that
map.getCenter( ) returns a GLatLng. A complementary method, named
map.getBounds( ), returns a GLatLngBounds object.
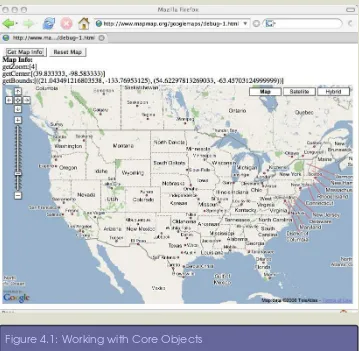
This example brings everything together that we’ve discussed up to this point. (See Figure4.1, on page19for the resulting map, or go to
http://www.mapmap.org/googlemaps/debug-1.html to play with it live.) As you pan and zoom around, click theGet Map Infobutton to see how the values change. You can click the Reset Map button to return it to its initial state.
File 5
<!DOCTYPE html PUBLIC "-//W3C//DTD XHTML 1.0 Strict//EN"
"http://www.w3.org/TR/xhtml1/DTD/xhtml1-strict.dtd">
<html xmlns="http://www.w3.org/1999/xhtml">
<head>
<script src="http://maps.google.com/maps?file=api&v=2&key=xyz"
type="text/javascript"></script>
<script type="text/javascript">
var map = "";
var usCenterPoint = new GLatLng(39.833333, -98.583333);
var worldCenterPoint = new GLatLng(0,0);
var initialCenterPoint = usCenterPoint;
var initialZoomLevel = 4;
var initialMapType = G_NORMAL_MAP;
</script>
</head>
<body onLoad="initMap()">
<input type="button" name="Refresh" value="Get Map Info"
onClick="getMapInfo()" />
<input type="button" name="Reset" value="Reset Map"
onClick="resetMap()" />
rida
y
s
CHAPTER 4. COREOBJECTS GLATLNGBOUNDS 18
<div id="map" style="width: 800px; height: 500px"></div>
<!-- If you set the initialZoomLevel to 1 and the initialCenterPoint to -->
<!-- worldCenterPoint, this map displays the entire world perfectly: -->
<!-- <div id="map" style="width: 550px; height: 525px"></div> -->
<script type="text/javascript">
function initMap()
{
map = new GMap2(document.getElementById("map"));
map.addControl(new GLargeMapControl());
map.addControl(new GMapTypeControl());
resetMap();
}
function getMapInfo()
{
var output = "<b>Map Info:</b><br />";
output = output +
"getZoom:[" + map.getZoom() + "]<br />";
output = output +
"getCenter:[" + map.getCenter() + "]<br />";
output = output +
"getBounds:[" + map.getBounds() + "]<br />";
mapInfo = document.getElementById("mapInfo");
mapInfo.innerHTML = output;
}
function resetMap()
{
map.setCenter(initialCenterPoint, initialZoomLevel);
map.setMapType(initialMapType);
}
</script>
</body>
</html>
CHAPTER 4. COREOBJECTS GLATLNGBOUNDS 19
rida
y
s
Chapter 5
Map Control Objects
Now that we have our basic map (or maps) in place, let’s provide the user a way to interact with it.
5.1
Panning
Every GMap2 that you place on the page has dragging enabled by default. You can usemap.enableDragging()andmap.disableDragging()
to control this programmatically. You can also query for the current dragging state usingmap.draggingEnabled(). This will return true if the map is draggable.
Why would you want to disable arguably the coolest feature of a Google Map? In the Overview/Detail map example, you might want to freeze the overview map in place while allowing the detail map to be moved around freely. Or maybe you are just a control freak. Either way, the choice is yours to decide if your map is draggable or not.
5.2
Zooming
In the quest for simplicity, the developers of Google Maps decided not to make the mouse multi-modal. In other words, dragging with the left mouse button will always pan the map. To give your users the ability to zoom the map, you must add a zoom component to the map.
CHAPTER 5. MAP CONTROLOBJECTS ZOOMING 21
object shows the full 18 levels of zoom on a slider with plus and minus buttons on the top and bottom. (There is a set of pan buttons above the zoom slider.) The slider, in addition to being clickable, provides a nice, simple visual cue as to what your current zoom level is.
If you prefer a more compact widget, the GSmallMapControl object GSmallMapControl
offers the plus/minus zoom buttons without the slider. It also pro-vides a set of pan buttons.
The smallest possible zoom widget is the GSmallZoomControl. This GSmallZoomControl
object only displays the plus/minus buttons—no zoom slider, no pan controls.
To add a zoom control widget to your map, usemap.addControl(new For the really ambitious, you can subclass
GControl and create your own custom map control. For more information and a nice code example, see theGoogle Documentation.
GLargeMapControl()), substitutingGSmallMapControl()or
GSmallZoom-Control() as appropriate. You can add all three at once, but they
overlap each other in both functionality and screen real estate. They appear along upper left side of your map. Bear in mind that the pan controls work even if you have disabled dragging on your map.
The GLargeMapControl widget gives users a visual cue as to how far they are zoomed in. Traditionally, print maps offer the user a similar indicator in the form of a scale that shows inches or cen-timeters in relation to miles or kilometers. The GScaleControl pro-GScaleControl
vides this functionality. While it isn’t an interactive widget like the others we’ve discussed so far, it is added to the map using the same
map.addControl( ).
map.addControl( ) accepts an optionalGControlPosition, allowing you GControlPosition
rida
y
s
CHAPTER 5. MAP CONTROLOBJECTS CHANGING THEMAP TYPE 22
• G_ANCHOR_BOTTOM_LEFT
• G_ANCHOR_BOTTOM_RIGHT
• G_ANCHOR_TOP_LEFT
• G_ANCHOR_TOP_RIGHT
The offset is aGSize, which is an (x,y) pair that creates an invisible GSize
rectangle. In the case of a GSize, x equals the width of the box; y equals the height.
map.addControl(new GLargeMapControl());
map.addControl(new GScaleControl(),
new GControlPosition(G_ANCHOR_BOTTOM_RIGHT,
new GSize(20,20)));
5.3
Changing the Map Type
Another way that users can interact with the map is by changing the map type. The default map type, called Map mode, is a simple line drawing. There are two more map types available: Satellite and Hybrid. Satellite mode shows imagery over the area instead of line drawings. Hybrid mode superimposes the Map mode over the Satellite mode, giving you the best of both worlds.
You can adjust the map type usingmap.setMapType(map_type), where
map_typecan beG_NORMAL_MAP,G_SATELLITE_MAP, orG_HYBRID_MAP.
Or you can display theGMapTypeControl widget in the upper right GMapTypeControl
corner using
map.addControl(new GMapTypeControl())
You can usemap.getCurrentMapType( ) to determine the current map. It returns a GMapType object. To display the name of the current GMapType
map type, usemapType.getName( ).
CHAPTER 5. MAP CONTROLOBJECTS GOVERVIEWMAP 23
alert( map.getCurrentMapType().getName() );
5.4
GOverviewMap
The API offers one last type of built-in control: aGOverviewMap. As GOverviewMap
the name suggests, this provides a tiny overview map of your main map. It is fully interactive – if you drag the OverviewMap, it pans the main map as well. To add one to the screen, usemap.addControl(new GOverviewMap());.
5.5
Putting it all together
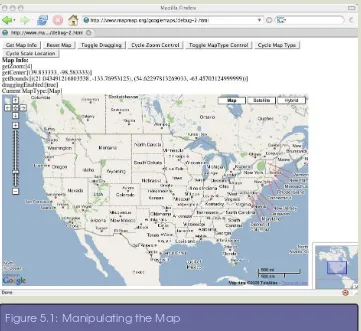
Let’s put everything together in another map. (See Figure5.1, on the next page, for the resulting map, orplay with it online.) The getMap-http:// www.mapmap.org/ googlemaps/ debug-2.html
rida
y
s
CHAPTER 5. MAP CONTROLOBJECTS PUTTING IT ALL TOGETHER 24
Figure 5.1: Manipulating the Map
Chapter 6
User Data Objects
Now that you feel comfortable working with a “stock” map, let’s look at adding your own custom data. The API allows you to add points and lines (GMarkers and GPolylines, respectively). You can also customize the appearance of your GMarker by creating a GIcon.
6.1
GMarker
In the Core Objects section, we introduced the GLatLng. A GLatLng stores a Latitude / Longitude coordinate, but it doesn’t offer you a way to visualize it on a map. AGMarker is the way to add GLatLngs GMarker
to the map for display purposes. The GMarker constructor takes a GLatLng as the only required argument.
Once we have the marker, we need to tell the map to display it;
map.addOverlay(myMarker) should do the trick. (Objects that you
superimpose over the map are calledOverlays.) You can remove the Overlays
marker usingmap.removeOverlay(myMarker). To remove all overlays, usemap.clearOverlays( ).
var myPoint = new GLatLng(38.898748, -77.037684);
var myMarker = new GMarker(myPoint);
map.addOverlay(myMarker);
rida
y
s
CHAPTER 6. USERDATA OBJECTS GICON 26
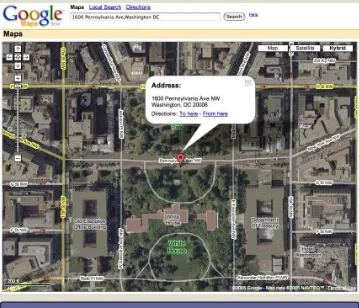
Figure 6.1: The default GIcon with an Info Window
6.2
GIcon
The default icon used for a GMarker gives your map a distinct Google Maps look and feel, as Figure 6.1 shows. You can, how-ever, substitute your own GIcon for a more personalized touch. But before we get into the API details of how to specify a custom GIcon, we should talk about how to get a suitable image to use.
Your icon must be a PNG file. Any size will do, but anything more than 20-30 pixels square will begin to look too big in relation to the
CHAPTER 6. USERDATA OBJECTS GICON 27
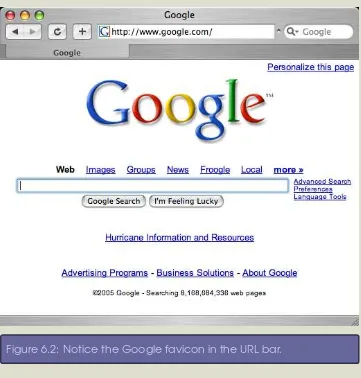
Figure 6.2: Notice the Google favicon in the URL bar.
rest of the map. The default markeris 20x34 pixels.
http:// www.google.com/ mapfiles/ marker.png
I don’t know about you, but I became a programmer due to a marked
lack of artistic skills. The idea of hand-drawing my icons makes me feel positively nauseous. Luckily, there are a wealth of images out there that are just the right size. I’m speaking offavicons, those little favicons
rida
y
s
CHAPTER 6. USERDATA OBJECTS GICON 28
Nearly every commercial website out there has a custom favicon. You can usually download them directly from the root of the website. For example, Google’s blue “G” can be found at in their site’s top-level directory at http://www.google.com/favicon.ico. If you can’t find a site’s favicon in the root, do a View/Source and look for a tag in the header such as<link rel="shortcut icon" href="/favicon.ico"/>.
For more information on favicons, seeWikipedia.
I’m not suggesting that you should download website favicons and use them without asking permission—they are copyrighted mate-rial, after all—but we can use them as an inspiration for what we are trying to accomplish. Favicons are the perfect size for GIcons: by definition they are 16x16. And since they are so prevalent, there are a number of free utilities and websites that make it easy to create them.
The one that I use most often is http://www.html-kit.com/favicon. It allows you to upload an image of any size, in nearly any file for-mat, and download the resulting 16 x 16 favicon in a zip file. The favicon is nice, but we need PNGs for the Google Map API. Luckily, in addition to the favicon.ico file, you get a 16 x 16 PNG preview image in the extra folder of the zip. Voila! Google Maps-ready icons in a can.
In my quest for quick and easy icons, I’ve also gotten quite handy with a command-line graphics program called ImageMagick. No,
http:// www.imagemagick.org
“command-line graphics program” is not an oxymoron. It allows me to do image manipulation from where I feel most comfortable – at the blinking cursor of a black and white terminal window. ImageMagick is open source (so the price is right) and available on all of the major platforms (Mac, Linux, and Windows, among others).
You can use theidentify command to get the exact pixel size of any
CHAPTER 6. USERDATA OBJECTS GICON 29
image (identify foo.gif). You can then use the convert command to change formats and optionally scale the image. If you already have a favicon (and permission to use it), convert favicon.ico mylogo.png
will get it into the proper format. To resize images as you change formats, use the scale parameter (convert -scale 16x16 bigimage.tiff tinyimage.png).
Now that we have a suitable image, let’s incorporate it into our map. First, define a GIcon. Then, the constructor of a GMarker takes an optional GIcon argument after the required GLatLng.
var myIcon = new GIcon();
myIcon.image = "http://www.mapmap.org/googlemaps/google.png";
myIcon.iconSize = new GSize(16,16);
var myMarker = new GMarker(myPoint, myIcon);
map.addOverlay(myMarker);
The GIcon can be further customized in a number of ways. You can use icon.shadow and icon.shadowSize to add, umm, shadows to your icon. The Google Maps graphic designers have an incredibly keen eye for detail when it comes to shadows. Go back and take a look at a Google Map with overlays on it (for example, Figure6.1, on page 26). Can you see the subtle drop shadow to the right of both the marker and the Info Window?
I am generally satisfied with matte custom icons in my maps. (Or
I used the following ImageMagick command to create the shadow image.
convert -shear 45 -charcoal 1 \
-resize 32x16! -background none \
rida
y
s
CHAPTER 6. USERDATA OBJECTS GICON 30
speak, shaking their heads in shame at my pathetic attempt at artis-tic integrity.)
var defaultIcon = new GIcon();
defaultIcon.image = "http://www.google.com/mapfiles/marker.png";
defaultIcon.iconSize = new GSize(20,34);
defaultIcon.shadow = "http://www.google.com/mapfiles/shadow50.png";
defaultIcon.shadowSize = new GSize(37,34);
var myIcon = new GIcon();
myIcon.image = "http://www.mapmap.org/googlemaps/google.png";
myIcon.iconSize = new GSize(16,16);
myIcon.shadow = "http://www.mapmap.org/googlemaps/google_shadow.png";
myIcon.shadowSize = new GSize(32,16);
There is one last thing we need to discuss as far as custom icons are concerned – anchors. When it comes to “X marks the spot”, we need to give the map a hint as to which part of the GIcon should sit over the GLatLng. Theicon.iconAnchorproperty represents the exact pixel of the icon that should match up with the point on the map. The upper left corner of the icon is (0,0). The default GIcon looks like it hits map right about bottom-center, or (10,34).
If we are going to be attaching Info Windows to our GIcons, we also need to specify theicon.infoWindowAnchorproperty. The default GIcon attaches the Info Window at top-center, or (10,0). (Again, see Figure6.1, on page26.)
var defaultIcon = new GIcon();
defaultIcon.image = "http://www.google.com/mapfiles/marker.png";
defaultIcon.iconSize = new GSize(20,34);
defaultIcon.shadow = "http://www.google.com/mapfiles/shadow50.png";
defaultIcon.shadowSize = new GSize(37,34);
defaultIcon.iconAnchor = new GPoint(10,34);
defaultIcon.infoWindowAnchor = new GPoint(10,0);
CHAPTER 6. USERDATA OBJECTS INFOWINDOWS 31
6.3
Info Windows
Now that our GIcon knows where to anchor an Info Window, let’s pop one up.
The API treats Info Windows slightly differently than GMarkers in several ways. While you can have as many GMarkers on the map as you like, the API limits you to displaying a single Info Window at a time. If you add a GMarker offscreen, the map doesn’t scroll to display it. If you open an Info Window offscreen, the map pans smoothly until the Info Window comes into view.
As with dragging earlier, you can control the ability of the map to display Info Windows using the methods map.enableInfoWindow( )
and map.disableInfoWindow( ). To check the current state, use the
methodmap.infoWindowEnabled( ).
Info Windows are not first-class objects that you can instantiate and leave laying around. Instead, you must call one of several
openIn-foWindow( ) methods on either a map or a GMarker.
An Info Window requires a point and a payload. IfopenInfoWindow( ) is called on a GMarker, the point is implied. If it is called on a map, you must specify it. The payload can be either an HTML DOM element or a string containing HTML (map.openInfoWindow( ) ormap.openInfoWindowHtml( ), respectively).
The easiest way to get started is to just pop up an Info Window at an arbitrary point on the map. Since the map provides a convenient
getCenter( ) method, we can use that to begin. openInfoWindowHtml( ) has two required arguments: the point and the HTML string.
var center = map.getCenter();
rida
y
s
CHAPTER 6. USERDATA OBJECTS INFOWINDOWS 32
map.openInfoWindowHtml(center, coords);
If you’re thinking to yourself that the coords variable doesn’t look much like HTML, well, you’re right. Despite the name, you can passopenInfoWindowHtml( ) a plain old string and it will get rendered faithfully. We’ll play with embedding HTML tags in our string in just a minute.
Theoretically, map.openInfoWindow( ) looks more generic. In reality, it probably should’ve been named map.openInfoWindowDom( ). For us to accomplish the same thing as above, we have to create a DOM textNode object to hold the string:
map.openInfoWindow(somePoint,
document.createTextNode("This is my string"));
Opening an Info Window directly on a GMarker is pretty straightfor-ward.
var myMarker = new GMarker(myPoint, myIcon);
map.addOverlay(myMarker);
myMarker.openInfoWindowHtml("Hey, check this out!");
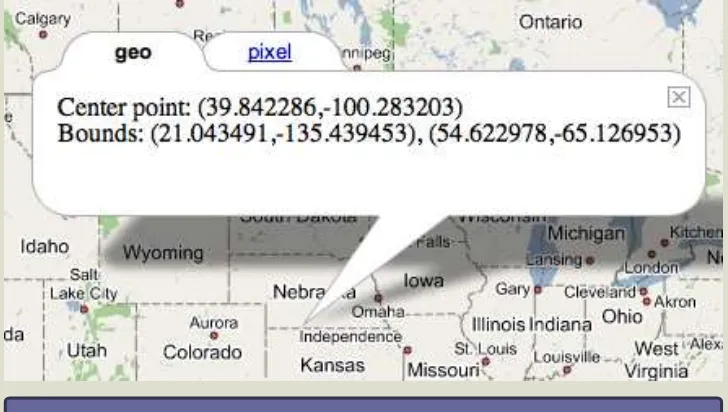
Starting with v2 of the API, you can pop up tabbed Info Windows usingopenInfoWindowTabs( ) and openInfoWindowTabsHtml( ). To do so, simply create an array ofGInfoWindowTabs. (See Figure6.3, on the GInfoWindowTab
following page.)
var geoCenter = map.getCenter(); //returns a GLatLng
var geoBounds = map.getBounds(); //returns a GLatLngBounds
var geoTabText = "Center point: (" + geoCenter.toUrlValue() + ")";
geoTabText += "<br />";
geoTabText += "Bounds: (" + geoBounds.getSouthWest().toUrlValue() + ")";
geoTabText += ", (" + geoBounds.getNorthEast().toUrlValue() + ")";
var pixelCenter = map.fromLatLngToDivPixel(geoCenter); // returns a GPoint
CHAPTER 6. USERDATA OBJECTS INFOWINDOWS 33
Figure 6.3: New to v2: tabbed Info Windows.
var pixelBounds = map.getSize(); //returns a GSize
var pixelTabText = "Center point: " + pixelCenter.toString();
pixelTabText += "<br />";
pixelTabText += "Bounds: " + pixelBounds.toString();
var tabs = [
new GInfoWindowTab("geo", geoTabText),
new GInfoWindowTab("pixel", pixelTabText)
];
map.openInfoWindowTabsHtml(geoCenter, tabs);
By default, the first tab in the array is displayed. To override this, pass in aGInfoWindowOptionsobject toopenInfoWindowTabsHtml( ) as GInfoWindowOptions
the last argument. The selectedTab property is the index of the tab in array notation (the first element is 0, the second is 1, etc.).
rida
y
s
CHAPTER 6. USERDATA OBJECTS INFOWINDOWS 34
new GInfoWindowTab("geo", geoTabText),
new GInfoWindowTab("pixel", pixelTabText)
];
var opts = new Object();
opts.selectedTab = 1;
map.openInfoWindowTabsHtml(geoCenter, tabs, opts);
In addition to text-based Info Windows, you can display a graphi-cal Info Window that shows a zoomed-in mini map over the point. (Think of it as a digital magnifying glass.) showMapBlowup( ) is avail-able on both maps and markers. By default, it uses a zoomLevel of 17 and the current mapType. You can override these values by passing in a GInfoWindowOptions.
There is no GInfoWindowOptions object, really. You cannot instantiate it. (Notice in the code example that we create a plain old new Object().) It is given a proper name for
documentation purposes only. Technically, you don’t even have to bother with creating a named object; just pass in properties on an anonymous object in the function call.
map.addOverlay(googleMarker);
var opts = new Object();
opts.zoomLevel = 14;
opts.mapType = G_SATELLITE_MAP;
googleMarker.showMapBlowup(opts);
//NOTE: rather than creating a separate opts object,
// you can pass in an anonymous object
googleMarker.showMapBlowup({zoomLevel:14, mapType:G_SATELLITE_MAP});
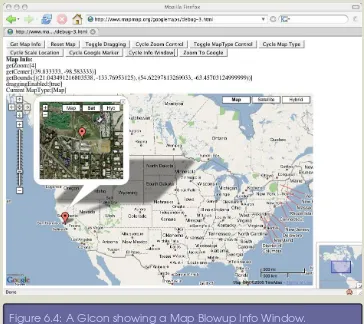
Take a look athttp://www.mapmap.org/googlemaps/debug-3.html
to see this in action. The Cycle Google Marker button shows you a default and custom GIcon over Google’s headquarters. TheCycle
Info Windows button shows you an Info Windows on the map, an
Info Window on a GMarker, and a Map Blowup. (See Figure6.4, on the next page.)
CHAPTER 6. USERDATA OBJECTS GPOLYLINE 35
Figure 6.4: A GIcon showing a Map Blowup Info Window.
6.4
GPolyline
To wrap up this chapter, lets talk about GPolylines. These are the GPolyline
lines used by maps.google.com to display your turn-by-turn driving directions. Even though it may sound a bit strange to the untrained ear initially, “polyline” is technically the correct term. A line is a straight line with two end points. A polyline has multiple vertices, allowing our map element to zig-zag as expected.
rida
y
s
CHAPTER 6. USERDATA OBJECTS GPOLYLINE 36
constructor. If you would like to tweak the appearance, you can pass in three optional arguments: color, weight, and opacity. Color
is the same RGB hex string you use in traditional web development. (There are many nice webpages that list hex RGB values, such as
this one.) Weight is an integer value; the higher the number, the
http:// www.hypersolutions.org/ pages/ rgbhex.html
thicker the line. Opacity is a decimal value that specifies the trans-parency of the line. 1 is fully opaque. 0 is fully transparent. For 50% opacity, use 0.5.
var myPoints = new Array(denver, santaFe, lasVegas, sanFrancisco);
var myLine = new GPolyline(myPoints);
map.addOverlay(myLine);
var myFancyPoints = new Array(denver, saltLakeCity, portland, seattle);
var myFancyLine = new GPolyline(myFancyPoints, "#FF0000", 10, 0.5);
map.addOverlay(myFancyLine);
Go tohttp://www.mapmap.org/googlemaps/debug-4.htmlto see GPoly-lines in action. The "Cycle Lines" button allows you to see a simple polyline and a styled example. (See Figure 6.5, on the following page.)
In most browsers, polylines are rendered on the Google servers and passed down to the browser as an overlay. If you are using Microsoft Internet Explorer, you can have the browser render polylines client-side. Doing so will improve your performance. Include the following snippet of code to have IE use native VML rendering:
<!DOCTYPE html PUBLIC "-//W3C//DTD XHTML 1.0 Strict//EN"
"http://www.w3.org/TR/xhtml1/DTD/xhtml1-strict.dtd">
<html xmlns="http://www.w3.org/1999/xhtml"
xmlns:v="urn:schemas-microsoft-com:vml">
<head>
<style type="text/css"> v\:* { behavior:url(#default#VML); } </style>
</head>
CHAPTER 6. USERDATA OBJECTS GPOLYLINE 37
Figure 6.5: GPolylines on a map.
Even if you get past all of the geo-geek jargon we’ve thrown at you up to this point, the GPolyline might still end up breaking your heart. People who want to display a polyline that follows the underlying roads like, “Plot my driving route from Denver to Las Vegas using Interstate 70” will be disappointed. This level of functionality is simply not provided by the current API. You are given the mechanics to draw lines on your map, but not the underlying intelligence agent.
rida
y
s
CHAPTER 6. USERDATA OBJECTS GPOLYLINE 38
great if the API allowed us to leverage this base functionality to do more complicated actions. The website MapsOnUs lets you create
http:// www.mapsonus.com/
a driving plan that goes from Point A to Point B with intermediate stopping points along the way. Even if the Google Maps API didn’t provide this level of functionality initially, making routes first class objects like GMarkers would allow us to instantiate several of them and display them simultaneously on the map. (Perhaps in the next release of the API, eh?)
Starting with v2 of the API, Google has given us the capabilities to begin this process. Just like the GControl object that allows you to create your own custom map control, v2 introduces the new
GOv-erlay object. Creating your own overlay (such as a routing overlay)
GOverlay
is entirely possible now, but it’s not for the faint of heart. For more information and some source code, see theGoogle Documentation.
Chapter 7
Events
At this point, we now have all of the building blocks in place. You can create a map. You can put up controls that allow the user to change the basic characteristics of the map. You can add custom objects like points, lines, and Info Windows. But these last two sections – Events and AJAX – are what really (excuse the pun) put Google on the map of mapping websites.
When Google Maps was first released, it wasn’t the first mapping site on the web. MapQuest, Yahoo Maps, and MSN Maps had all been around for years. The model was well understood – type in your address, click submit, and then print out your static map. Panning was a “click, then wait for the screen to refresh” affair.
What Google Maps brings to the table was an amazing level of inter-activity. You are inexorably drawn to mess around with a Google map – drag it around, flip on satellite imagery, zoom in and out. With the stock JavaScript event model available to you, coupled with the custom events on the map and map objects, you can continue that level of deep interactivity in a customized way.
7.1
GEvent
rid a
y
s
CHAPTER 7. EVENTS GEVENT 40
by having a table click place something on the map, or a map click insert something into a table.
If you’ve done JavaScript programming in the past, you may be familiar with the “old school” way of event handling:
<select onchange='doSomethingElse()'> <button onclick='doSomething()'>
The onWhatever attributes assign a single event listener to specific element events. The Google Maps API uses the more modern method of programmatically adding event listeners to elements. Moving from onWhatever attributes to event listeners, in addition to making your code more loosely coupled, allows you to associate more than one listener to the same event.
You can tap into the Google event model using static methods on
theGEvent object:
GEvent
var clickListener = GEvent.addListener(map, "click", doSomething());
GEvent.removeListener(clickListener);
The GEvent object does something very nice for us—it normalizes the JavaScript event model across browsers. Browsers like Firefox and Opera use the standard DOM event model. Internet Explorer uses a proprietary, incompatible model. It is common practice for web developers to bridge the gap between disparate browsers by writing their own normalization methods:
function registerListener(domElement, event, listener, captureEvent)
{
//Normalize event registration across all browsers
//1. Mozilla/Opera, 2. IE, 3. Other
if(domElement.addEventListener){
domElement.addEventListener(event, listener, captureEvent);
CHAPTER 7. EVENTS GEVENT 41
return true;
}
else if(domElement.attachEvent){
return domElement.attachEvent('on'+ event, listener);
}
else{
domElement['on'+ event] = listener;
return true;
}
}
Notice that this code doesn’t check on the browser—it checks on the availability of the function call. The code snippet
if (domElement.addEventListener)
says, “If you (the current browser I’m running in right now) under-stand this call, then go ahead and do something interesting.” Sim-ilarly, detaching an event listener can be accomplished in a cross browser fashion using the following code:
function unregisterListener(domElement, event, listener, captureEvent)
{
//Normalize event registration across all browsers
//1. Mozilla/Opera, 2. IE, 3. Other
if(domElement.removeEventListener){
domElement.removeEventListener(event, listener, captureEvent);
return true;
}
else if(domElement.detachEvent){
return domElement.detachEvent('on'+ event, listener);
}
else{
domElement['on'+ event] = "";
return true;
rid a
y
s
CHAPTER 7. EVENTS GBROWSERISCOMPATIBLE 42
}
The GEvent object encapsulates this type of behavior so that we,
I should point out that there are plenty of open source JavaScript frameworks out there that take care of these mundane details for you out of the box.Prototypeis one popular example.
http://www.ajaxian.comis a great resource for keeping up with this fast-moving market
segment. I purposely chose to limit our focus to the Google Maps JavaScript framework in this book – learning one framework at a time is enough, wouldn’t you say?
the developers, don’t have to account for which browser we’re run-ning in by using additional code. Until all vendors decide to become conformant to the specification, it’s nice that the API can compen-sate for us.
7.2
GBrowserIsCompatible
On a similar note, the Google Maps API offers us a method to check whether the browser is compatible:
if (GBrowserIsCompatible()) {
var map = new GMap2(document.getElementById("map"));
map.setCenter(myPoint, 1);
}
We haven’t been wrapping our code in this call for readability rea-sons (and because all modern browsers are supported), but it’s nice to know that this level of introspection is available to us by both native JavaScript and the Google Maps API.
7.3
GMap Events
Some of the events on the map object are simple events—they don’t return any values, they just fire a notification.
drag( )
Sent continuously while the user is dragging the map.
dragstart( )
Sent when the user begins dragging the map.
CHAPTER 7. EVENTS GMAP EVENTS 43
dragend( )
Sent when the user stops dragging the map.
infowindowopen( )
Sent when an Info Window is diplayed.
infowindowclose( )
Sent when an Info Window is closed.
maptypechanged( )
Sent when the map is switched between Map, Satellite, and Hybrid modes.
Other map events return additional information. Thezoomendevent, for example, returns the previous and current zoom levels.
click(overlay, point)
Sent when the map is clicked on. If the user clicks on a GMarker or other overlay object, that object is returned. If an open area of the map is clicked, the lat/long point of the click is returned.
zoomend(previousZoomLevel, currentZoomLevel)
Sent when the user changes the zoom level of the map.
addoverlay(overlay)
Sent when a new overlay is added to the map. The added over-lay is returned.
removeoverlay(overlay)
Sent when an overlay is removed from the map. The removed overlay is returned.
clearoverlays( )
rid a
y
s
CHAPTER 7. EVENTS EVENT HANDLERS 44
mousemove(latlng)
Sent continuously when the mouse is in motion. The lat/long of the cursor is returned.
mouseout(latlng)
Sent when the mouse is moved off of the map. The lat/long of the cursor is returned.
mouseover(latlng)
Sent when the mouse is moved on to the map. The lat/long of the cursor is returned.
7.4
Event Handlers
Events can either be passed to functions or handled by function closures. A function closure is similar to an anonymous inner class in Java. If the event handling code isn’t more than a couple of lines and doesn’t need to be reused, a closure is a quick and dirty way to code the behavior.
var dragListener = GEvent.addListener(map, "drag", function() {
document.getElementById("output").innerHTML =
map.getCenter().toUrlValue();
} );
var clickListener = GEvent.addListener(map,
"click",
function(overlay, point) {
handleMapClick(overlay, point);
} );
CHAPTER 7. EVENTS GMARKEREVENTS 45
7.5
GMarker Events
GMarkers also have events that you can listen for. Earlier, you saw that you could pop up an Info Window by either adding it to a map or to a GMarker. If you add it to the map, you have to provide the coordinates; if you add it to a marker, the point is implicit. The same idea applies to events: if you register a click listener on the map, the listener passes back the overlay or the point in the event. If you register a click listener on a point, the event doesn’t have any associated arguments because you know explicitly which overlay was clicked.
click( )
Sent when the marker is single-clicked.
dblclick( )
Sent when the marker is double-clicked.
mouseover( )
Sent when the mouse moves over the marker.
mouseout( )
Sent when the mouse moves off of the marker.
infowindowopen( )
Sent when the corresponding Info Window is diplayed.
infowindowclose( )
Sent when the corresponding Info Window is closed.
remove( )
rid a
y
s
CHAPTER 7. EVENTS SIMPLE EXAMPLES 46
Figure 7.1: Adding pushpins to your Google Map.
7.6
Simple Examples
Seehttp://www.mapmap.org/googlemaps/debug-5.htmlfor an exam-ple of map events in action (it looks a bit like Figure7.1 ).
Notice that we added a “Cycle Pushpins” button. If you press the button once, it allows you to add a new GMarker by clicking on the map. Pressing the button a second time adds a second listener that displays the coordinates of the click at the top of the screen. Pressing the button a third time turns off both listeners and clears all of the markers.
CHAPTER 7. EVENTS SIMPLE EXAMPLES 47
//events
var pushpinsCycle = 0;
var clickListener;
var clickListener2;
function cyclePushpins()
{
switch(pushpinsCycle)
{
//turn on event listener
case 0:
pushpinsCycle++;
clickListener = GEvent.addListener(map, "click",
function(overlay, point) {
pushpin(overlay, point);
} );
document.getElementById("mapInfo").innerHTML =
"Click anywhere on the map to display a pushpin.";
break;
//turn on another event listener
case 1:
pushpinsCycle++;
clickListener2 = GEvent.addListener(map, "click",
function(overlay, point) {
showCoords(overlay, point);
} );
document.getElementById("mapInfo").innerHTML =
"Click anywhere on the map to display a pushpin "
+ "<b><i>with coordinates</i></b>.";
break;
//turn off event listener
case 2:
pushpinsCycle = 0;
GEvent.removeListener(clickListener);
rid a
y
s
CHAPTER 7. EVENTS A REAL-WORLD EXAMPLE 48
map.clearOverlays();
document.getElementById("mapInfo").innerHTML =
"All click listeners have been removed.";
break;
}
}
function pushpin(overlay, point)
{
if (overlay) { map.removeOverlay(overlay); }
else if (point) { map.addOverlay(new GMarker(point)); }
}
function showCoords(overlay, point)
{
var output = "";
if(point){
output += "(" + point.toUrlValue() + ")";
}
document.getElementById("mapInfo").innerHTML = output;
}
7.7
A Real-World Example
Let’s look at a more robust application. The beginning of it is online at http://www.mapmap.org/googlemaps/cities-nomap.html. (See Figure 7.2, on the following page.) There are two basic elements on the page: a form for data entry and an HTML table to display the results. Type values in the form and press the Add City button – the data should appear in the table. If you press the delete button on the table row, the row should disappear.
Now before you get too upset about having to type in Lat/Long points by hand, just settle down. Once we add a little AJAX to our
CHAPTER 7. EVENTS A REAL-WORLD EXAMPLE 49
Figure 7.2: Using Javascript to add form data to the table
application, you’ll be able to type in a city and have a web service fill in the coordinates for you. For that matter, once we add a map to our application, you’ll be able to click on the map and have it fill in the coordinates for you. For now, we just want to exercise the plain old HTML and JavaScript.
Let’s walk through the application. The first thing we do is register the addCity() function as an event listener for the Add Citybutton. The pageInit( ) function is essentially our JavaScript constructor for the page—we wait until the entire HTML page is loaded, and then run thepageInit( ) function.
Waiting for the entire page to load helps avoid strange lifecycle issues across browsers—some browsers try to run the event listener code before the HTML elements exist, causing the
application to fail silently. <script type="text/javascript">
&ldots;
function pageInit()
{
rid a
y
s
CHAPTER 7. EVENTS A REAL-WORLD EXAMPLE 50
"click", addCity, false);
}
registerListener(window, "load", pageInit, false);
</script>
Next, let’s examine theaddCity( ) function. When the user clicks the
Add City button, we pull the data out of the HTML form via
getCity-Bean( ) and pass it to theaddToTable( ) andaddToArray( ) functions.
function addCity()
{
var cityBean = getCityBean();
addToTable(cityBean);
addToArray(cityBean);
}
ThegetCityBean( ) method takes advantage of a little JavaScript magic. We create a new generic Object and then add attributes to it on the fly. Each document.getElementById( ) method grabs input data from the HTML form.
<div id="formSection">
<form id="cityForm" >
City: <input type="text" name="city" id="city"/>
State: <input type="text" name="state" id="state" size="2" maxlength="2"/>
Latitude: <input type="text" name="latitude" id="latitude">
Longitude: <input type="text" name="longitude" id="longitude"/>
<input type="button" name="AddCity" value="Add City" id="addCityButton"/>
</form>
</div>
function getCityBean()
{
var cityBean = new Object();
CHAPTER 7. EVENTS A REAL-WORLD EXAMPLE 51
cityBean.city = document.getElementById("city").value;
cityBean.state = document.getElementById("state").value;
cityBean.latitude = document.getElementById("latitude").value;
cityBean.longitude = document.getElementById("longitude").value;
cityId++;
cityBean.id = "city" + cityId;
return cityBean;
}
Once our data is gathered together in a convenient bucket, we pass it toaddToTable( ) to update the table display.
Notice that the table has an empty<tbody>
element. While rarely used when hand-editing tables in HTML, each table technically has an implicit<thead>,<tbody>, and<tfoot>
section. If you plan to use JavaScript to programmatically add and remove data from your HTML tables, it is best to explicitly create them and give them a unique id. When
adding a row directly to a table element, most browsers do the right thing and add it to the
<tbody>. Safari, on the other hand, does
exactly what you ask it to do and adds the row to the table—above the<thead>section.
<div id="tableSection">
<table border="1">
<tr id="cityHeader">
<td>Delete</td>
<td>City</td>
<td>State</td>
<td>Latitude</td>
<td>Longitude</td>
</tr>
<!-- Note: if tbody is not used, Safari adds new rows above the header -->
<tbody id="cityTable"></tbody>
</table>
</div>
function addToTable(cityBean)
{
var tbl = document.getElementById("cityTable");
var newRow = tbl.insertRow(tbl.rows.length);
newRow.id = cityBean.id;
var deleteCell = newRow.insertCell(0);
rid a
y
s
CHAPTER 7. EVENTS A REAL-WORLD EXAMPLE 50
"click", addCity, false);
}
registerListener(window, "load", pageInit, false);
</script>
Next, let’s examine theaddCity( ) function. When the user clicks the
Add City button, we pull the data out of the HTML form via
getCity-Bean( ) and pass it to theaddToTable( ) andaddToArray( ) functions.
function addCity()
{
var cityBean = getCityBean();
addToTable(cityBean);
addToArray(cityBean);
}
ThegetCityBean( ) method takes advantage of a little JavaScript magic. We create a new generic Object and then add attributes to it on the fly. Each document.getElementById( ) method grabs input data from the HTML form.
<div id="formSection">
<form id="cityForm" >
City: <input type="text" name="city" id="city"/>
State: <input type="text" name="state" id="state" size="2" maxlength="2"/>
Latitude: <input type="text" name="latitude" id="latitude">
Longitude: <input type="text" name="longitude" id="longitude"/>
<input type="button" name="AddCity" value="Add City" id="addCityButton"/>
</form>
</div>
function getCityBean()
{
var cityBean = new Object();
CHAPTER 7. EVENTS A REAL-WORLD EXAMPLE 53
Figure 7.3: Adding cities to the map
method—we get thecityIdfrom the row, and calldeleteFromTable(cityId)
and deleteFromArray(cityId).
OK, now let’s add in the map. (See Figure7.3, orhttp://www.mapmap.org/googlem
Most of the code should be familiar to you from previous examples. All we’re doing is taking our lat/long point from the HTML form and constructing a GMarker out of it.
rid a
y
s
CHAPTER 7. EVENTS A REAL-WORLD EXAMPLE 54
function addToMap(cityBean)
{
var point = new GLatLng(cityBean.latitude, cityBean.longitude);
cityBean.marker = new GMarker(point);
map.addOverlay(cityBean.marker);
}
When we delete a city, we also calldeleteFromMap( ).
function deleteFromMap(cityId)
{
var position = findById(cityId);
if(position > -1) {
var cityBean = cityList[position];
map.removeOverlay(cityBean.marker);
map.closeInfoWindow();
}
}
Just to show off, we add an event listener to each cell in the table that opens an Info Window on the map when the user moves their mouse over the row. We tweak the addToTable( ) function to register the event listeners.
function addToTable(cityBean)
{
var tbl = document.getElementById("cityTable");
var newRow = tbl.insertRow(tbl.rows.length);
newRow.id = cityBean.id;
var deleteCell = newRow.insertCell(0);
var deleteButton = document.createElement("input");
deleteButton.type = "button";
deleteButton.name = "Delete";
deleteButton.value = "Delete";
CHAPTER 7. EVENTS A REAL-WORLD EXAMPLE 53
Figure 7.3: Adding cities to the map
method—we get thecityIdfrom the row, and calldeleteFromTable(cityId)
and deleteFromArray(cityId).
OK, now let’s add in the map. (See Figure7.3, orhttp://www.mapmap.org/googlem
Most of the code should be familiar to you from previous examples. All we’re doing is taking our lat/long point from the HTML form and constructing a GMarker out of it.
rid a
y
s
CHAPTER 7. EVENTS A REAL-WORLD EXAMPLE 52
deleteButton.type = "button";
deleteButton.name = "Delete";
deleteButton.value = "Delete";
registerListener(deleteButton, "click", deleteCity, false);
deleteCell.appendChild(deleteButton);
var cityCell = newRow.insertCell(1);
cityCell.appendChild(document.createTextNode(cityBean.city));
var stateCell = newRow.insertCell(2);
stateCell.appendChild(document.createTextNode(cityBean.state));
var latitudeCell = newRow.insertCell(3);
latitudeCell.appendChild(document.createTextNode(cityBean.latitude));
var longitudeCell = newRow.insertCell(4);
longitudeCell.appendChild(document.createTextNode(cityBean.longitude));
}
Adding the new cityBean to an array is painfully simple compared to the previous addToTable( ) code. Since JavaScript arrays grow dynamically, our method is a one-liner.
function addToArray(cityBean)
{
cityList[cityList.length] = cityBean;
}
The deleteCity( ) function can be called from any row in the table that has aDelete button. The process is the reverse of theaddCity( )
CHAPTER 7. EVENTS A REAL-WORLD EXAMPLE 57
break;
//turn off event listener
case 1:
pushpinsCycle = 0;
GEvent.removeListener(clickListener);
button.value = buttonOff;
break;
}
}
When the map listener is engaged, thepushpin( ) function gets called each time the user clicks on the