LAMPIRAN A
PERHITUNGAN STATISTIK KURVA BAKU
Data Kurva Baku Propranolol HCl dalam Larutan Dapar Fosfat Isotonis pH 7,4 Pengujian I
Konsentrasi Abs X2 Y2 XY 5,03
15,09 25,15 35,21 45,27
0,113 25,3009 0,0177 0,5684 0,294 227,7081 0,0864 4,4365 0,500 632,5225 0,2500 12,5750 0,752 1239,7441 0,5655 26,4779 0,921 2049,3729 0,8482 41,6937 = 4174,6485 = 1,7678 = 85,7515 Data Kurva Baku Propranolol HCl dalam Larutan Dapar Fosfat Isotonis pH
7,4 Pengujian 2
Data Kurva Baku Propranolol HCl dalam Larutan Dapar Fosfat Isotonis pH 7,4 Pengujian III
Konsentrasi Abs X2 Y2 XY 5,02
15,06 25,10 35,14 45,18
0,115 25,2004 0,0132 0,5773 0,282 226,8063 0,0795 4,2469 0,497 630,0100 0,2470 12,4747 0,691 1234,8196 0,4775 24,2817 0,870 2041,2324 0,7569 39,3066 = 4158,0660 = 1,5741 = 80,8872 X2 XY Y2 N Ssi RDF I
II III
4174,6485 4141,5165 4158,0660
85,7515 78,7923 80.8872
1,7678 1,5007 1,5741
5 1,7473 4 5 1,4817 4 5 1,5546 4 4,7836 12474,2310 245,4310 4,8426
SSc = ∑ Yc – [( ∑ Xyc)2 / ∑ Xc ]
= 4,8426 – [ 245,4310 / 12474,2310 ] = 4,8229 SSp = SS1 + SS2 + SS3
= 1,7473 + 1,4817 + 1,5546 = 4,7836 Fhitung = ( SSc SSp / k 1 ) / ( SSp / 12)
LAMPIRAN B
PERHITUNGAN MOISTURE CONTENT (MC) Formula -1
W (gram) Wp (gram) Wa (gram) MC (%)
0,414 0,384 0,030 7,8 %
0,407 0,378 0,029 7,67 %
0,418 0,388 0,030 7,73 %
Formula a
W (gram) Wp (gram) Wa (gram) MC (%)
0,318 0,278 0,040 14,39 %
0,310 0,270 0,040 14,81 %
0,321 0,280 0,041 14,64 %
Formula b
W (gram) Wp (gram) Wa (gram) MC (%)
0,365 0,314 0,051 16,24 %
0,378 0,325 0,053 16,31 %
Formula ab
W (gram) Wp (gram) Wa (gram) MC (%) 0,291 0,251 0,040 15,94
0,301 0,260 0,041 15,77
0,296 0,255 0,041 16,08
Keterangan : W = berat mula-mula
LAMPIRAN C
Anova: Single Factor
SUMMARY
Groups Count Sum Average Variance
Column 1 3 23,2 7,733333 0,004233
Column 2 3 43,84 14,61333 0,044633
Column 3 3 48,22 16,07333 0,123233
Column 4 3 47,79 15,93 0,0241
ANOVA Source of
Variation SS df MS F P-value F crit Between
Groups 140,9708 3 46,99028 958,0076 1,46E-10 4,066181 Within
Groups 0,3924 8 0,04905
LAMPIRAN D
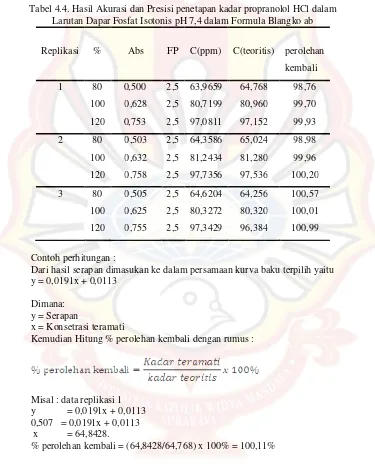
Tabel 4.4. Hasil Akurasi dan Presisi penetapan kadar propranolol HCl dalam Larutan Dapar Fosfat Isotonis pH 7,4 dalam Formula Blangko ab
Replikasi % Abs FP C(ppm) C(teoritis) perolehan kembali 1 80 0,500 2,5 63,9659 64,768 98,76 100 0,628 2,5 80,7199 80,960 99,70 120 0,753 2,5 97,0811 97,152 99,93 2 80 0,503 2,5 64,3586 65,024 98,98 100 0,632 2,5 81,2434 81,280 99,96 120 0,758 2,5 97,7356 97,536 100,20 3 80 0,505 2,5 64,6204 64,256 100,57 100 0,625 2,5 80,3272 80,320 100,01 120 0,755 2,5 97,3429 96,384 100,99
Contoh perhitungan :
Dari hasil serapan dimasukan ke dalam persamaan kurva baku terpilih yaitu y = 0,0191x + 0,0113
Dimana: y = Serapan
x = Konsetrasi teramati
Kemudian Hitung % perolehan kembali dengan rumus :
Misal : data replikasi 1 y = 0,0191x + 0,0113 0,507 = 0,0191x + 0,0113 x = 64,8428.
LAMPIRAN E
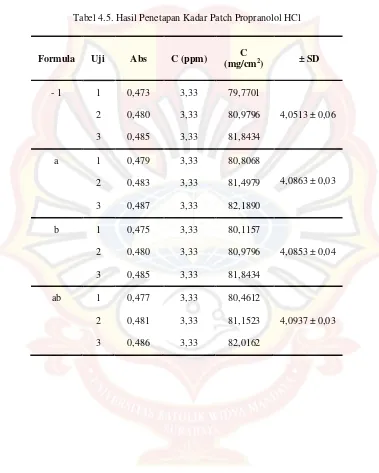
Tabel 4.5. Hasil Penetapan Kadar Patch Propranolol HCl
Formula Uji Abs C (ppm) C
(mg/cm2) ± SD
- 1 1 0,473 3,33 79,7701
2 0,480 3,33 80,9796 4,0513 ± 0,06
3 0,485 3,33 81,8434
a 1 0,479 3,33 80,8068
2 0,483 3,33 81,4979 4,0863 ± 0,03
3 0,487 3,33 82,1890
b 1 0,475 3,33 80,1157
2 0,480 3,33 80,9796 4,0853 ± 0,04
3 0,485 3,33 81,8434
ab 1 0,477 3,33 80,4612
2 0,481 3,33 81,1523 4,0937 ± 0,03
LAMPIRAN F
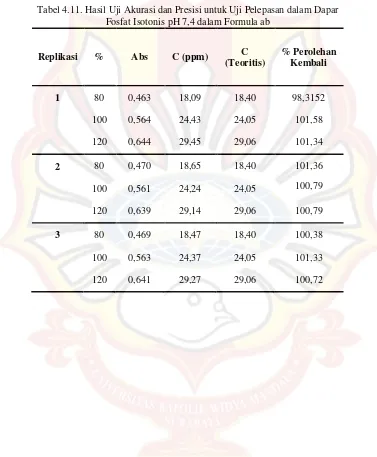
Tabel 4.11. Hasil Uji Akurasi dan Presisi untuk Uji Pelepasan dalam Dapar Fosfat Isotonis pH 7,4 dalam Formula ab
Replikasi % Abs C (ppm) C
(Teoritis)
% Perolehan Kembali
1 80 0,463 18,09 18,40 98,3152
100 0,564 24,43 24,05 101,58
120 0,644 29,45 29,06 101,34
2 80 0,470 18,65 18,40 101,36
100 0,561 24,24 24,05 100,79
120 0,639 29,14 29,06 100,79
3 80 0,469 18,47 18,40 100,38
100 0,563 24,37 24,05 101,33
LAMPIRAN G
HASIL UJI ANOVA PELEPASAN PROPRANOLOL HCL DENGAN DESAIN FAKTORIAL
Response 1 PELEPASAN
ANOVA for selected factorial model
Analysis of variance table [Partial sum of squares - Type III] Sum of Mean F p-value
Source Squares df Square Value Prob>F Model 130.54 3 43.51 30.75 <0.0001
A-HPMC 128.05 1 128.05 90.50 <0.0001
B-OLEIC ACID 0.56 1 0.56 0.40 0.5457
AB 1.92 1 1.92 0,2776
Pure Error 11.32 8 1.42
Cor Total 141.86 11
The Model F-value of 30.75 implies the model is significant. There is only a 0.01% chance that a "Model F-Value" this large could occur due to noise. Values of "Prob > F" less than 0.0500 indicate model terms are significant. In this case A are significant model terms.
Values greater than 0.1000 indicate the model terms are not significant. If there are many insignificant model terms (not counting those required to support hierarchy), model reduction may improve your model.
Std. Dev. 1.19 R-Squared 0.9202 Mean 168.22 Adj R-Squared 0.8903 C.V. % 0.71 Pred R-Squared 0.8205 PRESS 25.47 Adeq Precision 10.678 The "Pred R-Squared" of 0.8205 is in reasonable agreement with the "Adj R-Squared" of 0.8903.
Coefficient Standard 95% CI 95% CI 95% CI High Factor Estimate df Error low
Intercept 168.22 1 0.34 167.42 169.01 A-HPMC 3.27 1 0.34 2.47 4.06 B-OLEIC ACID 0.22 1 0.34 -0.58 1.01 AB-0.40 1 0.34 -1.19 0.39 1.00
Final Equation in Terms of Coded Factors:
PELEPASAN =
+168.22
+3.27 * A
+0.22 * B
-0.40 * A * B
Final Equation in Terms of Actual Factors:
PELEPASAN =
+168.21667
+3.26667 * HPMC
+0.21667 * OLEIC ACID
-0.40000 * HPMC * OLEIC ACID
The Diagnostics Case Statistics Report has been moved to the Diagnostics Node.
In the Diagnostics Node, Select Case Statistics from the View Menu. Proceed to Diagnostic Plots (the next icon in progression). Be sure to look at the:
1) Normal probability plot of the studentized residuals to check for normality of residuals.
2) Studentized residuals versus predicted values to check for constant error.
3) Externally Studentized Residuals to look for outliers, i.e., influential values.
4) Box-Cox plot for power transformations.
HASIL UJI ANOVA PENETRASI PROPRANOLOL HCL DENGAN DESAIN FAKTORIAL
Response 2 PENETRASI
ANOVA for selected factorial model
Analysis of variance table [Partial sum of squares - Type III] Sum of Mean F p-value
Source Squares df Square Value Prob > F Model 57.95 3 19.32 <0.0001
A-HPMC 19.10 1 19.10 187.62 < 0.0001
B-OLEIC ACID 34.41 1 34.41 337.97 < 0.0001
AB4.44 1 4.44 43.62 0.0002
Pure Error 0.81 8 0.10
Cor Total 58.77 11
The Model F-value of 189.74 implies the model is significant. There is only a 0.01% chance that a "Model F-Value" this large could occur due to noise.
Values of "Prob > F" less than 0.0500 indicate model terms are significant. In this case A, B, AB are significant model terms.
Values greater than 0.1000 indicate the model terms are not significant. If there are many insignificant model terms (not counting those required to support hierarchy),
model reduction may improve your model.
Std. Dev. 0.32 R-Squared 0.9861
Mean 47.07 Adj R-Squared 0.9809 C.V. % 0.68 Pred R-Squared 0.9688
PRESS 1.83 Adeq Precision 32.082
The "Pred R-Squared" of 0.9688 is in reasonable agreement with the "Adj R-Squared" of 0.9809.
Coefficient Standard 95% CI 95% CI 95% CI High Factor Estimate df Error Low
Intercept 47.07 1 0.092 46.86 47.29 A-HPMC 1.26 1 0.092 1.05 1.47 B-OLEIC ACID 1.69 1 0.092 1.48 1.91 AB0.61 1 0.092 0.40 0.82 1.00 Final Equation in Terms of Coded Factors:
PENETRASI =
+47.07
+1.26 * A
+1.69 * B
+0.61 * A * B
Final Equation in Terms of Actual Factors:
PENETRASI =
+47.07333
+1.26167 * HPMC
+1.69333 * OLEIC ACID
+0.60833 * HPMC * OLEIC ACID
The Diagnostics Case Statistics Report has been moved to the Diagnostics Node.
In the Diagnostics Node, Select Case Statistics from the View Menu. Proceed to Diagnostic Plots (the next icon in progression). Be sure to look at the:
1) Normal probability plot of the studentized residuals to check for normality of residuals.
2) Studentized residuals versus predicted values to check for constant error.
3) Externally Studentized Residuals to look for outliers, i.e., influential values.
4) Box-Cox plot for power transformations.
If all the model statistics and diagnostic plots are OK, finish up with the Model Graphs icon.
LAMPIRAN H
DATA PELEPASAN PROPANOLOL HC1
1. Hasil Uji Pelepasan Patch Propanolol Formula -1
Replikasi t(jam) Abs Cn’(ppm) FP Qt (µg/cm2)
1 0,25
0,5 0,75 1 1,5 2 2,5 3 4 5 6 0,25 0,345 0,411 0,503 0,64 0,783 0,885 ,981 0,57 0,651 0,668 12,4911 17,4614 20,9145 25,7278 32,8955 40,3771 45,7136 50,7362 29,2332 33,4710 34,3604 3,3 3,3 3,3 106,827579 149,290424 178,790926 219,912839 281,148732 345,066488 390,658174 433,567996 824,539055 944,016091 969,091519
2 0,25
0,5 0,75 1 1,5 2 2,5 3 4 5 6 0,263 0,348 0,421 0,516 ,65 0,786 0,883 0,982 0,576 0,65 0,671 13,1712 17,6184 21,4377 26,4079 33,4187 40,5341 45,6090 50,7886 29,5471 33,4187 34,5174 3,3 3,3 3,3 112,638284 150,631355 183,2607 225,723545 285,618505 346,40742 389,764219 434,014974 833,389205 942,541066 973,516594
3 0,25
2. Hasil Uji Pelepasan Patch Propranolol Formula a
Replikasi t(jam) Abs Cn’(ppm) FP Qt (µg/cm2)
1 0,25
0,5 0,75 1 1,5 2 2,5 3 4 5 6 0,319 0,429 0,53 0,71 0,806 0,975 1,246 0,653 0,66 0,685 0,716 16,1011 21,8562 27,1404 36,5578 41,5804 50,4223 64,6008 33,5757 33,9419 35,2499 36,8717 3,3 3,3 3,3 137,669013 186,836518 231,981227 312,437144 355,346966 430,886133 552,016985 573,918874 957,291317 994,166946 1039,89273
2 0,25
0,5 0,75 1 1,5 2 2,5 3 4 5 6 0,31 0,421 0,524 0,699 0,805 0,967 1,205 0,65 0,66 0,687 0,715 15,6303 21,4377 26,8265 35,9823 41,5281 50,0038 62,4557 33,4187 33,9419 35,3545 36,8194 3,3 3,3 3,3 133,646217 183,2607 229,299363 307,520393 354,899989 427,310314 533,690915 571,23701 957,291317 997,116996 1038,4177
3 0,25
3. Hasil Uji Pelepasan Patch Propranolol Formula b
Replikasi t(jam) Abs Cn’(ppm) FP Qt (µg/cm2)
1 0,25
0,5 0,75 1 1,5 2 2,5 3 4 5 6 0,267 0,325 0,397 0,487 0,621 0,789 0,887 0,998 0,597 0,634 0,656 13,3806 16,415 20,182 24,8907 31,9014 40,691 45,8183 51,6257 30,6458 32,5816 33,7326 3,3 3,3 3,3 114,426193 140,350877 172,533244 212,761202 272,656163 347,748352 391,552129 441,166611 864,364733 918,940664 951,391217
2 0,25
0,5 0,75 1 1,5 2 2,5 3 4 5 6 0,26 0,315 0,387 0,478 0,615 0,782 0,881 0,99 0,615 0,637 0,65 13,0143 15,8919 19,6588 24,4198 31,5875 40,3248 45,5044 51,2071 31,5875 32,7385 33,4187 3,3 3,3 3,3 111,297352 135,881104 168,063471 208,738407 269,974299 344,619511 388,870265 437,590792 890,915186 923,365739 942,541066
3 0,25
4. Hasil Uji Pelepasan Patch Propranolol Formula ab
Replikasi t(jam) Abs Cn’(ppm) FP Qt (µg/cm2)
1 0,25
0,5 0,75 1 1,5 2 2,5 3 4 5 6 0,356 0,489 0,565 0,767 0,887 0,985 1,121 0,665 0,679 0,712 0,723 18,0369 24,9954 28,9716 39,54 45,8183 50,9455 58,0609 34,2035 34,9359 36,6625 37,2379 3,3 3,3 3,3 154,207174 213,655157 247,625433 337,914851 391,552129 435,355906 496,144821 584,646329 985,316795 1033,99262 1050,2179
2 0,25
0,5 0,75 1 1,5 2 2,5 3 4 5 6 0,345 0,48 0,557 0,759 0,876 0,98 1,079 0,65 0,665 0,71 0,729 17,4614 24,5245 28,553 39,1215 45,2428 50,6839 55,8635 33,4187 34,2035 36,5578 37,5519 3,3 3,3 3,3 14,290424 209,632361 244,049614 334,339032 386,635378 433,121019 477,371773 571,23701 964,666443 1031,04257 1059,06805
3 0,25
LAMPIRAN I
DATA PENETRASI PROPRANOLOL HCI
1. Hasil Uji Penetrasi Patch Propranolol Formula-1
Replikasi t(jam) Abs Cn’(ppm) Qt (µg/cm2)
1 0,25
0,5 0,75 1 1,5 2 2,5 3 4 5 6 0,171 0,206 0,257 0,313 0,367 0,425 0,48 0,567 0,627 0,687 0,724 8,3597 10,1891 12,8574 15,7872 18,6124 21,6469 24,5245 29,0762 32,2154 35,3545 37,2903 71,5163705 87,1605766 109,95642 134,987149 159,123924 185,048609 209,632361 248,519388 275,338027 302,156666 318,694826
2 0,25
0,5 0,75 1 1,5 2 2,5 3 4 5 6 0,176 0,209 0,26 0,32 0,376 0,43 0,488 0,57 0,638 0,696 0,735 8,6195 10,3461 13,0143 16,1535 19,0833 21,9085 24,943 29,2332 32,7909 35,8254 37,8658 73,7512571 88,5015085 111,297352 138,115991 163,14672 187,283495 213,20818 249,86032 280,254777 306,179461 323,611577
3 0,25
2. Hasil Uji Penetrasi Patch Propranolol Formula a
Replikasi t(jam) Abs Cn’(ppm) Qt (µg/cm2)
1 0,25
0,5 0,75 1 1,5 2 2,5 3 4 5 6 0,18 0,214 0,261 0,321 0,375 0,398 0,498 0,546 0,643 0,68 0,7 8,8288 10,6077 13,0666 16,2058 19,031 20,2343 25,4662 27,9775 33,0525 34,9883 36,0346 75,5391664 90,7363951 111,744329 138,562968 162,699743 172,980221 217,677953 239,132864 282,489664 299,027824 307,967371
2 0,25
0,5 0,75 1 1,5 2 2,5 3 4 5 6 0,198 0,226 0,287 0,339 0,387 0,421 0,483 0,557 0,661 0,698 0,724 9,7705 11,2355 14,4269 17,1475 19,6588 21,4377 24,6814 28,553 33,9942 35,93 37,2903 83,5847581 96,1001229 123,365739 146,60856 168,063471 183,2607 210,973293 244,049614 290,535255 307,073416 318,694826
3 0,25
3. Hasil Uji Penetrasi Patch Propranolol Formula b
Replikasi t(jam) Abs Cn’(ppm) Qt (µg/cm2)
1 0,25
0,5 0,75 1 1,5 2 2,5 3 4 5 6 0,226 0,261 0,318 0,369 0,415 0,487 0,545 0,607 0,686 0,756 0,83 11,2355 13,0666 16,0488 18,7171 21,1238 24,48907 27,9252 31,1689 35,3022 38,9645 42,8361 96,1001229 111,744329 137,222036 160,017879 180,578836 212,761202 238,685887 266,39848 301,709688 332,9981 366,074422
2 0,25
0,5 0,75 1 1,5 2 2,5 3 4 5 6 0,223 0,271 0,322 0,377 0,419 0,493 0,553 0,613 0,691 0,763 0,834 11,0785 13,5898 16,2581 19,1356 21,333 25,2046 28,3438 31,4829 35,5639 39,3307 43,0454 94,759191 116,214102 139,009945 163,593698 182,366745 215,443066 242,261705 269,080344 303,944575 336,126942 367,862331
3 0,25
4. Hasil Uji Penetrasi Patch Propranolol Formula b
Keterangan : Luas Membran 7,065 cm2
Replikasi t(jam) Abs Cn’(ppm) Qt (µg/cm2)
1 0,25
0,5 0,75 1 1,5 2 2,5 3 4 5 6 0,23 0,278 0,335 0,398 0,445 0,494 0,578 0,628 0,698 0,823 0,892 11,4448 13,9561 16,9382 20,2343 22,6933 25,2569 29,6517 32,2678 35,93 42,4698 46,0798 97,8880322 119,342943 144,82065 172,980221 193,988155 215,890044 253,436138 275,785004 307,073416 362,945581 393,787015
2 0,25
0,5 0,75 1 1,5 2 2,5 3 4 5 6 0,235 0,287 0,345 0,408 0,455 0,5 0,587 0,634 0,709 0,831 0,902 11,7063 14,4269 17,4614 20,7575 23,2165 25,5709 30,1226 32,5816 36,5055 42,8884 46,6031 100,122919 123,365739 149,290424 177,449994 198,457928 218,571907 257,458934 278,466868 311,990166 366,521399 398,256788
3 0,25