JOURNAL OF GREEN SCIENCE AND TECHNOLOGY
THE PERFORMANCE ANALYSIS OF IRRIGATION AREA OF
CIBENDUNG WEIR OF BREBES REGENCY
Nur Azis Zain*, Ohan Farhan**
*) Student of Civil Engineering Department Faculty of Engineering Universitas Swadaya Gunung Jati Cirebon **) Lecturer at Civil Engineering Department Faculty of Engineering Universitas Swadaya Gunung Jati Cirebon
ABSTRACT
Cibendung Weir comprised in the district of Banjarharjo Brebes Center Java, the located approximately less than 50 km from Cirebon and 40 km from Brebes Center Java, and exist some villages such as, Cikakak, Karang Maja, Tiwulandu Village in East and Tonjong, Singkup, Gandol in West.
Cibendung Weir have duct the name is Induk Cibendung Weir or named D.I Jangkelok Hilir. At first, the water able to dilute more less 6677ha but in this time only more less 6349ha, the trouble is diversion of the use of land. This Cibendung Weir was built in the years 1901 – 1904. The irrigation areas of Cibendung Weir supply six kemantren such as Kemantren Cibendung, Kemantren Bantarsari, Kemantren Losari Hulu, Kemantren Losari Hilir, Kemantren Kubangjero, and Kemantren Rungkang.
The purpose of this research is become reference from evaluation performance of the irrigation area in Cibendung Weir by analyzing the physical condition of building although duct in the irrigation area of Cibendung Weir, analyzing of human resource in the irrigation area of Cibendung Weir, analyzing of rain Hydrology in the irrigation area of Cibendung Weir, analyzing of income from Bendung Cibendong, analyzing of the patterns plants in the irrigation area of Cibendung Weir, and analyzing planning plant and the realization of planting in the irrigation area of Cibendung Weir.
The method of this research is qualitative method, in which the fission of the problem is explained that subject or the object research based on the facts which used during doing the research in performance of irrigation system and try to make a good relation in deep from the aspects particularly.
Based on the build condition in this irrigation area is classified as satisfactory with percentage of damage reached 11,30%. Meanwhile, the duct condition in this irrigation area Cibendung Weir is good classified with percentage of damage reached 8,21%. The condition of organizer in DI Jangkelok Cibendung Weir only available 51 people, while in needed is 67 people with less percentage reached 17,94% so that service toward the duct condition is less completed and have the impact to net condition which less wake or always damaged, this situation should be increased.From the results of the analysis of the ratio of demand discharge with available discharge added effective rainfall in Irrigation Area Jengkelok,Cibendung Weir fulfilled,but many unused discharge it is necessary to modify cropping pattern in orde to maximize the potential of available discharge. The planting realization in 7 years ago in the irrigation area Jangkelok Cibendung Weir it is less from the planning plant, but in the period of 2011/2012 occurs increased 7,34% and the realization of intensity planting is average 243,77% while the average of planning plan is 268,91% thus the lower plant in productivity in this case since it can’t be done to planting in this wide area.
I. INTRODUCTION
A. BACKGROUND
Indonesia is a country with a tropical climate that has two seasons namely dry and rainy season. In the dry season the amount of water there is certainly not as much as in the rainy season. In the rainy season is the abundant water flow so that floods can occur.
Cibendung Weir comprised in the district of Banjarharjo Brebes Central Java, the located approximately less than 50 km from Cirebon and 40 km from Brebes Center Java, and exist some villages such as, Cikakak, Karang Maja, Tiwulandu Village in East and Tonjong, Singkup, Gandol in West.
Cibendung Weir have duct the name is Induk Cibendung Weir or named D.I Jangkelok Hilir. At first, the water able to dilute more less 6677ha but in this time only more less 6349ha, the trouble is diversion of the use of land. This Cibendung Weir was built in the years 1901 – 1904. The irrigation areas of Cibendung Weir supply six kemantren such as Kemantren Cibendung, Kemantren Bantarsari, Kemantren Losari Hulu, Kemantren Losari Hilir, Kemantren Kubangjero, and Kemantren Rungkang.
Not maximal result of agricultural productivity in Cibendung Weir Irrigation Area is the effect of not maximal intensity of planting in irrigation area, the problem of likelihood caused by decreasing of irrigation network performance in irrigation system. It may also be due to a lack of balance between the available discharge, with the required discharge. Besides the decrease of irrigation network performance also decrease of water quality, damage of facilities and infrastructures consequently irrigation water management is ineffective and efficient, in other words there can be excessive use and use of water in a plot, whereas in other plots experiencing water shortage, On planting productivity..
B. PROBLEM FORMULATION
The effectiveness and efficiency of Irrigation Area of Cibendung Weir System Irrigation System Performance Indicates that the
implementation of the principles of irrigation network performance is not yet optimal. Then it can be identified the problem as follows:
1. How is the performance of Cibendung Weir Irrigation System?
2. Is the available discharge sufficient for the discharge requirement?
3. How is the physical condition and network of Irrigation Area Cibendung Weir?
4. How is The Cropping pattern of Cibendung Weir?
5. How is the institution in Cibendung Weir Irrigation Area?
C. OBJECTIVES OF RESEARCH
The objectives of irrigation system analysis in Cibendung Weir Irrigation Area are:
1. Analyzing the performance of irrigation area systems.
2. Analyze the discharge (availability, reliability, needs).
3. Analyzing the physical condition of buildings and irrigation channels.
4. Analyzing the cropping pattern.
5. Analyzing the institutions in the management of irrigation networks.
D. FRAME THINKING
Figure 1.1
II. REVIEW OF LITERATURE AND BASIC THEORY
A. PREVIOUSLY RESEARCH
1. Evaluasi Kinerja OP Jaringan Irigasi dan
Upaya Perbaikannya (Sumaryanto,
Masdjidin Siregar, Deri Hidayat, M. Suryadi Pusat Analisis Sosial Ekonomi Dan Kebijakan Pertanian Badan Penelitian Dan Pengembangan Pertanian Departemen Pertanian (2006))
2. Evaluasi Operasi Dan Pemeliharaan
Bendung Cangkuang Kecamatan
Babakan Kabupaten Cirebon( Ade Joni
Alfian, 2013 Thesis Universitas Swadaya Gunung Jati Cirebon)
3. Kajian Sistem Jaringan Irigasi Rentang
Pada Saluran Induk Utara Kabupaten
Indramayu ( Budhiono,2011 Thesis
Universitas Swadaya Gunung Jati Cirebon )
B. BASIC THEORY
1. DESCRIPTION OF AREAS
Cibendung Weir is located in the district of Banjarharjo Brebes Java Tegah District, located approximately 50 km from the direction of West Java Cirebon and 40 km from Brebes Central Java, and surrounded by several villages, to the east by the village of Cikakak, Karang Maja, Tiwulandu and West by Tonjong, Singkup, Gandol.
2. ANALYSIS
Analysis is an activity that contains a number of activities such as parsing, differentiating, sorting something to be classified and regrouped according to certain criteria then searched its relation and interpreted its meaning. In another sense, analysis is the attitude or attention to something (things, facts, phenomena) to be able to decompose into parts, and recognize the relationship between these parts in the whole. Analysis can also be interpreted as the ability to solve or deciphering a matter or information into smaller components so that more easily understood..
According to Wiradi argued that : Analisis adalah aktivitas yang memuat sejumlah kegiatan seperti mengurai, membedakan, memilah sesuatu untuk digolongkan dan dikelompokkan kembali menurut kriteria
tertentu kemudian dicari kaitannya dan
ditaksir maknanya.
Thus, from the definition of analyzed analysis, it can be concluded that the analysis is a set of activities and processes. One form of analysis is to summarize large amounts of raw data into information that can be interpreted. All forms of analysis attempt to describe patterns consistently in the data so that the results can be learned and translated in a brief and meaningful way .
3. PERFORMANCE
It is an implementation of the functions that are demanded of a person or a deed done. Performance is a condition that must be known and informed to certain parties to determine the level of achievement of results of an official and in connection with the vision of an organization and to find out positive and negative impact of an operational policy: (Jhon Witmore, Coaching for Performance.1997).
4. IRRIGATION
Irrigation is derived from the term irrigatie in Dutch or irrigation in English. Irrigation can be defined as an effort made to bring water from its source for agricultural purposes, to drain and to share water regularly.
Broadly speaking, the purpose of irrigation can be classified into two (2) categories, namely
:
1.
Direct objective, ie irrigation has a purpose to soil the soil associated with the capacity of water and air content in the soil so as to achieve a condition in accordance with the needs for the growth of plants in the soil.
Table 2.1
.
Assessment Criteria Condition of Channel and Building Function Irrigation
5. IRRIGATION WATER
REQUIREMENT
Irrigation water demand is the amount of water required to fulfill evapotranspiration needs, water loss, water requirement for plants with respect to the amount of water provided by nature and the contribution of ground water.
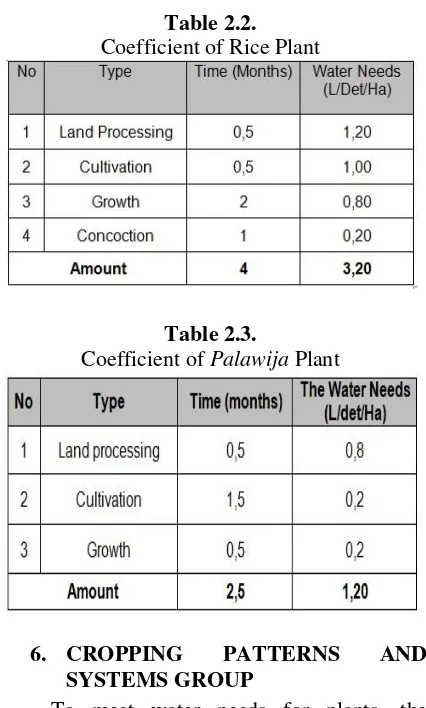
Table 2.2.
Coefficient of Rice Plant
Table 2.3.
Coefficient of Palawija Plant
6. CROPPING PATTERNS AND
SYSTEMS GROUP
To meet water needs for plants, the determination of cropping patterns is a matter to consider. The table below is an
example of a usable cropping pattern. The table below is an example of the planting pattern used:
Table 2.4.
Cropping patterns
7. DISCHARGE
Is a coefficient denoting the amount of water flowing from a time union source, usually measured in units of liters per second, to meet the water requirement of water, the water discharge must be sufficient to be channeled into the prepared channel (Dumiary in a book entitled Ekonomika
Sumber Daya Air).
Water discharge is a measure of the volume of water that can pass in a place or that can be accommodated in a place every single time unit (Suyono in a book entitled
Hidrologi Untuk Pengairan)
8. IRRIGATION EFFICIENCY
Water taken from water sources or rivers flowed into irrigated areas is not all utilized by plants. In irrigation practices there is water loss. The water loss can be evaporation in the irrigation canal, seepage from the channel or other necessities (household).
9. INSTITUTIONAL P3A ON
IRRIGATION NETWORKS
board, the ability to encourage farmer participation in the maintenance of tertiary and quarter networks, the ability to collect and openness in the use of irrigation fees, and skills to prevent / resolve internal conflicts P3A organizations or with other parties.
III. RESEARCH METHOD
A. RESEARCH METHOD
Research methodology is the most important thing in doing a research because it is used to find, develop and test facts / data studied to test the truth.
The methodology itself is a systematic and standard procedure necessary to obtain data and analyze data. Data collection can not be separated from a primary data procurement process, as a very important first step, because in general the data collected is used as a reference in an analysis.(Purwanto,Metodologi
Penelitian Kuantitatif, 2006)
The method used in this research is qualitative method is descriptive - inductive. The descriptive nature of this research is intended to provide a description and explanation of data and information obtained during the research, while the inductive approach based on the process of thinking / observation in the field / empirical facts.
Qualitative method with descriptive-inductive approach, where in solving the problem describes the subject and or object of research based on facts obtained during the research in the performance of irrigation systems and efforts to express the deep relationship of the aspects studied.
B. ANALYSIS METHOD
The method used is as follows :
1. Discharge analysis
Discharge analysis consists of : a. Water availability
The calculation of water availability using Rational Method as an approach method is a way to determine the relationship of river flow with the intensity of rainfall which is the function and physical parameters. The equations used in the Rational Method are as follows:
Q = 3,61 . f. r. A Information:
Q = Water availability (m3/det) F = Flow coefficient
R = R80 = Monthly effective
rainfall (mm/month)
b. Mainstay Discharge
Mainstay Discharge is the minimum river discharge for a prescribed predetermined probability that can be used for irrigation. Monthly river flow data is arranged in descending order for each watering period. Then the rank (rank) 80% mainstay discharge is determined in the following way:
n=10080 x many years of recording
2. Physical Condition Analysis
The analysis in question is an analysis of the physical condition of buildings and channels on an irrigation network. Assessment of physical condition is crucial, because the physical of the water building becomes the main condition of the assessment, if in terms of physical is feasible then the performance of other aspects such as water management management analysis can be done. There are also formulas used in calculating the percentage of physical conditions in irrigation networks are as follows ((Petunjuk Penilaian Kondisi
Jaringan Irigasi, 1991:6)):
Permen PU No. 32/PRT/M/2007 stated
that the performance criteria of irrigation networks are divided into 3 classifications as follows::
Good classification with indicator of irrigation network service function level> 70% - 100%
Medium classification with indicator of irrigation network service function level 55% -70%
Damaged (critical) classification with indicator of irrigation network service function level <55%
3. Irrigation Water Requirement Analysis
Irrigation water demand is the amount of water volume needed to meet evapontranspiration needs, water loss, water requirements for crops by taking into account the amount of water provided by nature through the rain and the contribution of groundwater..
1) Factors Affecting the Needs of Crop Water:
b. Consumptive use c. Percolation and seepage d. Change of water layer e. Effective rainfall.
2) Needs of Water in Fields
Based on planting plan, crop water requirement, and water loss in channel. Water Requirement in Field formulated::
KAS = Plant Area x Coefficient
The water demand coefficient on the channel is as follows:
Tertiary Water Demand Coefficient : 1.25
Secondary Water Demand Coefficient: 1.10
Tertiary Water Demand Coefficient: 1.05
While the Water Loss Factor in the channel is as follows:
Water loss in tertiary : 5% Water loss in secondary :10% Water loss in primary : 25%
3) Cropping Patterns And Systems Group a) Cropping Patterns
To meet the water needs of the plants, the determination of cropping patterns are things that need to be considered.
The table below is an example of a usable cropping pattern.
Table 3.1.
Cropping Patterns
b) Systems Group
To obtain a plant with optimal growth in order to achieve high productivity, the planting should pay attention evenly to the distribution of water to all tertiary plots in irrigation networks. Water
sources can not always provide the required irrigation water, so a good water distribution plan should be established. Available water can be used evenly and fairly. At times when water is not sufficient to meet the needs of water plants with continuous drainage, the water supply is done in rotation. In the dry season where the water situation is critical, the water supply will be given / prioritized to the planned plants. In this rotational watering system, the start of cultivation is not simultaneous, but take turns according to the prescribed schedule, with the intention of using water more efficiently. The rice fields are divided into groups and when the start of the field work takes turns according to each groups.
4. Institutional Analysis and Human
Resources
Referring to the Peraturan Menteri Pekerjaan Umum Nomor : 32 / PRT / M / 2007 Kebutuhan Tenaga Pelaksana
Operasi & Pemeliharaan are as
follows:
Head of branch / observer / UPTD / branch office / korwil: 1 person + 5 staff per 5.000 - 7,500 Ha
Mantri / Juru pengairan : 1 person per
750 - 1,500 Ha
Weir Operations Officer: 1 person per weir, plus some workers for large weir Water Supply Officers: 1 person per 3
- 5 tapping buildings and building for channels spaced between 2 - 3 km or service area 150 to 500 ha
Pekerja/pekarya Saluran (PS) : 1 person
per 2 - 3 km channel length.
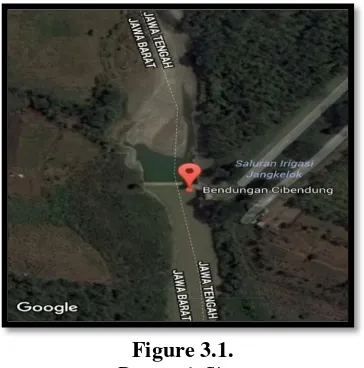
C.RESEARCH LOCATION
The location of the analysis of irrigation systems in the Jangkelok Cibendung Weir Irrigation Area is included in Banjarharjo sub-district, Brebes District, Central Java, located between (S 6058'35.8032 '' and E 108045'39.8736 '') approximately 50 km from the direction of Cirebon west Java and 40 km From Brebes
Availability of Water For
Irrigation
Planting Pattern In One Year
There are quite a lot
of water Rice - Rice - Crops
Available water in sufficient quantities
rice - crops - sugarcane
Areas that tend to
Central Java, and surrounded by several villages, to the east by the villages of Cikakak, Karang Maja, Tiwulandu and west by Tonjong, Singkup, Gandol.
Figure 3.1.
Research Sites
IV. ANALYSIS & DISCUSSION
A. GENERAL DESCRIPTIONS
This Cibendung Weir belongs to Banjarharjo sub-district, Brebes regency of Central Java, located approximately 50 km from Cirebon Jawa Barat and 40 km from Brebes Central Java, and surrounded by several villages, in the east by Cikakak, Karang Maja, Tiwulandu and West by Tonjong, Singkup, Gandol.
Cibendung Weir has the main channel called Bendung Cibendung or in the name of D.I Jangkelok. In early water can irrigate ± 6677 ha but currently only able to irrigate ± 6349 ha, due to the diversion of land use.
B. CONDITION AND FUNCTION OF
IRRIGATION NETWORKS
1. Condition and Function of Irrigation
Building of Cibendung Weir Table 4.1.
Condition and Function Building Irrigation Cibendung Weir
2. Condition and Function of Irrigation
Channel of Cibendung Weir Table 4.2.
Condition and Function of Irrigation Channel of Cibendung Weir
From the results of the above analysis, it can be seen that the condition of buildings and conduits in Irrigation Areas Cibendung Weir slightly damaged, damage to the condition of the building reached an average of 11.30%. And for condition of irrigation channel reaching average 8,21%. Which affects the decreasing function of irrigation networks so that water services in Cibendung Irrigation Area become less optimal. There needs to be repair or replacement of damaged equipment, while for irrigation channel condition need regular maintenance and periodical.
C. ANALYSIS OF HUMAN RESOURCES
good Demage
Minor Sevelery % %
Demage Demage Areal Fungsional
1 Bendung
Banguan pengambil 1 bh 1 0 0 100 0 Baik
Bangunan penguras 1 bh 1 0 0 100 0 Baik
Tubuh bendung 1 bh 1 0 0 100 0 Baik
2 Bangunan Bagi
Bagi 2 bh 1 1 0 50 50 Kurang
Bagi Sadap 7 bh 5 1 1 71.43 28.57 Baik
Sadap 48 bh 43 2 3 89.58 10.42 Baik
3 Bangunan Pelengkap
Talang 3 bh 3 0 0 100 0 Baik
Sypon 4 bh 3 1 0 75 25 Baik
Gorong-gorong 13 bh 13 3 0 100 0 Baik
Jembatan 68 bh 61 6 1 89.71 10.29 Baik
Terjun 20 bh 20 0 0 100 0 Baik
168 bh 152 14 5
88.70 11.30 Baik
Exp. Good
Jumlah
Conditionn
Rata-Rata
No Commentary Volume Denonitation
No. G Md Sd Good Demage
Primer Scondary (Km) (Km) (Km) (Km) (%) (%)
1 Saluran Induk - 4.25 3.12 1.00 0.13 73.51 26.49 Good Jangkelok
2 - Saluran Sekunder 15.75 12.55 - 3.20 79.66 20.34 Good Losari
3 - Saluran Sekunder 1.51 1.41 0.10 - 93.38 6.62 Good Karang Tegah
4 - Saluran Sekunder 4.13 4.01 - 0.13 96.97 3.03 Good Bantarsari
5 - Saluran Sekunder 2.38 2.24 - 0.14 94.32 5.68 Good Jati Sawit
6 - Saluran Sekunder 1.88 1.78 - 0.10 94.68 5.32 Good Luwungbata
7 - Saluran Sekunder 1.80 1.60 0.20 - 88.89 11.11 Good Kubang Jero
8 - Saluran Sekunder 3.20 2.70 - 0.50 84.38 15.63 Good Limbangan
9 - Saluran Sekunder 11.74 11.11 - 0.63 94.63 5.37 Good Rungkang
46.63 40.51 1.30 4.82
91.79 8.21 Sumber : Dinas UPTd Pemali Malahayu Kabupaten Brebes
Amount
Good Average
Chanel Name
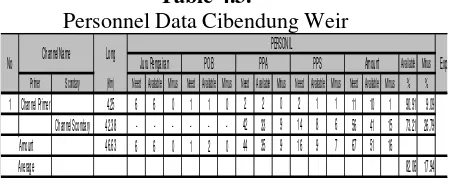
Table 4.3.
Personnel Data Cibendung Weir
From the results of the above analysis it is known that the number of managerial personnel in Cibendung Weir Irrigation Area is only available 51 people, while the required is 67 people with the percentage of shortfall reaches 17.94% so that the service to channel condition is less fulfilled and impact on the condition of less well maintained network or often Damaged, it is necessary to increase the manpower of the relevant Primer Scondary (Km) Need Available Minus Need Available Minus Need Available Minus Need Available Minus Need Available Minus % %
1 Channel Primer 4.25 6 6 0 1 1 0 2 2 0 2 1 1 11 10 1 90.91 9.09
JANUARI PEBRUARI MARET APRIL MEI JUNI JULI AGUSTUS SEPTEMBER OKTOBER NOPEMBER DESEMBER
I II I II I II I II I II I II I II I II I II I II I II I II
2002 4.282 4.091 4.233 4.090 3.850 3.569 3.727 2.573 3.160 1.166 0.957 0.400 0.000 2.025 0.000 0.000 0.000 0.000 0.000 0.000 0.550 0.489 1.802 3.502
2003 3.690 4.298 3.860 3.423 3.617 3.606 2.643 3.172 3.342 2.585 1.478 0.788 0.000 0.000 0.000 0.000 0.000 0.000 0.000 0.000 1.950 1.727 3.795 4.556
2004 5.087 4.776 4.792 4.110 4.346 5.330 4.407 4.717 3.877 4.418 1.287 0.770 1.854 1.745 0.000 0.000 0.000 0.650 0.000 0.000 2.643 3.054 3.177 5.125
2005 4.877 5.021 5.543 10.703 5.687 4.864 4.810 3.989 3.177 3.109 1.383 4.393 3.510 2.276 1.972 0.675 0.000 0.000 0.000 1.417 0.379 0.667 3.173 3.023
2006 4.304 4.693 8.156 5.556 4.157 4.327 3.811 3.454 2.793 2.241 1.823 0.367 0.000 1.023 0.000 0.000 0.000 0.000 0.000 0.000 0.000 2.537 2.767 4.472
2007 4.498 4.559 5.460 2.669 5.977 4.751 5.340 5.000 4.201 3.665 2.923 1.575 1.210 1.407 0.000 0.000 0.000 0.000 0.000 0.000 0.000 1.500 3.728 4.230
2008 4.602 5.092 3.513 2.825 5.420 5.015 4.593 4.145 3.220 2.209 1.075 0.860 0.975 0.000 0.000 0.000 0.550 0.000 1.350 1.273 2.955 2.808 3.375 4.419
2009 5.476 4.503 4.571 4.567 4.635 3.015 4.506 5.886 3.712 3.816 2.830 0.948 1.300 0.922 0.000 0.000 0.000 0.000 0.000 3.075 1.150 1.916 1.797 4.175
2010 5.270 4.321 4.933 4.339 4.286 4.257 3.459 3.970 3.971 3.534 3.089 1.980 1.946 2.036 1.050 1.898 2.485 2.133 2.732 2.462 2.642 2.513 3.386 4.106
2011 4.263 4.362 4.508 4.684 4.854 4.400 3.124 4.633 5.313 4.706 3.900 1.020 2.173 1.562 0.106 0.075 0.000 0.000 0.000 1.677 3.340 3.426 2.981 4.800
2012 4.055 5.108 4.458 4.535 4.738 4.362 4.585 4.337 2.775 2.822 1.600 0.556 1.010 0.000 0.000 0.000 0.000 0.000 0.000 0.000 0.658 1.180 2.242 3.581
2013 4.011 4.850 4.593 7.736 4.888 4.260 4.254 4.300 4.116 4.000 2.841 3.320 3.871 2.403 1.553 0.475 0.000 0.000 0.000 2.600 1.607 3.043 2.230 4.540
2014 4.906 3.320 3.950 4.290 18.209 10.038 4.421 4.614 5.344 4.466 3.112 2.680 2.010 1.500 1.806 0.385 0.000 0.000 0.000 1.513 1.606 0.000 3.733 4.909
2015 4.507 4.913 4.850 4.664 4.816 4.815 4.807 4.800 4.733 3.131 2.320 1.200 0.700 0.877 0.000 0.000 0.000 0.000 0.000 0.000 3.114 0.000 3.133 4.766
2016 4.746 4.753 4.492 4.748 4.700 4.764 4.684 4.807 4.573 4.815 4.557 3.984 4.213 3.020 2.293 2.081 3.214 4.288 3.393 3.571 4.660 4.311 5.023 4.916
Average 4.572 4.577 4.794 4.863 5.612 4.758 4.211 4.293 3.887 3.379 2.345 1.656 1.651 1.386 0.585 0.373 0.417 0.471 0.498 1.173 1.817 1.945 3.089 4.341
Tabel 4.9.
Effective Discharge Data Cibendung Weir
Table 4.10.
Discharge demands of Cibendung weir.
Table 4.11.
Resume of Effective Discharge , Effective Rainfall, Half Monthly Discharge Needs D.I. Jengkelok
Cibendung Weir.
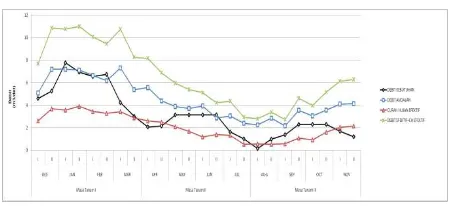
Figure 4.1.
Comparison Chart of Effective Discharge , Effective Rainfall, Half Monthly Discharge
Needs D.I. Jengkelok Cibendung Weir.
From the results of the analysis of the ratio of demand discharge with available discharge plus effective rainfall in Irrigation Area Jengkelok Cibendung Weir fulfilled, but many unused
Padi 2500 0 2500 ha 0 ha Pertumbuhan
Panen
IPalawija 160 2100 1600 160 ha 2100 ha 1600 ha
Palawija
Tebu 185.058 185.058185.058 185.058 ha 185.058 ha
19 19 19 76 Tebu garapan
Jumlah2845.06 2285.058 1785.058
160 240 Tebu Muda
Padi 1500 0 1500 ha 0 ha Tebu Tua
IIPalawija126.563 2000 1521 126.563 ha 2000 ha 1521 ha Padi waku / Bulan
Garap 1
Tebu 185.058 185.058185.058 185.058 ha 185.058 ha Pertb 3
7 7 7 28 30 Panen1/2
Jumlah1811.62 2185.058 1706.058 60 90
Plw waku / Bulan
Padi 1363.16 0 1363.161 ha 0 ha Tanam3
IIIPalawija 100 1650 1000 100 ha 1650 ha 1000 Tebu waku / Bulan
Garap 2
Tebu 185.058 185.058185.058 185.058 ha 185.058 ha T.Muda7
30 30 30 T.Tua 7
Jumlah1648.22 1835.058 1185.058
Jumlah6304.9 6305.174 4676.174 #VALUE! Tgl 15 Nop s/d 30 Nop
Program pengeringan
II. BAGAN RENCANA PEMBAGIAN AIR.
1.2 1 0.8 0.8 0.8 0.8 0.2 0.2 1.2 1 0.8 0.8 0.8 0.8 0.2 0.2 1.2 1 0.8 0.8 0.8 0.8 0.2 0.2 1.2 1 0.8 0.8 0.8 0.8 0.2 0.2 Satuan Kebutuhan 1.2 1 0.8 0.8 0.8 0.8 0.2 0.2 1.2 1 0.8 0.8 0.8 0.8 0.2 0.2
0.36 0.36 0.36 0.36 0.36 0.36 0.36 0.36 0.36 0.36 0.36 0.36 0.36 0.36 0.36 0.36 0.36 0.36 0.36 0.36 0.36 0.36 0.36 0.36 Air ( SKA )
0.365 0.3650.3650.3650.3650.365 0.3650.365 0.3650.3650.365 0.3650.3650.3650.3650.3650.365 0.3650.3650.3650.3650.365 0.3650.365 Kebutuhan Air 3000 3400 5135.793 4563.161 4290.529 4290.529 2790.529 1890.529572.6322 272.6322 0 0 0 0 0 0 0 0 0 0 0 0 0 0 Di Sawah ( KAS ) 80.38134 139.1627 139.1627 139.1627 139.1627 63.56268 36 0 756 1116 2070 2070 2070 2070 1017 594 0 576849.781483.561483.561483.561483.56727.56 SKA X AREAL 67.54617 67.54617 67.54617 67.54617 67.54617 67.54617 67.54617 67.5461767.54617 67.54617 67.54617 67.54617 67.54617 67.54617 67.54617 67.54617 67.54617 67.54617 67.54617 67.54617 67.54617 67.54617 67.54617 67.54617 3147.92751 3606.709 5342.5024769.87 4497.238 4421.638 2894.075 1958.075 1396.1784 1456.178 2137.546 2137.546 2137.546 2137.546 1084.546 661.5462 67.54617 643.5462 917.3262 1551.106 1551.106 1551.106 1551.106 795.1062 a.Kebutuhan Air Tersier 1.25 3934.909388 4508.386 6678.128 5962.337 5621.547 5527.047 3617.594 2447.5941745.223 1820.223 2671.933 2671.933 2671.933 2671.933 1355.683 826.9327 84.43271 804.4327 1146.658 1938.883 1938.883 1938.883 1938.883 993.8827 b.Kebutuhan air Sekunder 1.1 4328.400326 4959.2257345.94 6558.571 6183.702 6079.752 3979.353 2692.353 1919.7453 2002.245 2939.126 2939.126 2939.126 2939.126 1491.251909.626 92.87598884.876 1261.323 2132.771 2132.771 2132.771 1706.217 1093.271 c.Kebutuhan Air Primer 1.05 4544.820343 5207.186 7713.2376886.5 6492.887 6687.727 4178.321 2961.588 2015.7325 2102.358 3086.082 3086.082 3086.082 3086.082 1565.814 955.1073 97.51978 929.11981324.392239.412239.412239.41 1628.661 1147.935
d.Jumlah Kebutuhan Tanaman l/dt 4544.820343 5207.186 7713.2376886.5 6492.887 6687.727 4178.321 2961.588 2015.7325 2102.358 3086.082 3086.082 3086.082 3086.082 1565.814 955.1073 97.51978 929.11981324.392239.412239.412239.41 1628.661 1147.935
e.Kebutuhan Pabrik l/dt 0 0 0 0 0 0 0 0 0 0 0 0 0 0 0 0 0 0 0 0 0 0 0 0 f.Kebutuhan Lain lain l/dt 50 50 50 50 50 50 50 50 50 50 50 50 50 50 50 50 50 50 50 50 50 50 50 50
g.Jumlah Kebutuhan ( d+e+F ) l/dt 4,595 5,257 7,763 6,936 6,543 6,738 4,228 3,012 2,066 2,152 3,136 3,136 3,136 3,136 1,616 1,005 148 979 1,374 2,289 2,289 2,289 1,679 1,198 Feb-16 Mar-16 Apr-16
Masa Tanam Masa Tanam I Masa Tanam II Masa Tanam III
Jumlah
Padi 2500 2300 2500 ha 2300 ha Pertumbuhan Panen
IPalawija 400 200 2800 400 ha 200 ha 2800 ha
Palawija
Tebu 0 0 0 0 ha 0 ha
19 19 19 76 Tebu garapan
Jumlah29002500 2800
160 240 Tebu Muda
Padi 1400 1300 1400 ha 1300 ha Tebu Tua
IIPalawija 300 150 1600 300 ha 150 ha 1600 ha Padi waku / Bulan Garap1
Tebu 0 0 0 0 ha 0 ha Pertb3
7 7 7 28 30 Panen1/2
Jumlah17001450 1600 60 90
Plw waku / Bulan
Padi 1263.16 1000 1263.161 ha 1000 ha Tanam3
IIIPalawija 200 100 1400 200 ha 100 ha 1400 Tebu waku / Bulan Garap2
Tebu 0 0 0 0 ha 0 ha T.Muda7
30 30 30 T.Tua7
Jumlah1463.161100 1400
Jumlah6063.16 5050 5800 #VALUE! Tgl 15 okt s/d 30 Nop Program pengeringan
II. BAGAN RENCANA PEMBAGIAN AIR.
1.2 1 0.8 0.8 0.8 0.8 0.2 0.2 1.2 1 0.8 0.8 0.8 0.8 0.2 0.2 1.2 1 0.8 0.8 0.8 0.8 0.2 0.2 1.2 1 0.8 0.8 0.8 0.8 0.2 0.2 Satuan Kebutuhan 1.2 1 0.8 0.8 0.8 0.8 0.2 0.2 1.2 1 0.8 0.8 0.8 0.8 0.2 0.2
0.36 0.36 0.360.36 0.36 0.36 0.36 0.36 0.36 0.36 0.36 0.36 0.36 0.36 0.36 0.36 0.36 0.36 0.36 0.360.36 0.36 0.36 0.36 Air ( SKA )
0.3650.3650.3650.3650.3650.3650.3650.365 0.3650.3650.3650.3650.3650.3650.3650.3650.3650.3650.3650.3650.3650.3650.3650.365 Kebutuhan Air 3000 3340 4915.793 4383.161 4130.529 4130.529 2630.529 1790.529 3292.6322 4112.632 4340 38803680 3680 2300 1520 460 200 0 0 0 0 0 0 Di Sawah ( KAS ) 198 324 324 324 324 144 72 0 72 99 162 162 162 162 72 36 0 1008 1296 2088 2088 2088 2088 828 SKA X AREAL 0 0 0 0 0 0 0 0 0 0 0 0 0 0 0 0 0 0 0 0 0 0 0 0 3198 3664 5239.793 4707.161 4454.529 4274.529 2702.529 1790.529 3364.6322 4211.632 4502 40423842 3842 2372 1556 460 1208 1296 2088 2088 2088 2088 828 a.Kebutuhan Air Tersier 1.25 3997.54580 6549.742 5883.951 5568.161 5343.161 3378.161 2238.161 4205.79035264.545627.55052.54802.54802.52965 1945 575 1510 1620 2610 2610 2610 2610 1035 b.Kebutuhan air Sekunder 1.1 4397.25 5038 7204.716 6472.346 6124.977 5877.477 3715.977 2461.977 4626.3693 5790.9946190.255557.755282.755282.753261.52139.5632.51661 1782 2871 2871 28712296.81138.5 c.Kebutuhan Air Primer 1.05 4617.11255289.9 7564.951 6795.964 6431.226 6465.225 3901.776 2708.175 4857.6877 6080.544 6499.763 5835.638 5546.888 5546.888 3424.575 2246.475664.1251744.051871.13014.553014.553014.552192.4 1195.425
d.Jumlah Kebutuhan Tanaman l/dt 4617.11255289.9 7564.951 6795.964 6431.226 6465.225 3901.776 2708.175 4857.6877 6080.544 6499.763 5835.638 5546.888 5546.888 3424.575 2246.475664.1251744.051871.13014.553014.553014.552192.4 1195.425
e.Kebutuhan Pabrik l/dt 0 0 0 0 0 0 0 0 0 0 0 0 0 0 0 0 0 0 0 0 0 0 0 0 f.Kebutuhan Lain lain l/dt 50 50 50 50 50 50 50 50 50 50 50 50 50 50 50 50 50 50 50 50 50 50 50 50
g.Jumlah Kebutuhan ( d+e+F ) l/dt 4,667 5,340 7,615 6,846 6,481 6,515 3,952 2,758 4,908 6,131 6,550 5,886 5,597 5,597 3,475 2,296 714 1,794 1,921 3,065 3,065 3,065 2,242 1,245 Jan Feb Mar
Masa Tanam Masa Tanam I Masa Tanam II Masa Tanam III
Figure 4.2.
Chart of Additional Cropping Patterns Between Effective Discharge, Effective Rainfall, Half
Monthly Discharge demands D.I. Jengkelok Cibendung Weir.
From the analysis result using Planting pattern Modification to the comparison of debit requirement with Effective discharge added effective rainfall in Irrigation Area of Jengkelok Cibendung Weir fulfilled, and the use of available discharge is more maximal by using cropping pattern using Padi-Padi-Palawija and the future of planting one on November.
F. ANALYSIS PLANTING PLAN AND
REALIZATION OF PLANTING Table 4.14.
Planting Plans in Irrigation Area of Cibendung Weir
Table 4.15.
Realization of Planting in Cijangkelok Irrigation Area Cibendung Weir
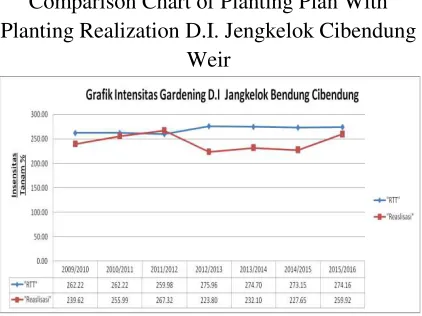
Figure 4.3.
Comparison Chart of Planting Plan With Planting Realization D.I. Jengkelok Cibendung
Weir
From the above data it can be seen that the realization of planting last 7 (seven) years in Jengkelok Cibendung Weir Irrigation Area is less than the cropping patterns plan, but in the period of 2011/2012 there was an increase of the plan of 7.34% and the intensity of the realization of planting an average of 243 , 77% while planting plan average 268,91% thereby decreasing the productivity of this plant because planting can not be done as wide as existing area.
V. CONCLUSION AND
RECOMMENDATION
A. CONCLUSION
Based on the results of the analysis and discussion, obtained some conclusions as follows:
1. The condition and function of buildings in Irrigation Area Jangkelok Cibendung weir is in good classification, with average percentage of good reaching 88.70% While the classification of broken with an average of 11.30%. 2. Conditions and functions of the channel
in the Irrigation Area Jangkelok Cibendung weir is in good classification, with average percentage of both reached 91.79% While the classification of broken with an average of 8.21%.
3.
Manpower in Irrigation Area Cibendung Weir only available 51 people, while the required is 67 people with the percentage of shortfall reaches 17.94% so that the service to channel condition is less fulfilled and impact on the condition of network less well-maintained or often damaged, it isWide Areal Averaged
sum sum Intensitas
Padi Tebu Plw jml Padi Tebu Plw jml Padi Tebu Plw jml Padi Tebu Plw Gardening Gardening(%)
2009/2010 6328.75 5610.29 604.46 114.00 6328.75 0.00 604.46 5039.69 5644.15 0.00 604.46 4018.00 4622.46 5610.29 1813.38 9171.69 16595.36 262.22
2010/2011 6328.75 5610.29 604.46 114.00 6328.75 0.00 604.46 5039.69 5644.15 0.00 604.46 4018.00 4622.46 5610.29 1813.38 9171.69 16595.36 262.22
2011/2012 6328.75 5433.85 522.96 391.41 6348.22 0.00 522.96 5040.45 5563.41 0.00 522.96 4018.65 4541.61 5433.85 1568.88 9450.51 16453.24 259.98
2012/2013 6328.75 5433.85 522.96 391.41 6348.22 0.00 522.96 5806.61 6329.57 0.00 522.96 4263.91 4786.87 5433.85 1568.88 10461.93 17464.66 275.96
2013/2014 6328.75 5420.80 550.56 387.87 6359.23 0.00 550.56 5768.43 6318.99 0.00 550.56 4156.54 4707.10 5420.80 1651.68 10312.84 17385.32 274.70
2014/2015 6279.77 5348.83 539.48 391.46 6279.77 0.00 539.48 5680.29 6219.77 0.00 539.48 4114.00 4653.48 5348.83 1618.44 10185.75 17153.01 273.15
2015/2016 6305.35 5363.62 555.17 386.59 6305.38 0.00 555.17 5750.18 6305.35 0.00 555.17 4121.09 4676.26 5363.62 1665.52 10257.86 17286.99 274.16
Sum Averaged 6318.41 5460.22 557.15 310.96 6328.33 0.00 557.15 5446.48 6003.63 0.00 557.15 4101.45 4658.60 5460.22 1671.45 9858.90 16990.56 268.91 Season Gardening
plan (Ha)
(Ha) MT.I MT.II MT.III
wide Areal Averaged
sum sum Intensitas Padi Tebu Plw jml Padi Tebu Plw jml Padi Tebu Plw jml Padi Tebu Plw Gardening Gardening(%) 2009/2010 6328.75 5022.00 598.00 472.00 6092.00 1073.00 598.00 3565.00 5236.00 0.00 600.00 3237.00 3837.00 6095.00 1796.00 7274.00 15165.00 239.62
2010/2011 6328.75 4800.00 523.00 379.00 5702.00 1690.00 523.00 3207.00 5420.00 0.00 523.00 4556.00 5079.00 6490.00 1569.00 8142.00 16201.00 255.99
2011/2012 6328.75 5372.00 512.00 406.00 6290.00 1688.00 512.00 3380.00 5580.00 0.00 512.00 4536.00 5048.00 7060.00 1536.00 8322.00 16918.00 267.32
2012/2013 6328.75 5271.00 570.00 449.00 6290.00 523.00 570.00 2164.00 3257.00 0.00 570.00 4047.00 4617.00 5794.00 1710.00 6660.00 14164.00 223.80
2013/2014 6328.75 5177.00 514.00 470.00 6161.00 1200.00 514.00 2155.00 3869.00 0.00 514.00 4145.00 4659.00 6377.00 1542.00 6770.00 14689.00 232.10
2014/2015 6279.77 5150.00 549.00 508.00 6207.00 1779.00 514.00 2098.00 4391.00 0.00 514.00 3184.00 3698.00 6929.00 1577.00 5790.00 14296.00 227.65
2015/2016 6305.35 5200.00 514.00 655.00 6369.00 2520.00 514.00 2168.00 5202.00 0.00 514.00 4304.00 4818.00 7720.00 1542.00 7127.00 16389.00 259.92
Sum Averaged 6318.41 5141.71 540.00 477.00 6158.71 1496.14 535.00 2676.71 4707.86 0.00 535.29 4001.29 4536.57 6637.86 1610.29 7155.00 15403.14 243.77 Realisasi (Ha)
(Ha) MT.I MT.II MT.III
necessary The addition of manpower if the relevant agencies.
4. Cropping pattern in use in Irrigation Area Jangkelok Cibendung weir is Padi - Palawija - palawija.
5. From the results of the analysis of the ratio of demand discharge with available debit added effective rainfall in Irrigation Area Jengkelok Cibendung weir met, but many unused discharge this is necessary to modify the cropping pattern in order to maximize the potential of available discharge.
6. From the results of the analysis using Modified Cropping pattern of the ratio of debit demand to the debit Effective added effective rainfall in the Irrigation Area Jengkelok Bendung Cibendung fulfilled, and use of available debit more leverage by using the cropping pattern using Padi-Padi-Palawija and start the planting period One in November.
7. Seen from the potential of available discharge and rainfall in Cibendung Weir, cropping pattern can use Padi-Padi-Padi / Palawija but the use of land area will decrease.
8. The last 7 (seven) years irrigation arean Jengkelok Cibendung Weir Planting realization is less than Planting plan, but in the period of 2011/2012 there was an increase of 7.34% plan and the realization intensity of planting an average of 243,77% while the planting plan Averaging 268.91% thus reducing the productivity of this plant because planting can not be done as wide as the existing area.
B. RECOMMENDATION
Based on the results of the analysis and discussion, it is recommended that the following :
1. To collect data on the relevant Official either the debit data, rainfall, planting plan, the realization of planting, the condition of the building and the channel and the number of human resources should be stored in softcopy form in order to facilitate the search if it will
need, also minimize the loss and destruction.
2. For irrigation water services at Jangkelok irrigation area Cibendung weir optimal (effectiveness and efficiency), should be strived for normalization (Improvement, Rehabilitation, Maintenance and Care) of irrigation networks (Channels and irrigation buildings) this should be done routinely to minimize the damage Which will occur both on buildings and irrigation channels. 3. For the implementation of Operation and
Maintenance in Jangkelok Irrigation Area Cibendung dam in accordance with the guidance of operation and maintenance and governance of irrigation and irrigation water network arrangement effective and efficient (timely, appropriate space, precise guarantee and quality) then the quantity of Human Resources need In accordance with the needs and quality of Human Resources needs to be improved through strengthening institutions, education and technical training fields to irrigation. 4. It is necessary to socialize from related
parties to the farmers about the planting system that will be applied every year so that the plant intensity reaches the maximum (300%), and the farmers know what pattern will be used.
BIBLIOGRAPHY
Anonym. 1991. Petunjuk Penilaian Kondisi
Jaringan Irigasi. Direktorat Jendral
Pengairan Departemen Pekerjaan Umum.
Anwar. 2011. “Operasi & Pemeliharaan
Irigasi”. PT Alfabeta.
Budhiono, R.M. 2011. ”Kajian Sistem Jaringan Irigasi Rentang pada Saluran
Induk Utara Kabupaten Indramayu”.
(Thesis) Universitas Swadaya Gunung Jati Cirebon.
Brebes. (Thesis) Universitas Swadaya Gunung Jati Cirebon.
Joni Alfian, Ade. 2010. Evaluasi Operasidan
Pemeliharaan Bendung Cangkuang
Kecamatan Babakan Kabupaten
Cirebon. (Thesis) Universitas Swadaya
Gunung Jati Cirebon.
Mangku negara, ap. 2000. Evaluasi Kinerja SDM. Jakarta.
Mawardi, E dan Memed M. 2002. Desain
Hidraulik Bendung Tetap. Bandung:
Alfabeta.
Murtiningrum. 2007. Analisis Keseragaman
Pemberian Air.
Pedoman Penulisan Skripsi. Universitas
Swadaya Gunung Jati. Cirebon. 2016.
Peraturan Menteri Pekerjaan Umum Nomor 32 /M/PRT/ Tahun 2007 tentang Operasi dan Pemeliharaan Jaringan Irigasi
Peraturan Menteri PU Permen PU.No.32 /PRT/M/2007, tentang Pedoman Operasi dan Pemeliharaan Jaringan Irigasi.
Purwanto. 2006. Metodologi Penelitian
Kuantitatif. Jakarta: Gaung Persada
Press.
Pusposutardji. 1985. Dampak Lingkungan
Terhadap Irigasi.
Sidharta. 1997. Irigasi dan Bangunan Air.
Sudjarwadi. 1979. Pengantar Teknik Irigasi. Jakarta.
Sumaryanto cs. 2006. Evaluas iOperasi dan
Pemeliharaan Jaringan Irigasidan
Upaya Perbaikannya. Pusat Analisis
Sosial Ekonomi dan Kebijakan Pertanian Badan Penelitian dan Pengembangan Pertanian Departemen Pertanian.
Suyono, Kensaku Takeda. 1976. Hidrologi
untuk Pengairan. PT. Pradnya Paramita.
Jakarta.
Syarif. 2002. Analisis Dampak O & P pasa
Objek Irigasi. Jakarta.
Wahyudi. 1987. Definisi Irigasi. Institut Pertanian Bogor.
Witmore, John. 1997. Coaching for Performance. University of California.
Zalfa Khaerunissa, Darin. 2014. Analisis Kinerja Sistem Daerah Bendung Ambit
Kabupaten Cirebon. (Thesis)
Universitas Swadaya Gunung Jati Cirebon.
http://www.sarjanaku.com/2012pengertian-sistem-menurut paraahli.html (Accessed on 1-03-2017)
http://pengertianbahasa.blogspot.com/2013/0 2/pengertian-analisis.html (Accessed on
1-03-2017)
http://www.anneahira.com/pengertian-analisis.html (Accessed on 4-03-2017)