123
Michal Hodoň
Gerald Eichler
Christian Erfurth
Günter Fahrnberger (Eds.)
18th International Conference, I4CS 2018
Žilina, Slovakia, June 18–20, 2018
Proceedings
Innovations for
Communications
in Computer and Information Science
863
Commenced Publication in 2007 Founding and Former Series Editors:
Alfredo Cuzzocrea, Xiaoyong Du, Orhun Kara, Ting Liu, DominikŚlęzak, and Xiaokang Yang
Editorial Board
Simone Diniz Junqueira Barbosa
Pontifical Catholic University of Rio de Janeiro (PUC-Rio), Rio de Janeiro, Brazil
Phoebe Chen
La Trobe University, Melbourne, Australia Joaquim Filipe
Polytechnic Institute of Setúbal, Setúbal, Portugal Igor Kotenko
St. Petersburg Institute for Informatics and Automation of the Russian Academy of Sciences, St. Petersburg, Russia
Krishna M. Sivalingam
Indian Institute of Technology Madras, Chennai, India Takashi Washio
Osaka University, Osaka, Japan Junsong Yuan
University at Buffalo, The State University of New York, Buffalo, USA Lizhu Zhou
Michal Hodoň
•Gerald Eichler
Christian Erfurth
•G
ü
nter Fahrnberger (Eds.)
Innovations for
Community Services
18th International Conference, I4CS 2018
Žilina, Slovakia, June 18
–
20, 2018
Proceedings
University ofŽilina Žilina
Slovakia Gerald Eichler
Telekom Innovation Laboratories Deutsche Telekom AG
Darmstadt, Hessen Germany
EAH Jena Jena Germany
Günter Fahrnberger University of Hagen Hagen
Germany
ISSN 1865-0929 ISSN 1865-0937 (electronic) Communications in Computer and Information Science
ISBN 978-3-319-93407-5 ISBN 978-3-319-93408-2 (eBook) https://doi.org/10.1007/978-3-319-93408-2
Library of Congress Control Number: Applied for
©Springer International Publishing AG, part of Springer Nature 2018
This work is subject to copyright. All rights are reserved by the Publisher, whether the whole or part of the material is concerned, specifically the rights of translation, reprinting, reuse of illustrations, recitation, broadcasting, reproduction on microfilms or in any other physical way, and transmission or information storage and retrieval, electronic adaptation, computer software, or by similar or dissimilar methodology now known or hereafter developed.
The use of general descriptive names, registered names, trademarks, service marks, etc. in this publication does not imply, even in the absence of a specific statement, that such names are exempt from the relevant protective laws and regulations and therefore free for general use.
The publisher, the authors and the editors are safe to assume that the advice and information in this book are believed to be true and accurate at the date of publication. Neither the publisher nor the authors or the editors give a warranty, express or implied, with respect to the material contained herein or for any errors or omissions that may have been made. The publisher remains neutral with regard to jurisdictional claims in published maps and institutional affiliations.
Printed on acid-free paper
This Springer imprint is published by the registered company Springer International Publishing AG part of Springer Nature.
Foreword
The International Conference on Innovations for Community Services (I4CS) had its 18th edition 2018. It had emerged as the Workshop on Innovative Internet Community Systems (I2CS) in 2001, founded by Herwig Unger and Thomas Böhme, and continued its success story under its revised name I4CS in 2014. We are proud to have reached again the original number of scientific presentations, combined with a great social conference program.
The selection of conference locations reflects the conference concept: Our members of the Technical Program Committee (TPC) can offer suitable locations. In 2018, the Steering Committee had the honor of handing the organization responsibility over to Michal Hodoňand, therefore, of determining a Slovakian venue for thefirst time in the history of the conference. The University ofŽilina was a remarkable place for offering a perfect climate to make the motto“Relaxation Teams Communities”happen.
I2CS published itsfirst proceedings in Springer series Lecture Notes in Computer Science series (LNCS) until 2005, followed by the Gesellschaft für Informatik (GI), and Verein Deutscher Ingenieure (VDI). I4CS commenced with the Institute of Elec-trical and Electronics Engineers (IEEE) before switching back to Springer’s Commu-nications in Computer and Information Science (CCIS) in 2016. With 1,473 chapter downloads from SpingerLink for CCIS Vol. 717, publishing the I4CS proceedings of 2017, we envisaged an increasing result. I4CS has maintained its reputation as a high-class C-conference at the CORE conference portal http://portal.core.edu.au/conf-ranks/?search=I4CS&by=all.
The proceedings of I4CS 2018 comprisefive parts that cover the selection of 14 full and three short papers out of 38 submissions. Interdisciplinary thinking is a key success factor for any community. Hence, the proceedings of I4CS 2018 span a range of topics, bundled into three areas:“Technology,” “Applications,”and “Socialization.”
Technology: Distributed Architectures and Frameworks
• Data architectures and models for community services
• Innovation management and management of community systems • Community self-organization in ad-hoc environments
• Search, information retrieval, and distributed ontologies • Common data models and big data analytics
Applications: Communities on the Move
• Social networks and open collaboration
Socialization: Ambient Work and Living
• eHealth challenges and ambient-assisted living • Intelligent transport systems and connected vehicles • Smart energy and home control
• Digitalization and cyber-physical systems • Security, identity, and privacy protection
Many thanks to the 19 members of the TPC representing 12 countries for their valuable reviews, especially the chair, Christian Erfurth and, secondly, to the publi-cation chair, Günter Fahrnberger, who fostered a fruitful cooperation with Springer.
The 19th I4CS will be organized by the Ostfalia University of Applied Sciences and will take place in Wolfsburg/Germany in June 2019. Please check the permanent conference URL http://www.i4cs-conference.org/ for more details. Applications of prospective TPC members and potential conference hosts are welcome at [email protected].
Preface
Žilina is the natural center of northwestern Slovakia, which ranks among the largest and most important cities in Slovakia. It is located in the valley of the Váh River, surrounded by the beautiful mountain ranges of MaláFatra, Strážovskévrchy, Súovské vrchy, Javorníky, and Kysuckávrchovina. The National Park of MaláFatra comprises famous gorges, rock peaks, and an attractive ridge tour. The main subject of protection is the territory with varied geological history and dissected relief forms, rare and precious biocenoses, flora and fauna, and the exceptional value of the forest and mountain compounds with precious dwarf pinewoods, and rapacious animals, such as the wolf, lynx, or bear.
Žilina is a center of significant political, cultural, sport, and public health-care institutions. Its economic potential can be proven by the fact thatŽilina has the second highest number of traders per thousand inhabitants. As for the number of joint stock companies and limited companies,Žilina holds third position in Slovakia. Nowadays, the city ofŽilina represents a dynamic development accelerated by KIA Motors Slo-vakia investments. However, the city is not only a center of car production, but together with the Upper Váh River Region (Horné Považie) it is an interesting tourist desti-nation. The city ofŽilina is a center of theaters, museums, galleries, parks, and sports facilities. Its historical center is crossed by one of the longest and the most beautiful pedestrian zones in Slovakia.
The University of Žilina was founded in 1953 by separating from the Czech Technical University in Prague, followed by its renaming to the University of Trans-port and Communications. Later in 1996, after broadening its fields of interest and other organizational changes, it was renamed as the University ofŽilina. In its over 60 years of successful existence, it has become the alma mater for more than 70,000 graduates, highly skilled professionals mostly specializing in transport and technical fields as well as in management, marketing, or humanities. The quality and readiness of the graduates for the needs of practice is proved by long-term high interest in hiring them by employers that cooperate with the university in the recruitment process.
A stopover in the MaláFatra Mountains offers unforgettable experiences enhanced through the selected venue of the Village Resort Hanuliak as a unique wellness resort located in the beautiful environment of the MaláFatra National Park. The picturesque village of Beláis located only 20 km away from the city of Žilina.
We hope that all attendees enjoy the fruitful, friendly, and relaxed atmosphere during the conference. We trust they will gather professional experiences and be happy to come back in the future.
Program Committee
Marwane Ayaida University of Reims Champagne-Ardenne, France Gilbert Babin HEC Montréal, Canada
Gerald Eichler Deutsche Telekom AG, Germany
Christian Erfurth Jena University of Applied Sciences, Germany Günter Fahrnberger University of Hagen, Germany
Hacène Fouchal University of Reims Champagne-Ardenne, France Sapna Gopinathan Coimbatore Institute of Technology, India Michal Hodoň University ofŽilina, Slovakia
Peter Kropf University of Neuchâtel, Switzerland Ulrike Lechner Bundeswehr University Munich, Germany Karl-Heinz Lüke Ostfalia University of Applied Sciences, Germany Phayung Meesad King Mongkut’s University of Technology North
Bangkok, Thailand
Raja Natarajan Tata Institute of Fundamental Research, India Frank Phillipson TNO, The Netherlands
Srinivan Ramaswamy ABB, USA
Joerg Roth Nuremberg Institute of Technology, Germany Maleerat Sodanil King Mongkut’s University of Technology North
Bangkok, Thailand Leendert
W. M. Wienhofen
City of Trondheim, Norway
Contents
Architectures and Management
Microservice Architecture Within In-House Infrastructures for Enterprise
Integration and Measurement: An Experience Report . . . 3 Sebastian Apel, Florian Hertrampf, and Steffen Späthe
Multi-agent Architecture of a MIBES for Smart Energy Management . . . 18 Jérémie Bosom, Anna Scius-Bertrand, HaïTran, and Marc Bui
A C-ITS Central Station as a Communication Manager . . . 33 Geoffrey Wilhelm, Hacène Fouchal, Kevin Thomas,
and Marwane Ayaida
Data Analytics and Models
Dynamic Social Network Analysis Using Author-Topic Model . . . 47 Kim Thoa Ho, Quang Vu Bui, and Marc Bui
Concept of Temporal Data Retrieval Undefined Value Management . . . 63 Michal Kvet and Karol Matiasko
New Method for Selecting Exemplars Application
to Roadway Experimentation . . . 75 Emilien Bourdy, Kandaraj Piamrat, Michel Herbin,
and Hacène Fouchal
Temporal Flower Index Eliminating Impact of High Water Mark . . . 85 Michal Kvet and Karol Matiasko
Acoustic Signal Analysis for Use in Compressed Sensing Application . . . 99 Veronika Olešnaníková, Ondrej Karpiš, Lukáš Čechovič,
and Judith Molka-Danielsen
Community and Public Collaboration
Applying Recommender Approaches to the Real Estate
e-Commerce Market . . . 111 Julian Knoll, Rainer Groß, Axel Schwanke, Bernhard Rinn,
and Martin Schreyer
Experimenting a Digital Collaborative Platform for Supporting Social
Innovation in Multiple Settings . . . 142 Thomas Vilarinho, Ilias O. Pappas, Simone Mora, Inès Dinant,
Jacqueline Floch, Manuel Oliveira, and Letizia Jaccheri
Innovations and Digital Transformation
Innovation Management Methods in the Aviation Industry . . . 161 Karl-Heinz Lüke, Johannes Walther, and Daniel Wäldchen
Digital Transformation in Companies–Challenges and Success Factors . . . . 178 Marcus Wolf, Arlett Semm, and Christian Erfurth
Smart Mirror Devices: For Smart Home and Business . . . 194 Sven Von Hollen and Benjamin Reeh
Short Papers: Security and Systems
Secured Domain of Sensor Nodes - A New Concept . . . 207 Janusz Furtak, Zbigniew Zieliński, and Jan Chudzikiewicz
Trends in Application of Machine Learning to Network-Based
Intrusion Detection Systems . . . 218 Jakub Hrabovsky, Pavel Segec, Marek Moravcik, and Jozef Papan
Acoustic Signal Classification Algorithm for WSN Node
in Transport System . . . 229 RóbertŽalman, Michal Chovanec, Martin Revák, and Ján Kapitulík
In-House Infrastructures for Enterprise
Integration and Measurement:
An Experience Report
Sebastian Apel(B), Florian Hertrampf, and Steffen Sp¨athe
Friedrich Schiller University Jena, 07743 Jena, Germany {sebastian.apel,florian.hertrampf,steffen.spaethe}@uni-jena.de
Abstract. The project WINNER aims to integrate and coordinate electromobility used through carsharing, the energy consumption of tenant households and the local production of electricity, e.g., by integrating photovoltaic systems into a smart local energy grid. While the various components correspond to the currently available standards, the integration has to be realised via a data processing and storage platform, the WINNER DataLab. The goal of this platform is to provide forecasts and optimisation plans to operate the WINNER setup as efficiently as possible. Each data processing component is encapsulated as a single service. We decided to use a microservice architecture and further an execution environment like container instances within a cloud infrastructure. This paper outlines the realisation as well as a report of our experiences while realising this project related microservice architecture. These experiences focus on development complexity, modifiability, testability, maintainability and scalability as well as dependencies and related lessons learned. Finally, we state, that the practical application of setups like this helps to concentrate on business models. It supports decoupling, helps in development to focus on the essential things and increases efficiency in operation, not least through good opportunities for scaling. However, it is required to mastering the complexity which currently requires clean planning, experience and a coordinated development process.
Keywords: Smart grid
·
Internet of things·
Microservice architecture Experience report·
Measurement infrastructure1
Introduction
Imagine a modern urban area with tenant households. Photovoltaic systems produce electricity; each flat knows when electricity is available. So, scheduling of consumers is possible as well as the management of electric cars that are charged when electricity is available. In contrast, electricity is offered when the
c
4 S. Apel et al.
car will not be used soon. The implementation of such smart grids, especially its network of actors and sensors, which is known as the internet of things (IoT), is a complex task [26]. IoT is stated as the next big step in internet technology [14], and there is a large number of different and heterogeneous devices to handle [26]. One way to address this integration and measurement task are microservice architectures and cloud computing infrastructures.
Our research project “Wohnungswirtschaftlich integrierte netzneutrale Elektromobilitat in Quartier und Region” WINNER [13] aims to integrate and coordinate electromobility used through carsharing, the energy consumption of tenant households and the local production of electricity, e.g., by integrating photovoltaic systems into a smart local energy grid. Our primary goal of this project is avoiding the injection of electrical power into higher grid levels, which means Level 7 for local distribution and above referring to [15]. While the resulting installation uses currently available components, our focus within this paper is on creating an integration and measurement platform to gather, analyse and provide information from the installation. The objective of this platform is to provide forecasts and optimisation plans to operate the test setup as efficiently as possible. Due to the various endpoints and our agile process of implementing the overall system, we want to focus on infrastructure, architecture and development aspects to realise systems like this.
The so-called WINNER DataLab (WDL) is the integration and measurement platform of all project related sources and sinks, e.g., devices within the installation as well as external services. As evaluated within [11], the architectural backbone technology we want to use is Apache Camel [16]. This backbone allows to integrate various systems and to coordinate the resulting data flows. Further, each data processing component is encapsulated as a single small service and wired together by using representational state transfer (REST) and messaging services. This setup implies the use of a microservice architecture and further some kind of execution environment, e.g., isolated and independent container instances within a cloud infrastructure. But, there is a project related requirement, which states that the whole setup has to run on in-house infrastructure. This requirement is motivated by security issues to keep sensitive data within quarters near tenant households. So, the realised setup has to be deployable on locally executed hardware and data should not leave the area.
The remaining paper is organised as follows. In Sect.2 we will go into details about related work on microservices, measurement infrastructure and architectures for the IoT. Section3 deals with details of the project, how the different components interact as well as our required components to manage measurement and data flow. The following Sect.4goes into details about required components to manage a microservice infrastructure and how they interact. Finally, Sect.5discusses our experiences regarding the already mentioned areas, like complexity, modifiability and scalability.
2
Related Work
Smart Cities, IoT and Cloud Computing, are ongoing research and industry efforts. These efforts are aiming at development as well as deployment standards and best practices for designing systems and platforms. More generally, IoT architectures are discussed in [9,14]. They point out that a flexible layered architecture is necessary to connect many devices. As an example, classical three-and five-layer architectures are mentioned here, e.g., as used within [24,25], as well as middleware or SOA-based architectures. Further, [17] presents another overview of the activities done in Europe towards the definition of a framework “for different applications and eventually enable reuse of the existing work across the domains”. Besides this discussion about architectures, [18] demonstrates the integration of IoT devices within a service platform which uses the microservice architecture for this approach, which can be understood as a specific approach for service-oriented architecture (SOA) [21, P. 9]. However, thinking about microservices requires regarding principles and tenets [27], like fine-grained interfaces, business-driven, cloud-native, lightweight and decentralised.
In addition to IoT, measurement systems for IoT can also be considered. They also have to integrate different end systems. Further, they have to record different measured values and provide interfaces for analyses and calculations. For this, approaches like SOA or event-driven architecture (EDA) can be taken up, as demonstrated in [20]. This approach uses SOA and EDA in combination with an enterprise service bus (ESB). Using the microservice architecture can be seen in [22,23] as loosely coupled components by using the enterprise application integration (EAI) [19, P. 3]. They describe a reference architecture using microservices for measurement systems, which connects required data adapters as well as calculation and storage services, one more time through an ESB.
6 S. Apel et al.
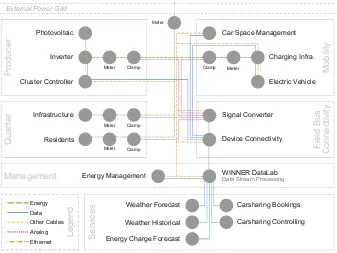
Fig. 1.Overview of all components of the demonstrator in the WINNER project.
3
WINNER Setup
Device Connectivity
Fig. 2.Generalized representation of the involved adapters and services for the WDL.
e.g., provided by European Energy Exchange (EEX). Finally, all five parts have to be integrated for further analyses and calculations within the already mentioned WDL as the sixth part of this setup. This sixth part also contains the component Energy Management, which uses WDL to access the data flows and databases via events and interfaces to carry out further analyses, such as the preparation of forecasts and optimisation plans.
Based on the components in the demonstrator mentioned above, an architecture for gathering, processing and analysis of various data streams can be designed. This data stream processing platform for enterprise application integration, the WDL, is visualised on its Level 1 component view in Fig.2. The illustration on the left-hand side shows the expected inputs of the demonstrator and the external services, which provide in particular the various measured values from installations such as meters and clamps, as well as information on carsharing, weather and electricity exchange. These adapters in the WDL generate events on different data streams and are made available to other services via a message service. The right-hand side of the figure is dominated by advanced services that gather and process events from the various message queues. This gathering applies, for example, to services that continuously persist events in databases for time series or master data, as well as services that generate events for the demonstrator by continuously evaluating the data streams. Also, there are services for accessing persistent data in the databases that are not specified in detail. These can be used for mapping, enrichment and evaluations, for example. The structure is comparable to the reference architecture found in [23].
4
Microservice Infrastructure Setup
8 S. Apel et al.
In-house, in this case, means an underlying Infrastructure as a Service (IaaS), which offers the availability of hardware and associated software. This IaaS covers server, storage and network, as well as operating systems virtualisation technology and file systems [12]. There are some virtual machines. The necessity for in-house operation lies in the continuous but secure processing of sensitive tenant household data to make the necessary decisions for the quarters.
Within our use case, we decided to use a cluster of docker engines. In this cluster, the components required for our microservice architecture are operated in individual containers. This individualisation means that a container always corresponds to precisely one service, services to integrate various components as well as analyse data and provide plans for optimised usage of energy. While this is state-of-the-art, the question of how to bring up this bunch of containers into execution remains, especially when thinking about tenets and principles.
First of all, we need a management and orchestration toolset. With the increasing number of microservices, the effort for administration increases. We used docker compose [2] to orchestrate multiple containers and configure the basic setup. Further, we have used a web tool called Portainer [5] to monitor and operate our containers. The primary purpose of this application are a health check and possibilities to stop or restart services. The service and the communication between the service and the Docker engines must be adequately secured and protected against external access. In this case, we have set up a communication layer based on internal network communication as well as transport layer security (TLS). One instance within the cluster is sufficient to manage it.
The next topic is related to management ofcontainer related events, e.g., log messages. For this purpose, we have used an ELK Stack [3]. Using logstash, the various messages of the containers are recorded, forwarded to the Elasticsearch database and finally viewed within Kibana. Logstash is recommended for each cluster node, especially when processing file-based logs. The Elasticsearch as database and Kibana for viewing is only necessary once. With increasing event traffic, the database may be scaled. Additionlly, collection metrics about CPU, RAM and Storage usage as well as incoming requests and method invocations is advisable. For this application case, we used Stagemonitor [8] for Java-based services, which is executed within the Java VM of each services, collects the desired information and pushes them also to the Elasticsearch database.
Resilent.js [10] in case of Node.js. An alternative would be to rely on the service discovery strategies of the execution environment. For example, Kubernetes [4] provides a grouping of services based on a label selector to create a virtual and addressable endpoint. This endpoint has its own IP and can be used by services that want to talk to a service from the group. For the requesting service, it is not clear which service from the group will ultimately process the request.
In addition to the service discovery, agateway is required to provide service interfaces for external and frontend clients. In our case, we use Zuul [7] as a gateway and thus offer external access to HTTP-based service interfaces. This gateway uses the Service Discovery component to coordinate communication between clients and microservice instances. One instance per cluster is minimum. For the configuration of the individual services, it is necessary to schedule a central configuration service. The task of the service is to return a set of key-value pairs, broken down by application, profile and label, which reflect the configuration of the service. Due to the use of Spring Cloud Components like Eureka and Zuul, the tool Cloud Configuration [6] from Spring was used in our application from the same toolbox. Only one instance in overall is required because the service allows differing between application profiles and labels.
Services that publish user-specific interfaces requiresecuring them. The use of OAuth2 and the use of access tokens, as well as their verification against the OAuth2 service by the respective services, are suitable for this purpose. Alternatively, the use of JWT is also possible. The combination of JWT and OAuth2 is possible and avoids the communication between service and OAuth2 server to check the tokens.
Further tools are recommended to support the service development. This recommendation applies, for example, to a source code management environment. It serves for versioning, coordination of changes and control of workflows within the development team. In our case, a Gitlab is used for this purpose, which offers repositories, simple management for documents, issue tracking, as well as the integration of additional tools for communication and process support.
Furthermore, the usage of acontinuous integrationplatform makes sense. The aim is the continuous merging of new developments. Events in the repositories are used for this purpose, for example, and lead to construction and subsequent test processes to identify possible errors at an early stage after integration. In our tested setup, we chose the continuous integration platform integrated into Gitlab and deployed a pool of Gitlab-CI-Runner, which schedules the build and test jobs created by events from repositories.
The topic of continuous delivery is directly linked to the build and test phase. If the preceding process is successful, executable containers are created and published in a private registry. However, until now, we do not make use of the following step ofcontinuous deployment.
10 S. Apel et al.
Fig. 3.Example on communication flow in case of start up and calling a service API.
well as the initial discovery of the configuration service and the further loading of related configuration. The second sequence covers an exemplary API call. This one starts with a request at the gateway. The gateway must then discover the actual service instance and forward the received request. The “SomeService” instance itself has to discover an endpoint to validate the token (especially if you are not using something like JWT) as well as other required services, a message service in this example. The instance finally validates the token and handles its business logic “SomeServiceFunction” which might result in a database call. Finally, the instance broadcasts some information through the already discovered message queue. The resulting response to this request will be transported back to the client.
Support RepositorySource TrackingIssue ContiniousIntegration
Container Engine
Figure4 combines the outlined components within a deployment plan as we would do it. We have currently distributed these containers and our encapsulated microservices manually across the already mentioned and available IaaS infrastructure. This setup contains a staging and a production environment, especially to test new builds and to prevent side effects, e.g., register untested service names within the namespace of the system used in productive. This deployment uses some components only once because they are not required to replicate.
5
Evaluation of Experiences
Our microservice architecture is partly realised as described in Sect.3 by using the components required for execution as outlined in Sect.4. Within this evaluation, we want to focus on our experiences and lessons we have learned when realising an architecture setup like this. This outline covers development complexity, modifiability, testability, maintainability and scalability as well as dependencies, development skills and related learned lessons. An overview of the experiences are listed in Table1 and are presented in detail below.
The realisation currently contains 17 service containers. There are six integration services, e.g., for interfaces like carsharing, smart meters, weather and energy prices as well as eleven infrastructure services, e.g., a timeseries database, a NoSQL database, messaging, discovery, gateway, cloud configuration and an Elasticsearch stack with Kibana for logging. More integration and analysis related services will be added in the future.
The first outlines are related to development complexity. Developing and deploying integration services as they are mentioned above help to focus on small and fine-grained tasks. So, the complexity per service task is lowered. Thus, the resulting services are quite easy to handle. However, the application of the whole microservice infrastructure of this “integration services”, by achieving “isolated state, distribution, elasticity, automated management and loose coupling” [27], requires additional concerns. These concerns and their complexities are mainly related to configuration, discovery, gateway and logging services. The developer should be trained to gain knowledge about tools and best practices of loosely coupled services. Otherwise, at least a provided tool stack which encapsulates these topics has to be used. Remarkable, these topics have to be considered within monoliths as well. However, they are getting much more impact within a highly decoupled and distributed microservice architecture. The complexity increases in case of small teams. While in theory teams specialise in the services they are given responsibility for, small teams work on the entire service composition. Therefore, all services must be developed and maintained. As we have observed, this may cause developers to get lost in the many fine-grained service implementations. This should be taken into account and, if necessary, compensated by clear processes and issue management.
12 S. Apel et al.
Table 1.Comparison of advantages and disadvantages of experience.
Advantages Disadvantages
Complexity
Focus on small and fine-grained tasks Isolating may requires additional dependencies
Complexity per service task is lowered Few Teams for all services within a distributed architecture may cause higher complexity
Modifiability
Service focus on bounded context Infrastructure and backbone decisions may have large impacts and operators, especially in case of clean DevOps
Requires extended tools to monitor and visualize communication flows for bug tracking
Scalability
Replicas can be efficiently initialised Caching strategies may require additional handling
Works out of the box Partitioning of data streams, their configuration and distribution of analysation tasks among instances Handle analytical state distribution to new instances in case of failures Dependencies
Each service can maintain its own dependency set
Additional infrastructure components are required
Dependency quantity can quickly become large
Testability is the third topic for outlines of experiences. The amount of use cases and tasks a microservice is used for should be well-defined and delimited. Thus, testing can be done cleanly regarding white and black box tests, e.g., testing the model itself as well as the published APIs, primarily if they are described within unit tests. Additionally, we noticed challenges and understanding issues while working with microservices regarding communication networks, visibility and API accessibility. For example, the developer is using a dedicated environment while developing, boots required infrastructure services as documented and starts working on its current feature. As suggested, each runtime test should be done by compiling the source, building the container and deploy this one to the test environment. This building takes time, much more time than simply press run within the integrated development environment (IDE). As we noticed, some developers like to preserve this possibility to merely run and test applications, and move them into containerised environments after they know it is running. We do not want to weight which development style is better; we want to retain that developers should regard the isolated and separated networks, and that they have to manage changes which have to be done to connect different execution environments.
The next outlines are related to maintainability. Maintenance of individual services is significantly simplified. Administrators can easily monitor the services through a wide variety of tools and event management systems; for example, errors can be tracked for individual services. Other tools may be required to look at errors in a transaction or processing chain.
14 S. Apel et al.
For example, in the case of topics, it is sometimes desirable for a service to be informed to derive actions. If this service is scaled, new messages in the topic will have two instances acting in the same way. However, if other services are listening on the topic, it is not possible to simply switch to a queue. For this purpose, service groups are necessary within the message service. The distribution of a message only once to a service of a group is realised in that way using tools like Apache Kafka [1], which directly offers this option.
Experiences withdependencies are our next topic to review. Microservices have to be “decentralized” and “independently deployable” [27]. To achieve this, additional tools are necessary as shown. However, their use in a specific service usually requires dependencies to apply the tools. The resulting dependency quantity can quickly become large. For example, if the demonstrated stack is used in a node.js service, it requires up to 10 different libraries for configuration, discovery (register and search), database access, HTTP-based API and security. Project templates or meta toolkits are conceivable but may be necessary for each service development tool.
Also, four experiences have arisen which cannot be directly assigned to the previous categories. The first one focuses on “discover config service” or “config discovery service”? Central and essential infrastructure components are created which must be assigned to a service. In our current preferred setup, this is the Discovery service, which can be used to find a configuration service. However, it would also be conceivable the other way around. The second experience is about schema management. Schema management and its inclusion to derive client and server stubs should be considered. In our experience, services should provide schemas, but not generated stubs. This is due to the free choice of tools and programming languages for the realisation of microservices, as well as the self-responsibility of the same services. The third experience is related to hardware requirements. Most of our currently developed services are realised in Java and use Apache Camel. However, because of the specific runtime characteristics of Java, wrongly or in unbalanced configurations of heap space usage may cause a huge amount of unused resources, e.g. RAM. Analyses and evaluations of the load and idle phases during runtime can be helpful for fine-tuning configuration. Compared to monoliths, however, a finer configuration is possible and the resource usage can be directly adapted to the service. The forth and last one is about gateway configuration. While “’a culture of automation’ in testing and deployment” [27] should be achieved, there are components to be careful about. For example, the operation of a gateway like Zuul for offering external clients the possibility to access microservices APIs should be carefully configured not to expose sensitive functionalities.
6
Discussion
While they cannot be generalised directly, they outline challenges that are partly already known by monolithic architectures (like discovering services or logging management) or by specific microservice architectures (like client-side load balancing or cloud configuration). It is particularly noticeable to us that the freedom of choosing development environments and the independence of services in contrast to the necessary components within the service composition to achieve this independence will create library related dependencies or development efforts which have to be taken into account. The creation of microservices within a predefined environment is convenient for developers as long as the contact with the infrastructure is low and the amount of services involved in developing new features remains manageable. But, there are many dependency decisions which have to be made carefully. They require to think about how to avoid issues in later project states. Our perception in this use case is that more independence for core functionalities, like discovery and cloud configuration, is necessary. Spring-Cloud and Spring-Boot provide a nice way to do so and hide micro service related infrastructure tasks. However, the developer has to know about that and must use these tools carefully to make the proper decisions. Further, if this comfort environment is left, it can quickly lead to extensive adaptations to meet specific infrastructure requirements. Our experiences suggest that components in the field of microservices require more standardisation. The influence of the decision for central infrastructure services should be reduced. Toolkits can help in the short term, but in the long term development tools are conceivable that completely cover the various topics. Nevertheless, our application cases also show clear strengths for use. This concerns the complexity reduction of a business case within a service, as well as the good possibilities for scaling and testing.
7
Conclusion
16 S. Apel et al.
complexity, modifiability, testability, maintainability and scalability were outlined for this purpose and represent the experience that might be taken into consideration. Finally, the practical application strengthens and supports decoupling, can help in development to focus on the essential moreover, increases efficiency in operation, not least through good opportunities for scaling.
Acknowledgements. We would like to take this opportunity to thank the partners of the research project. The research project WINNER is funded by the Federal Ministry for Economic Affairs and Energy of Germany under project number 01ME16002D.
References
1. Apache Kafka (2017).https://kafka.apache.org. 16 March 2018
2. Docker compose (2018).https://docs.docker.com/compose/. 16 March 2018
3. Elk stack (2018).https://www.elastic.co/elk-stack. 16 March 2018
4. Kubernetes (2018).https://kubernetes.io. 17 April 2018
5. Portainer.io (2018).https://portainer.io. 16 March 2018
6. Spring cloud config (2018).https://cloud.spring.io/spring-cloud-config/. 16 March
2018
7. Spring cloud netflix (2018). https://cloud.spring.io/spring-cloud-netflix/. 16
March 2018
8. Stagemonitor (2018).http://www.stagemonitor.org. 17 April 2018
9. Al-Fuqaha, A., Guizani, M., Mohammadi, M., Aledhari, M., Ayyash, M.: Internet of things: a survey on enabling technologies, protocols, and applications. IEEE Commun. Surv. Tutorials17(4), 2347–2376 (2015) Fourthquarter.https://doi.org/
10.1109/COMST.2015.2444095
10. Aparicio, T.: Resilent.js (2018). https://github.com/resilient-http/resilient.js. 16
March 2018
11. Apel, S., Hertrampf, F., Sp¨athe, S.: Evaluation of architectural backbone technologies for winner datalab. In: Proceedings of the Sixth International Conference on Smart Cities, Systems, Devices and Technologies, Venice, pp. 35–43, June 2017
12. Bhardwaj, S., Jain, L., Jain, S.: Cloud computing: a study of infrastructure as a service (IAAS). Int. J. Eng. Inf. Technol.2(1), 60–63 (2010)
13. Chemnitzer Siedlungsgemeinschaft eG: WINNER-Projekt (2017). http://www.
winner-projekt.de. 01 February 2018
14. Choudhary, G., Jain, A.K.: Internet of things: A survey on architecture, technologies, protocols and challenges. In: 2016 International Conference on Recent Advances and Innovations in Engineering (ICRAIE), pp. 1–8, December 2016. https://doi.org/10.1109/ICRAIE.2016.7939537
15. Hertrampf, F., Apel, S., Sp¨athe, S.: Requirements and architecture concept for a data processing system in local area smart grid. J. Electr. Eng.6(2018)
16. Ibsen, C., Anstey, J.: Camel in Action, 2nd edn. Manning Publications Co., Greenwich (2018)
18. Krylovskiy, A., Jahn, M., Patti, E.: Designing a smart city internet of things platform with microservice architecture. In: 2015 3rd International Conference on Future Internet of Things and Cloud, pp. 25–30, August 2015.https://doi.org/10.
1109/FiCloud.2015.55
19. Linthicum, D.: Enterprise Application Integration. Addison-Wesley Information Technology Series. Addison-Wesley, Essex (2000)
20. Mar´echaux, J.L.: Combining service-oriented architecture and event-driven architecture using an enterprise service bus. IBM Developer Works, pp. 1269–1275 (2006)
21. Newman, S.: Building Microservices. O’Reilly (2015)
22. Vianden, M., Lichter, H., Steffens, A.: Towards a maintainable federalist enterprise measurement infrastructure. In: 2013 Joint Conference of the 23rd International Workshop on Software Measurement and the 8th International Conference on Software Process and Product Measurement, pp. 63–70, October 2013.https:// doi.org/10.1109/IWSM-Mensura.2013.20
23. Vianden, M., Lichter, H., Steffens, A.: Experience on a microservice-based reference architecture for measurement systems. In: 2014 21st Asia-Pacific Software Engineering Conference, vol. 1, pp. 183–190, December 2014.https://doi.org/10.
1109/APSEC.2014.37
24. Wu, M., Lu, T.J., Ling, F.Y., Sun, J., Du, H.Y.: Research on the architecture of internet of things. In: 2010 3rd International Conference on Advanced Computer Theory and Engineering(ICACTE). vol. 5, pp. V5-484–V5-487 (Aug 2010).https:// doi.org/10.1109/ICACTE.2010.5579493
25. Yang, Z., Yue, Y., Yang, Y., Peng, Y., Wang, X., Liu, W.: Study and application on the architecture and key technologies for IoT. In: 2011 International Conference on Multimedia Technology, pp. 747–751, July 2011.https://doi.org/10.1109/ICMT.
2011.6002149
26. Zanella, A., Bui, N., Castellani, A., Vangelista, L., Zorzi, M.: Internet of things for smart cities. IEEE Internet Things J.1(1), 22–32 (2014).https://doi.org/10.
1109/JIOT.2014.2306328
Multi-agent Architecture of a MIBES
for Smart Energy Management
J´er´emie Bosom1(B) , Anna Scius-Bertrand1, Ha¨ı Tran2, and Marc Bui1 1 CHArt Laboratory EA 4004, EPHE, PSL Research University, Paris, France
{jeremie.bosom,anna.scius-bertrand,marc.bui}@ephe.sorbonne.fr
2 Energisme, Boulogne-Billancourt, France
Abstract. This paper introduces the concept of Multi-Institution Building Energy System (MIBES) for the smart energy management. The MIBES addresses the exploitation of energy data shared by numer-ous multi-site multi-purpose institutions. It is a “hierarchical graph” describing the physical and structural reality of the data collected for these institutions. We propose the architecture of a multi-agent system (MAS) for the MIBES smart management. This MAS is then used within a data collection system to allow real time treatment of the system. This complete system is being deployed in a french company calledEnergisme.
Keywords: Multi-agent system
·
Data collection system Building energy modeling1
Introduction
During Kyoto Protocol’s signature in 1997, a large number of countries commit-ted themselves to reduce their gas emissions by 5% of the record in 1990. Since then, buildings have been identified as the biggest energy consumer sector for European countries.
New laws and regulations are adopted in numerous countries to enforce sus-tainable energetic performances in post-production building life cycle. In France, some laws as “Loi Grenelle”I andII intimate public agencies and advice com-panies to take actions in order to reduce their energy consumptions.
These new regulations accentuate the need of knowledge and control over energy consumptions for both private and public institutions. Nevertheless, the smart management of energy consumption data is a complex task due to the interdependence of energetic factors within buildings [1]. The task is even more challenging when it involves Big Data [19].
For these reasons, institutions call the services of third party companies spe-cialized in on-site energy sensors installation and in energy data management.
c
This work takes place in one these companies called Energisme [2]. The set of sites managed by this kind of companies has the following properties:
– Sites repartition is not contiguous: data are gathered from various clients institutions with extremely different activities spread over several sites and countries,
– The possible actions on the sites are very limited or non-existent: these third-party companies do not take on direct interventions to reduce energy con-sumption as can be seen for building automation,
– The data heterogeneity and volume impose the use of Big Data techniques: data are gathered from smart meters, energetic invoices in PDF format pro-cessed automatically, industrial processes. . .
Despite a through review of the literature, we have not found a defined sys-tem with the exact same requirements. Indeed, the main topics related to this kind of systems are more focused on electricity and spatial relations, such as Smart Grids, or on smart meters management and control. This paper suggests a definition and a solution for the smart management of such a system in the form of a hierarchical graph called Multi-Institution Building Energy System (MIBES). The MIBES reflects the physical and structural reality of the studied system.
The contribution of this article is the architecture of a Data Collection System [1] (DCS) for the constitution of a database describing a MIBES. This DCS shall ensure the data collection and analysis while meeting the requirements for Big Data management.
The DCS subsystem in charge of the MIBES smart management is a Multi-Agent System (MAS). It allows concurrent and autonomous simulation of the various hierarchical elements defined by the MIBES.
This paper is organized as follows: Sect.2 defines the MIBES and its dif-ferences with already existing concepts. Section3 presents the MIBES formal definition as a hierarchical graph and its architecture. Section4defines a proper Big Data architecture for a DCS and the architecture of its MAS in charge of the MIBES modeling.
2
The MIBES Concept for Smart Energy Management
We introduce the concept of Multi-Institution Building Energy System (MIBES) as the data shared by several institutions in order to manage their energy con-sumptions.
20 J. Bosom et al.
Fig. 1.One example of MIBES common case involving several institutions in a same building
case involving several institutions that the MIBES should handle. This explains why our system is a “Multi-Institution” one.
Most of entities embedding sensors are buildings. We restrict ourselves to “Building Energy System”. The MIBES is mainly based on data about build-ings characteristics, their installations or their use. Building modeling is a hard task due to the interdependence of energetic factors within buildings [1]. The considered buildings are non-residential or collective residential.
The reality of multiple policies for data exploitation, the discontinuous geo-graphical distribution of sites, the limitation of possible actions of the system, the heterogeneity and volume of the data and the inherent complexity of building modeling prompted us to search for existing smart management systems alike the MIBES in the literature.
Multiple smart energy management systems exist such as the Cyber-Physical Systems [8], the Corporate Real Estate Management Systems [7,13], the Sensor Networks [15], the Bottom-up Building Stock Models [10,18], the Multi-agent Based Energy Management Systems [5], the Automated Production Systems [17], and the Commercial Building Stocks [18]. These systems mainly share the same similarities and differences as those listed in the following part between our solution, the Smart Grids [3] and the Annex 53 of the International Energy Agency [1].
proximity into entities such as Virtual Power Plants [11], Micro Grids [16]. This approach is irrelevant in our case because we manage entities spread over sparse localizations. Furthermore, we manage only energy consumers and we do not integrate questions of optimization between energy demand and supply.
Nevertheless, we retain some aspects from the study of Smart Grids and we are specially interested on their resilience. The resilience of a system is its capacity to retrieve a stable state after suffering a disturbance. Our system has to be able to cope with:
– to new elements,
– to the heterogeneity of data, – to faults, crashes and errors, – to potential attacks.
Consequently, the required specification of our system is to be autonomic, that is to be able to manage its own operations. For this, our system needs to meet the requirements of the self-management as: (1) self-configuration and boot, (2) self-healing, (3) self-optimization, (4) self-monitoring, (5) self-protection.
In the Annex 53 [1], the International Energy Agency identifies six main factors influencing energy consumption in buildings. Also, the Annex 53 specifies that, in order to evaluate building energy performances, a suitable database must first be made available. This database needs to be aggregated from the available buildings data. The Annex 53 suggests for that the use of a Data Collection System (DCS). A DCS is a system that collects data and aggregates them for their analysis and exploitation.
Until then, we have presented the MIBES as a model relating the physical and structural reality of the studied system. However, the exploitation of the MIBES data requires the use of a suitable system performing data collection and analysis. For this reason, we will use a DCS as defined above. This DCS has several challenges to meet:
– allowing Big Data treatments (scalable, . . . ),
– the MIBES smart management: exploiting the different data sources and adapting the modeling to be as close as possible to what we want.
The MIBES smart management part of the DCS needs to be structured accordingly to the requirements from the Smart Grid review we want to keep. To do so, we use a bottom-up solution in the form of a Multi-Agent System (MAS) [6]. By the aggregation of data through levels of modeling, the bottom-up approach allows the construction of knowledge about the studied system. The multi-agent approach is particularly designed for distributed structures as a network of sensors. The agents of a multi-agent system are autonomous pro-grams that are meant to be executed in parallel independent processes. They are also adaptive and evolve according to the interactions they have with other agents. Furthermore, a MAS allows to manage new elements in a transparent and autonomous way.
22 J. Bosom et al.
3
Multi-Institution Building Energy System (MIBES)
The Multi-Institution Building Energy System (MIBES) is an acyclic bidirec-tional graphGwith hierarchical levels defined as:
G= (V, E)
WhereV is the set of vertices composed by the different elements interacting in the MIBES andE is the set of edges describing the links and communications between the elements ofV.
The MIBES separates the elements of V into a set H of four hierarchical levels aggregating data according to four criteria:
– by same physical object,
– by same space delimitation of the physical location,
– by same groups of sites that are defined for convenient management or sites comparisons,
– by same owner institutions.
Fig. 2.An example of a MIBES hierarchical graph
We defineSas the set listing the different types of possible elements inV. For each level ofH, a corresponding type of elements is defined inS. An additional type of elements is added to manage the incoming data feeding the different levels of H with data. Therefore, the set S is composed of the five following types: (1) data sources, (2) physical assets, (3) sites, (4) building stocks and (5) institutions.
We callV(s), s∈Sthe set of vertices inV and with types. We specify that: – At each nodev ∈V(Data Sources), data are emitted but must be labeled
with an institution tag,
For better understanding, the Fig.2 shows an example of a MIBES graph and the following part gives a more detailed description of the MIBES elements and their roles.
Data Sources: Data sources are the elements in charge of the streaming of
incoming data. They constitute the base elements of our system and feed all other elements with their processed data. They are a flexible way to integrate incoming data at every level of the MIBES hierarchy by bringing:
– best possible qualified data in our possession, – modularity.
Physical Assets: We represent the physical assets as materials within a site.
They are associated with at least one data source giving the available information about the on-site installation of the physical asset. This category aims to regroup gateways, sensors and technical processes like boilers that may emit or not data depending on how old the process is.
Sites: The concept of buildings inside MIBES is what we call a site. Depending
on institutions activities, sites could be a floor of a building, an entire building, several ones and it could even include an additional land.
Building Stocks: Stocks that are defined as a set of sites fulfilling the same
function. This definition is willingly large to encompass all possible building stock sizes and make all wanted levels of management easier. Thus, the richer in data a set of sites is, the more it can be cut into a precise hierarchy of building stocks.
Institutions: Last level of the MIBES hierarchy, the institutions are public or
private entities managing non-residential or collective residential building stocks. Most of available data can be assimilated to time series because new data are produced over time. Consequently, we can use state space modeling to construct aggregates from available time series [4]. These aggregates can be used as state representations for upper hierarchical levels or neighbors.
The distributed database of aggregates described by the MIBES can be used as a case database. Therefore, any new element with enough data to compute an aggregate can be compared to the case database. This comparison allows to find similar elements and choose the more appropriate behavior to manage the new element.
MIBES, as a hierarchical graph using five types of modeling elements inter-acting with each other, permits us to build a case database to compare elements and manage new incomers. In this context, our goal is to design a solution allow-ing the construction of a study case database so we can exploit and manage information collected through a MIBES over time.
24 J. Bosom et al.
4
A Data Collection System for MIBES Smart
Management
In this section, we first focus on the definition of a Data Collection System (DCS) architecture for Big Data treatments and MIBES smart management. Then, we present a Multi-Agent System (MAS) architecture as a DCS subsystem ensuring the smart management of the MIBES.
4.1 Data Collection System Architecture
The DCS is fed by a database, called Data Service, giving access to all data retrieved for the available institutions. In more detail, the collected data can come from:
– thousands of sensors of two main kinds distributed over hundreds of sites:
• passive sensors or gateways that are just relaying data from other sensors to our servers,
• active sensors measuring all the available energies (electricity, water, gas, heat flows, temperatures, etc.),
– data automatically extracted from tens of thousands of energetic bills in PDF format produced by a large variety of energy providers,
– technical processes as automated production lines or boilers, – users,
– additional data sources, for example, data extracted from Customer Relation-ship Management (CRM) systems,
– independent institutions providing weather data, etc.
The system regroups data about non-residential or collective residential buildings stocks as: plants, hotels, public swimming pools, schools, supermar-kets, etc. For instance, little territorial communities are typically only sharing monthly electricity and water bills in PDF format about public buildings. In con-trast, hypermarket chains equip their sites with Internet of Things (IoT) sensors measuring hourly water and electricity consumptions and fridges temperatures. Organizations such as those managing asphalt mixing plants can give access to their technical processes logging production every 5 s.
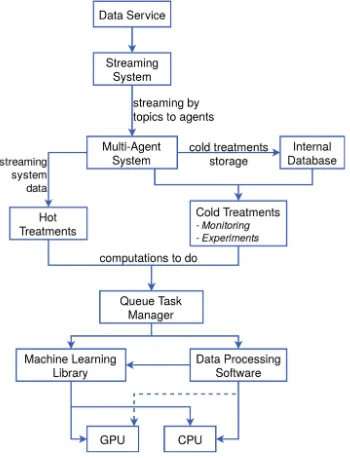
The smart management of this database needs an adapted solution for Big Data. Consequently, the DCS implements a LAMBDA-like architecture [14] for real time and batch computing. The architecture separates hot and cold data treatments. As shown in Fig.3, the DCS uses a streaming system suited for Big Data to manage new data coming from the Data Service.
Fig. 3.Data Collection System architecture
several problems including system overload. This challenge is referred in the literature as Many-Task Computing [9,12].
We suggest to use a Task Queue Manager (TQM) in the DCS architecture as a solution to this Many Task Computing problem. A TQM is a tool to manage a queue of computations to execute. MAS large computations are provided in the form of tasks to execute on specified data retrieved directly from either the streaming system or the local database. The TQM dispatches the tasks and optimally use the available memory and computation power. It schedules tasks taking their priority, estimated execution time and resource requirements into account. Computations are done using specialized data processing software and machine learning libraries executed on Central Processing Unit (CPU) and Graphics Processing Unit (GPU).
The DCS architecture refines MAS context and requirements and ensures the scalability of the system. The next part presents a MAS architecture for the specified DCS.
4.2 Multi-agent System Architecture for MIBES Simulation
26 J. Bosom et al.
MIBES Agents. We define an AbstractMIBESAgent as a base element of the five types of MIBES agents implementing the five different entity types interacting in MIBES.
AbstractMIBESAgent.Each MIBES agent of the MAS has some latent
vari-ables to predict. These varivari-ables are:
– a boolean defining whether the agent is currently in activity, – a boolean for the error state of the agent,
– a boolean for the security state of the agent, – the current state definition of the agent,
– a state transition function to predict the next state from the current one. The state of an agent can be defined, as stated in Sect.3, as an aggre-gate constructed on available data. Considering an aggreaggre-gateatof an Abstract-MIBESAgent at time t, we can define a state transition function as:
f(at) =at+1
This state transition function can be approximated using Machine Learning (ML) techniques on the data history of the agent. Therefore, we can predict the future behavior of the agent.
Fig. 4.DataSourceAgent modeling and examples of sub-classes
DataSourceAgent.This agent is the abstract class of all data sources. It has
one monitoring variable as a time series describing the incoming stream of data. Some classes inherit from the data sources as shown in Fig.4.
PhysicalAssetAgent.We need to give information to the PhysicalAssetAgent
Fig. 5.PhysicalAssetAgent modeling and examples of sub-classes
reason and as shown in Fig.5, the PhysicalAssetAgent is associated to one Data-SourceAgent. The latter indicates only physical characteristics of the agent that change a bit over time, like its position in the site. Assets are useful to model some black box components in a site as gateways, old boilers, etc.
We also define a SensorAgent as a PhysicalAssetAgent fed by one or several DataSourceAgent(s). For instance, an energetic delivery point for electricity will be modeled as a subclass of SensorAgent. It will aggregate information from a lot of data sources corresponding to as many electricity bills.
SiteAgent. SiteAgent aggregates data coming mainly from DataSourceAgents
and PhysicalAssetAgents. As specified in the MIBES, a SiteAgent could also be in a relationship of child/parent or neighbors with other SiteAgents.
BuildingStockAgent. BuildingStockAgents interact with DataSourceAgents,
SiteAgents and other BuildingStockAgents. These agents can be useful to aggre-gate datasets of some types of sites easily for monitoring and experiments.
The splitting of a set of sites into a BuildingStockAgent hierarchy can be given by the owning institution or it can also be automatically or manually adjusted. For instance, we can consider automatic stock building splitting using clustering techniques for new sites without a building stock hierarchy, and more manual splitting for the most detailed and/or oldest sites. The possibility of having some automatic or manual cut-outs is an essential feature of our system. It allows both the automatic processing of the data and the possible interactions and parameterizations of the users of the system.
InstitutionAgent.The InstitutionAgent uses data from BuildingStockAgents
28 J. Bosom et al.
Fig. 6.UML architecture of the agents
System Agents for MIBES Agents Hierarchy. The whole hierarchy of the MIBES agents interacts with other agents in charge of the management of specific tasks. Thus, as shown in Fig.6, the AbstractMIBESAgent, and so the different levels of modeling, interacts with the following agents:
– DataAgent: agent in charge of data and internal memory,
– ErrorManagerAgent: agent in charge of the detection and management of ErrorEvent,
– SecurityManagerAgent: agent responsible for detection and management of SecurityEvent,
– InterventionManagerAgent: agent in charge of the actions needed to solve the detected ErrorEvent and SecurityEvent. It also keeps track of possible interventions on the site coming both from our own actions and from the site’s institutions,
– ApplicationManagerAgent: manager agent for specific sites’ applications as predicting a specific business process behavior, etc.
– AggregatorManagerAgent: agent responsible for constructing the aggregations of required data for the achievement of theAbstractMIBESAgent’s objectives
AggregatorAgent.TheAggregatorManagerAgent manages a list of
Aggregator-Agents. As shown in Fig.6, each modeling level instantiates a specific subclass of AggregatorAgentto aggregate their data. The Fig.7shows an implementation of building energy modeling influence factors as described in [1]. In this case, one agent is in charge to aggregate information about one of the factors using one or multiple models trained on a large instance of sites.
Computation Model. As stated in Sect.4.1, agents expensive computations
Fig. 7.UML architecture forAggregatorAgent
computation manager as an interface with the TQM. For this task, we will define a GlobalComputationSupervisorAgent, as shown in Fig.8.
Algorithms Managing. As previously stated, the MAS system needs to use
ML algorithms for its predictive parts. The most suited algorithm depends on the prediction goal and on the available data. However, the volume and heterogeneity of MIBES data raise challenges.
Fig. 8.UML for the whole multi-agent architecture
30 J. Bosom et al.
As described in Sect.3, the MIBES allows us to determine the best behavior to handle new incoming cases. The library of algorithms helps achieving this goal by providing a unified view of the possible treatments on data. This way, it is possible to evaluate the available algorithms on each known cases of the MIBES case database and so to determine what treatments are the best for new cases.
4.3 Multi-agent System Global Architecture
The MAS is separated into several multi-agent subsystems specialized in different tasks, as shown in Fig.8.
The core part of the system is dedicated to the execution of the following agents:
– GlobalErrorSupervisorAgent: manages errors at the system level – GlobalSecuritySupervisorAgent: manages security at the system level – GlobalInterventionSupervisorAgent: manages interventions at the system
level and regulates the flow of mails sent to IoT technicians and managers of the system to schedule interventions,
– GlobalAlgorithmSupervisorAgent: manages the algorithms library
– GlobalComputationSupervisorAgent: manages the computation flow of agents – GlobalExperimentSupervisorAgent: manages experiments created by
searchers and managers of the system.
– GlobalMonitoringSupervisorAgent: manages the self-monitoring of the MAS To this subsystem, the MAS MIBES Simulation process launching and managing the multi-agent simulation of the whole MIBES agent architecture described in Sect.4.2is added.
A subsystem is also dedicated to the self-monitoring of the MIBES simula-tion. The self-monitoring is needed to achieve sustainable self-management as required in Sect.2.
The MAS API makes the link between the MAS and the external world, represented by the Data Service.
By separating the global managers from the rest of the system, we can control the communications received by these processes more precisely. The same is true for the two other subsystems. It allows to separate critical points, computations and requests-responses flow from the outside world. This helps make the system easier to secure and maintain.
Conclusion
with each other using aggregates, layers allow to create a complex view of the system as precise as one might wish.
Then, we have presented the architecture of a Data Collection System (DCS) suited for Big Data treatments and MIBES smart management. This last part is ensured by a Multi-Agent System (MAS) for which we suggest an architecture. The MAS uses subsystems managing security, errors, interventions, computa-tions, experiments and algorithms library. This allows real time supervision and efficient smart management.
The undergoing work is addressing the DCS elaboration and the benchmark-ing of the MIBES database.
Acknowledgement. This work has been funded by the french company Energisme
[2]. Related and future works are currently being held as projects withinEnergisme.
References
1. EBC Annex 53 Total Energy Use in Buildings: Analysis & Evaluation Methods. http://www.iea-ebc.org/index.php?id=141
2. Energisme.https://energisme.com/fr/. Accessed 24 April 2018
3. Ahat, M., Amor, S.B., Bui, M., Bui, A., Gu´erard, G., Petermann, C.: Smart grid and optimization. Am. J. Oper. Res.3(1A), 196–206 (2013)
4. Aoki, M.: State Space Modeling of Time Series. Universitext. Springer, Heidelberg (2013). https://doi.org/10.1007/978-3-642-75883-6. https://books. google.fr/books?id=-F yCAAAQBAJ
5. Gazafroudi, A.S., De Paz, J.F., Prieto-Castrillo, F., Villarrubia, G., Talari, S., Shafie-khah, M., Catal˜ao, J.P.S.: A review of multi-agent based energy management systems. In: De Paz, J.F., Juli´an, V., Villarrubia, G., Marreiros, G., Novais, P. (eds.) ISAmI 2017. AISC, vol. 615, pp. 203–209. Springer, Cham (2017).https:// doi.org/10.1007/978-3-319-61118-1 25
6. Groen, F.C.A., Spaan, M.T.J., Kok, J.R., Pavlin, G.: Real world multi-agent sys-tems: information sharing, coordination and planning. In: ten Cate, B.D., Zee-vat, H.W. (eds.) TbiLLC 2005. LNCS (LNAI), vol. 4363, pp. 154–165. Springer, Heidelberg (2007).https://doi.org/10.1007/978-3-540-75144-1 12
7. Haynes, B., Nunnington, N., Eccles, T.: Corporate Real Estate Asset Management: Strategy and Implementation. Taylor & Francis, London (2017). google-Books-ID: xCQlDwAAQBAJ
8. Jirkovsk`y, V., Obitko, M., Maˇr´ık, V.: Understanding data heterogeneity in the context of cyber-physical systems integration. IEEE Trans. Industr. Inf. 13(2), 660–667 (2017)
9. Karthick, A., Ramaraj, E., Subramanian, R.G.: An efficient multi queue job scheduling for cloud computing. In: 2014 World Congress on Computing and Com-munication Technologies (WCCCT), pp. 164–166. IEEE (2014)

![Fig. 3. Structural dynamic of agent’s network over three periods: dashed red line withsymbol ‘[]’ reveal forlabel in symbol ‘[]’ illustrate RMT P with major topic; solid blue line with label without RDI with the number of interactions (Color figure online)](https://thumb-ap.123doks.com/thumbv2/123dok/3934641.1878061/61.439.57.397.54.348/structural-dynamic-network-periods-withsymbol-forlabel-illustrate-interactions.webp)