THE ECONOMIC FACTORS AND OTHER VARIABLES THAT AFFECT
THE EMPOWERMENT OF THE MICRO-BUSINESSES RUN BY FARMING
COMMUNITIES IN VILLAGES AROUND THE FOREST AREAS
Yoyo Sunaryo Nitiwijaya
Faculty of Economics, Universitas Kuningan, Indonesia (y_sunaryon@yahoo.co.id)
Hajanirina Andrianantenaina
Faculty of Law, Economics, Management and Sociology, DEGS, University of Antananarivo, Madagascar
(hajasan7@gmail.com)
ABSTRACT
This research is conducted in Kuningan regency, West Java, Indonesia and aims to analyze the economic, social, institutional, and cosmopolitan factors which affect the empowerment of the communities of micro-business entrepreneurs. It attempts to investigate the problems that persist for this community, in that the people living near the forest are heavily dependent on it, and on their agricultural activities. They have to face institutional regulations and competition from immigrants. Due to the nature of the data, the complexity of the structured relationship, the multiple endogenous variables; SEM or Structural Equation Modeling is used to analyze and confirm the extant association between the studied variables in a covariance based approach assisted by AMOS. The results suggest that the micro-business community is strongly influenced by the dynamics of the institutional businesses in the village, their social interactions, economic capabilities and cosmopolitan drives with the immigrant communities. It shows the efficiency and importance of the institutional community while dealing with micro-businesses’ agrarian economic empowerment. Improvement in the regulations is necessary and is expected to improve the partnership between the government and private and public entities, to cope with the economic development of society in such communities, and others which may share the same characteristics.
Keywords: community empowerment, micro-business, communities around forest area, partnership
INTRODUCTION
Despite the fact that Indonesia has a positive Human Development Index (HDI1) for the years from 1990 to 2014, with on average a 3.25% increase yearly, as reported by the UNDP, its wealth distribution is not equitable. Derived from that index, it places the country as having the fifth best HDI among its nine other ASEAN neighbors, behind Singapore (which ranks first), then Brunei Darussalam, Malaysia and Thailand. Consequently, this fact implies that the standard of living is gradually improving. The Indonesian
1
HDI or Human Development Index, data adapted from the UNDP (United Nations Development Program) website http://hdr.undp.org/en/data# accessed July 25, 2016. See the detailed calculation result in the annex part.
government has adopted the National Program for the Empowerment of Rural Communities (PNPM MP2) since 2007, which plays an important role (Soetrisno, 1988), yet wealth disparities still persist. Previous research by Bock (2014) found that Indonesian GINI has increased from 0.29 in 1999 to 0.38 in 2009 but the wealth disparity remains. The wealth is concentrated in the Island of Java. Research conducted in the country by Chongvilaivan and Kim (2015) shows that urban-rural differences represent 6 to 6.5 percent, and education up to 13 percent of the sources of income inequality.
2
Program Nasional Pemberdayaan Masyarakat Pedesaan, a rural empowerment policy adopted by the Indonesian government.
Khairiyakh et al. (2015) find that, although the GDP increased, and the agricultural sector plays an important role in 29 provinces, its contribution has been decreasing. Agriculture is an important economic driver for the residents (OECD, 2010).
This study is important as it deals with the micro-business entrepreneurs and people who dwell near the forests. Analysis shows that micro-, small- and medium-businesses contribute to the national GDP (Akob Kadir, 2015), and evidence from the national statistics show that the micro-industries, for instance, increased 5.91 percent for the first trimester of 2016 (BPS, 2016). This analysis remains theoretically important for the extant literature as well as practically for the authorities. Former studies mostly focussed on the national coverage like Bock (2014) and Chongvilaivan and Kim (2015) and even those by the ASEAN community. As opposed to them, this study mostly focuses on a special region, Kuningan regency in West Java. West Java contributes significantly to the national GDP, by up to 13.13 percent as compared to the other 33 provinces in Indonesia. However, on average 40.09 percent of its rural inhabitants are poor (BPS, 2016). Methodologically, some literature has emerged to determine the specific region, however, a qualitative method is used, for instance in the research into the implementation of the National Program for the Empowerment of Rural Communities in Bendungan, which is located in the Sub-district of Gondang in Tulungagung district in the Province of East Java (Murbeng et al. 2013). They use a descriptive analysis only. Yet, this study uses a structural equation estimation with a quantitative approach. It is expected that this study might contribute to the extant literature, both in theoretical as well as practical terms, mostly for the selected region of Kuningan regency, or similar locations.
In line with the enforcement of Kuningan regency, the government chose this region as a pioneer for development trials, in the area where this study is conducted. It is administratively divided into three areas for development. They are West Kuningan, which is characterized by its
highland region; South Kuningan, the central region and the transition area from the highlands to the lowlands, and Eastern Kuningan, which is a lowland area. Administratively, Kuningan regency is divided into 29 districts, 15 village areas, and 362 rural villages. There are 132 villages bordering the forested area that are the abodes of the forest dwellers.
The people in the villages around the forested areas highly depend on their agricultural and forestry activities, including agricultural processing and forest environmental services. Besides farming, the people have also begun to develop micro-businesses (home industries) processing semi-finished agricultural items for industrial purposes, or finished goods that are sold directly to the final consumers (Van Den Ban and Hawkins, 1989).
Fundamentally, the main issue which still persists is their inability to interact socially and economically with others and to be able help themselves. Limitations on managing resources, the lack of access to education, and other groups are often categorized as the conditions that cause and maintain poverty, as found by Hayami and Kikuchi (1985). Community empowerment efforts in Kuningan regency have been tried by government agencies or institutions through counseling developments. Approaches have been made by each Regional Work Unit (SKPD –
Satuan Kerja Perangkat Daerah). Institution-ally, efforts have been made by all the SKPDs in their respective capacities, in accordance with the objectives to be achieved.
Geographically, the residents live on the outskirts of the forested areas. In terms of management, the forests in West Java and Bali are state-owned forests that are managed by PT. Perhutani as State Owned Enterprises under the Ministry of Forestry’s control. Law enforcement and regulations’ amendments, and their subsequent application to help govern the forests’ management, are often experienced by the nearby forest settlers as harsh conditions because they place limitations on their activities and expose them to pressures from the forest’s management authorities. They are marginalized and cannot access the forest areas. For instance, in the restrictions, they are not allowed to cut and take grasses or green leaves as crops. This impoverishes the households as they have to expend extra funds for these items.
Individually, they cannot act as the economic agents for their rural economy. There is a need for community institutions, such as micro-businesses, to act collectively. But there is some doubt if the economic empowerment program involving micro-businesses is really relevant for their community, and actually for those resi-dents? As Kuningan regency is within West Java province, which includes the large and more advanced cities in Indonesia such as Jakarta, Bogor, Depok, Tanggerang, and Bekasi (known as JaBoDeTaBek), and where the Special Capital City Jakarta (DKI) contributes 17.24 percent of the national GDP compared with the other 33 provinces (BPS, 2016). The emigration move-ment occurs from the forest dwellers’ areas. That interesting economic topic is also our query, do economic, social, institutional, and cosmopolitan factors affect the empowerment of the micro-businesses’ entrepreneurs community. It also seeks the predominant factors.
In sum, choosing a specific region enhances the rationale of this study, as every single region shares diverse characteristics that can be both generalized (the essence of a scientific quest), but are also definitely special for the region being studied.
LITERATURE REVIEW
Community Empowerment
From the seminal papers of Rappaport (1981) and Perkins and Zimmerman (1995); the empowerment theory considers the process and also the outcome. The theory implies the "advocacy" for human being that engenders a liberation stage to a better community. It encompasses social policy with a definite model to deal with the problems of both social and community hindrances in its paradoxical state, as in Rappaport (1981). Three levels need to be considered in the empowerment theory including the individual, organizational and community interactions, as explained by Perkins and Zimmerman (1995). The idea of community empowerment lies in social interaction, continuous social development (Winfried, 1991), individual responsibility towards the community and the community toward an individual.
With this point, empowerment provides, for individuals and community groups, not only the "power" to act, but also the authority and responsibility to do so. Controlling and monitoring becomes the living regulation’s application. Yet, Rappaport (1981) and Perkins and Zimmerman (1995) do not consider the empowerment of special government policies, as occurs in Indonesia. In Indonesia, two main policies are adopted in accordance with the geographical area: Urban and rural.
policies and structures as well. However, it shows a case of moderate state in West Java; it mostly reports on the case of Cirebon, the neighbor of Kuningan regency. Besides, this study is not concerned with the rural aspects of the empowerment.
That previous study on urban empowerment does not include the control principle and its regulations. Korten (1987) suggests that empowerment, in the context of development, is represented by the power of control, the power of authority, and the power of dominion. The author shares the same point as Rappaport (1981) and Perkins and Zimmerman (1995) on responsibilty, control and authority.
For Brown (1994) the aspect of empower-ment relies on the process of empowering people through changes, and the development of capa-bility, trust, authority, and responsibility in the implementation of an organization's activities. Yet authority and responsibility remain, as regulations in terms of the community’s control is lacking in this quest. It furthermore focuses on the improvement of the expected performances. Willins (1990) on the other hand, analyzes the individual’s role, stating that the empowerment of a person in the execution of their duties will allow them to bear responsibility for their work so that the person knows what to do, and the person will do much more because they like and know the tasks and work they have to do. Again, it does not amplify the dynamism of the community’s incentives in terms of their social contract or government regulations, even if it deals with the individual’s involvement.
Similarly to Willins (1990), Mardikanto (2007) suggests empowering communities by taking steps to increase their capacity and self-reliance. However, the latter is more specific about the community empowerment’s purpose as a process which allows people to be able to survive and to develop themselves, to achieve their objectives. Besides, Ascher et al. (1990), address a specific group of people, which are poor people, to whom the main objective of the social community empowerment program is to emphasize the provision of opportunities and abilities (Soetomo, 2009), to have the courage to
speak up, and to have a choice when selecting alternatives for their life, for the individual and the community.
Factors for the empowerment of poor communities of forest dwellers
Across the literature, these factors could be categorized as either social, economic, institu-tional, or cosmopolitan factors, of the process of the empowerment policy itself. Diverse concepts and opinions enrich the studies on this interest-ing topic.
Social factors
The social factors of empowerment have been recently studied. Based on Perkins and Zimmerman (1995), individuals, organizations and communities have a relationship with empowerment. Yet, individual data are necessary, besides the willingness of a group of individuals to form a community, and the relationship has a reversible direction. We source data from individuals but this study mostly focuses on the community’s empower-ment. Social indicators and constructs like poverty, gender and health care are studied for their social empowerment, as elaborated in Kumara and Mehtab (2016). They deal with the distribution among the five measurements of pollution protection. Mostly, it encompasses the pollution reduction when cooking. Besides, it enhances promotion, policy and coverage, and then adoption which should be sustained. In-home, institutional, country surveys and reports are suggested as data sources.
As for the study done in rural areas in Spain, on a working group in which skills and attitude were targeted; the inclusion of the constructs of the friend and the facilitator roles were important to enhance the individual’s self-efficacy and make them more autonomous. The study was done over a 30 year period. It implicitly evokes the importance of the working experience as well, in terms of the knowledge sharing within or across the group (Fernández-Moral et al. 2015). We adopted working experience for our construct’s measurement.
For Bouman (1970), the social factor impinges on the selfhood ability of a person to understand other people, and the nature of the human ability to find culture (Meginson et al. 1993). From the perspective of a community's social skills, it is the ability to integrate people into public life in order to achieve a specific quality and quantity. It covers the willingness to work and to create a free place to learn, to go forward, and to change for the better. Related to that, Soekamto (1990) focuses on the social nature of humans in their relationships as it requires reciprocity, dynamism and interaction through social contact and communication. In-between their individual relationships and involvement characterize this empowerment. In sum, we expect positive relationships between the social factors and the studied variable.
Economic factor
Rosyid (2005) suggests that economic factors cover the efforts of a person or a community to use the limited resources/scarce commodities or goods available to produce useful products and distribute them. On the other hand, Miller and Shade (1976) state that the economic factor is more about how people make the right choices to take advantage of their sources of production (land, labor, capital goods, and engineering knowledge) that are scarce and limited, to produce a variety of goods and then distribute them to others.
Increasing the quality of life in rural communities, especially for the poor can be done through an approach using the rural-urban rela-tionship. This can be done by: (1) The rapid
growth that is accompanied by a mechanism employing the trickle-down effect; (2) intra-rural redistribution; (3) urban-rural redistribution; and (4) promoting special growth in sectors that involve the poor (Charles, 1979).
Institutional factors
According to Sutomo (2009), institutions in societies suggest a system of behavior and a relationship that is centered on activities that meet the needs of the societies. Furthermore, the institution’s functions enable it to provide guidance to the public about how to behave or act when facing problems, to maintain the inte-grity and balance of people's lives, and to pro-vide a means for the public to hold onto a system of social controls.
The growth and development of institutional organizations within the community, according to Korten (1987), occurs based on: (1) The coer-cive institution and the enacted institution; (2) the basic institution and the subsidiary institu-tion; and (3) the general institution and the restricted institution.
Cosmopolitan Factor
According to Soekamto (2003), a cosmopo-litan community is a group of people who can be classified as modern, highly motivated and sym-pathetic, with less fatalism, and a more extensive network of relationships with elements of the city. It also includes relationships with elements of the village, the wider aspects of the business of farming, and receiving a lot of new business technologies with aspects of marketing, life-saving, and greater investment in businesses to make a living.
Empowerment Factor
According to Camsyah (2005), community empowerment is a community’s capacity build-ing conducted through an ability to compete in bargaining, which is reflected through the com-munity’s participation in all the development processes. David (1986) mentions that participa-tion includes aspects such as: (1) A sense of partnership between individuals and other indi-viduals or groups of businesses, (2) motivation to cooperate that grows dynamism and creativ-ity, and (3) having insights into businesses to master the system that provides business facili-ties, production process systems, processing systems, and marketing systems.
Sutrisno (1995) states that community empowerment is characterized by: (1) Changes to the perceptions of science and technology, (2) changes in self-reliance and releasing depen-dency on other parties, (3) changes to the perceptions of business systems and belief in one’s own opinions, (4) based on the under-standing of a business as a responsibility, it must bend rationally, (5) poor people are no longer viewed as a group that is not productive because they have an entrepreneurial spirit, development experience and technical skills.
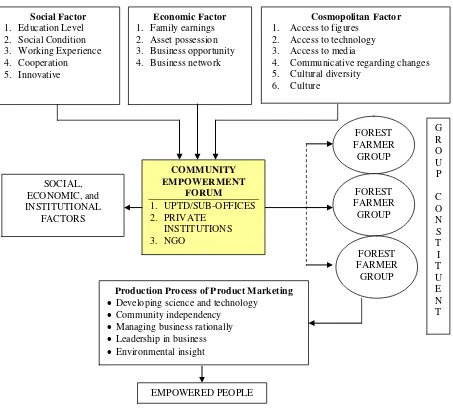
Following You (2016), we used the SEM approach and from this we derived the design of this research, as it is schematized as follows.
Figure 1: Empowerment diagram model
Social Factor
1. Education Level 2. Social Condition 3. Working Experience 4. Cooperation 5. Innovative
Economic Factor
1. Family earnings 2. Asset possession 3. Business opportunity 4. Business network
Cosmopolitan Factor
1. Access to figures 2. Access to technology 3. Access to media
4. Communicative regarding changes 5. Cultural diversity
6. Culture
FOREST FARMER GROUP
FOREST FARMER GROUP
FOREST FARMER GROUP
COMMUNITY EMPOWERMENT
FORUM
1. UPTD/SUB-OFFICES 2. PRIVATE
INSTITUTIONS 3. NGO
SOCIAL, ECONOMIC, and INSTITUTIONAL
FACTORS
G R O U P
C O N S T I T U E N T
Production Process of Product Marketing
• Developing science and technology • Community independency
• Managing business rationally • Leadership in business • Environmental insight
Figure 1 describes a model for the empo-werment of the people settling around the forest within their communities. Camat becomes a coordinator and the members consist of the UPTD/sub-office, private individuals and non-governmental organizations. The forum is a functional institution, so it does not interfere or overlap with the existing authority of the rele-vant government agencies. This forum acts as a communication forum that promotes the interests of the community. To strengthen the position of the forum, it can be confirmed through the deci-sion of the regent that binds various interests to its existence.
RESEARCH METHOD
As mentioned earlier, the research was con-ducted in the Kuningan regency, which is in the Province of West Java, Indonesia. The regency is a buffer for the life of the people in the surrounding area. The regency is an upstream area, as Mount Ciremai (3,765 meters above sea level) is located in the regency. It has a large number of springs, mountains, and hills with protected forests that help control the microcli-mate of the surrounding area.
The study was conducted in 362 villages around the forested areas. The sampling was done using a proportional random sampling technique. We use primary and secondary data, which we collected through: (1) The delivery of questionnaires which were filled out by the res-pondents through enumerators; (2) direct inter-views using an interview guide; (3) focus group discussions; and 4) recordings, photocopies, pictures and maps of the secondary data. The key questions were aimed at generating responses to gain the appropriate data on the social factors (education, social conditions, working experience, cooperation and innova-tion), economic factors (family earnings, asset possession, business opportunities and business networks), institutional and cosmopolitan factors (access to institutions, technology, media, and cultural diversity) [Figure 1].
We follow You’s (2016) study in using SEM or Structurral Equation Modeling. As the model necessitates a complex structure of both
endogenous and exogenous variables, due to the data’s characteristics (among others a large sample), a simple regression using OLS (Ordinary Least Square) is not plausible to avoid any statistical flaws from the OVB (Omitted Variable Bias). Besides, we use the latent variables represented by the constructs such as education, social conditions, business networks, access to media and culture. Most of the factors represent latent variables. Besides, we expect to confirm the theories. Hence, a covariance based approach is adopted (CB-SEM) with the help of Amos software. Besides, for social and commu-nity empowerment studies, the investigation of the Lapindo mud problem, which came up with the idea of converting the mud into bricks for the peoples’ social empowerment, used SEM as its main statistical tool, as per Darmawan et al. (2014). Due to the nature of our data, and the regression analysis that is composed of exogenous and endogenous variables, which are latent variables and include social and cognitive capital, the method employed by Darmawan et al. (2014) helped us to find the estimated result. We find a positive result from turning a persistent problem for the local people into an advantage for them, while social empowerment is also implemented, not only as an act of charity but also in a competitive manner (Bachtiar, 2005). The following part will discuss the findings and our suggestions to create advantages for the people there.
RESULTS
Correlation of the Variables of the Farming Community’s Empowerment Factors in the Communities around the Forest Areas
The measurement model aims to see whether modifications can be made to reduce the value of the chi square. A smaller value for the chi square shows the improved suitability of the model with the existing data (as in Santoso 2011).
336.297 to 277.241. Chi square’s decrease will automatically increase the probability value, which was originally 0.002, to 0.184 after the modification of the model. Chi square’s proba-bility value for the modification of the model is relatively higher than 0.05. Thus, it can be said that, based on its statistical chi square, the above model category is fit (good).
The chi square’s value decrease (increasing the probability value) is followed by changes in the size of other goodness of fits, as can be seen in Table 1.
Table 1 shows that the chi square’s value increased from 277.241 to 336.297, accompa-nied by an increase in the probability value from 0.002 to 0.184. With a probability greater than 0.05, it can be said that the modified research model is relatively fit and acceptable.
CMIN/DF is an index that measures the goodness of fit of models, with the estimated coefficients that are expected to reach the level of conformity. This value is the ratio of the chi square’s value from 277.241 divided by 257 that gives us 1.079. From the results of the model’s modification, the value for the CMIN/DF is 1.079, which is less than 2.00. Thus it can be said that, based on the size of the CMIN/DF, the proposed model is relatively fit (good) and acceptable.
The GFI (Goodness of Fit Index) can be classified as a measure of the absolute match because, basically, the GFI compares hypothe-sized models with no models at all (Wijanto, 2008). The GFI’s value ranges from 0 (poor fit)
to 1 (perfect fit), and a value for the GFI ≥ 0.900 is a model with a good fit. From the research, the value of the GFI models prior to modification is 0.888, increasing to 0.906 after their modifica-tion. Thus it can be said that the proposed model, after modification, is a good fit or has a good match.
The AGFI is an extension of the GFI, adjusted by the ratio between the degree of free-dom of the null/independent/baseline model with the degree of freedom of the hypothesized or estimated model. Like the value of the GFI, the value of the AGFI also ranges from 0 (poor fit) to 1 (perfect fit), and a value for the GFI ≥ 0.900 shows that a model is a good fit, while 0.800 ≤ AGFI < 0.900 is commonly referred to as a marginal fit or classified as moderate. The obtained AGFI value is 0.882. Thus the esti-mated or hypothesized model in this study is classified as a marginal fit.
The TLI (Tucker-Lewis Index) originally is a means to evaluate the factor analysis. It can also be used as an indicator of a model’s fit in SEM. TLI’s values range from 0 to 1, with a value of ≥ 0.900 showing a model with a good fit, while 0.800 ≤ TLI < 0.900 is commonly referred to as a marginal fit or as being moderate. The obtained TLI value is 0.964. Thus the estimated or hypothesized model in this study is the good fit model.
The CFI (Comparative Fit Index) is an index of incremental suitability, comparing models tested with null models. The CFI is a good index for assessing the suitability of a model because
Table 1. Goodness of Fit of Research Model’s Modification.
Nr. Size (Index) Reference Value
Result Value
Information Initial Modification
1 Chi Square (χ2) Small 336.297 277.241 -
2 Probability (χ2) ≥ 0.050 0.002 0.184 Good
3 CMIN/DF ≤ 2.000 1.264 1.079 Good
4 GFI ≥ 0.900 0.888 0.908 Good
5 AGFI ≥ 0.900 0.863 0.884 Moderate
6 TLI ≥ 0.900 0.902 0.971 Good
7 CFI ≥ 0.900 0.913 0.975 Good
8 IFI ≥ 0.900 0.917 0.976 Good
the index is not influenced by the size of the sample. CFI value’s range from 0 to 1, with a
value ≥ 0.900 being a model with a good fit, while a CFI value ≤ 0.800 < 0.900 is commonly referred to as a marginal fit or as being moderate. The obtained CFI value is 0.969, thus the estimated or hypothesized model in this study is a good fit model.
The IFI (Incremental Fit Index), like the CFI, is an index of incremental suitability, which compares the models tested with null models. IFI values range from 0 to 1, with a value ≥ 0.900 being a good fit, while 0.800 ≤ IFI < 0.900 is commonly referred to as being a marginal fit or as moderate. The obtained IFI value is 0.971. Thus the estimated or hypothesized model in this study is the good fit model.
The RMSEA (Root Mean Square Error of Approximation) is one of the indices that are informative in SEMs. The RMSEA index is used to correct the tendency of the chi square statistic that is sensitive to a large sample size. Wijanto (2008) writes that the value of RMSEA ≤ 0.05 indicates a close fit. The value of 0.08 RMSEA
≥0.05 indicates a good fit. While the value of RMSEA in between 0.08 and 1.00 shows a marginal fit. RMSEA values of 1.00 show a poor fit. The obtained RMSEA value is 0.022. Thus the estimated or hypothesized model in this study is a close fit model (very good).
An analysis of the overall goodness of fit measurements shows that the estimated model, tested after its modification, is a fit and accepta-ble model.
Analysis of the Model of the Farmer’ Empowerment in the Villages around the Forest Areas
Those responsible for empowerment at the regency level are: (1) The Office of Water Resources and Mines; (2) the Office of Forestry and Agriculture; (3) the Office of Agriculture, Animal Husbandry, and Fisheries; (4) the Office of Industry and Trade; (5) the Office of Cooper-atives and SMEs; (6) PT Perhutani; (7) Financial Institutions; (8) Business organizations; (9) Cooperatives; (10) Universities; and so on. The
empowering actors at the district level are the Technical Implementation Unit (UPTD –Unit Pelaksana Teknis Dinas), the sub-offices, private institutions, and NGOs in accordance with the technical fields or studies. Piers and Brookfield (1998) say that a communication forum has a principle aim of encouraging the collaboration and togetherness of the empowering actors. Institutions emphasize the fostering of commu-nity spirit, without prioritizing any sector’s interests that are instantaneous. The spirit of work empowering each actor is the motivation to make efforts to solve the problems faced by the community.
Membership of the community’s develop-ment forum and the small farmer’s groups at the district and regency levels is a reference point for the parties consisting of the regency, the district, and the NGOs. At the village level, it includes extension workers, community leaders, and group leaders. The formation of coaching groups for the small farmers in the villages is basically left entirely up to the public and, if needed, they can be facilitated by the offices or agencies of the regency and/or NGOs.
Fugure 2. Result of the Structural Model’s Modification
The theoretical facts of research, and the empirical facts from observation, are the plat-forms for change in integrated empowerment. Therefore, a village, or a single group, can be a single regional community development. It is managed by the same management. The unifica-tion of the management and society’s develop-ment into a system of empowerdevelop-ment should be done by involving all the stakeholders, which consist of the public, non-institutional entities, private individuals, and the government
CONCLUSION
In the view of our quest, the economic, social, institutional and cosmopolitan factors studied have a positive relationship with the business communities in the villages of the people who live near the forests. They enhance not only the prevailing economic factors, but also the social factors including the social con-ditions, education and cooperation when neces-sary. Thus, this factor dominates the relationship as it has the highest value. As an implication, the essence of the empowerment model
recom-mended to the government’s institutions is to support the acceleration of development. For this, government institutions are required to renew the vision more effectively, and for the department to have appropriate risk management systems in order to strengthen the structure and the infrastructure at all levels. It is necessary to increase the capabilities of personnel, and strengthening the regulations (rules of the game). The implementation of community develop-ments is often hampered by rigid bureaucratic processes where there is no understanding among the various sectors and it often leads to unethical acts.
Farmers’ groups, as the farming communities’ activity centers, must build cooperation, mutual help, and remind each other about their social and economic activities. On the other hand, the institution of the farmers’ groups also serves as a medium of empowerment for the rural commun-ities around the forests.
REFERENCES
Akob Kadir, H., 2015. “The Role of Small and Medium Enterprises (UKM) with Human Resources (HR) Based in Face of MEA 2015 in Indonesia”. International Journal of Advanced Research, 3(4), 399-410.
Ascher, W. and R. Healy, 1990. Natural Reseourceos Policy Making in Developing Countries. Duke University, Durham. Bank, W., 2013. Indonesia: Evaluation of the
Urban Community Driven Development Program, Program Nasional Pemberdayaan Masyarakat Mandiri Perkotaan (PNPM-Urban). Policy Note.
Blaikie, Piers and Brookfield, 1998. Human Capital: The Theoritical and Emperical Analysis With Special Reference to Education. Chicago. The Uniercity of Chicago Press.
Bock, M. J., 2014. “Income Inequality in ASEAN: Perceptions on Regional Stability from Indonesia and the Philippines”.
ASEAN-Canada Research Partnership, Working Paper Series No. 1.
BPS., 2016. Laporan Bulanan Data Sosial Ekonomi. Jakarta: BPS (Badan Pust Statistik).
Brown Rob, 1984. Poverty. Dalam International Encyclopedia Social Science. Editor Davis L Sill, Vol. XII. Macmilan and Pree Press. Chamsyah Bachtiar, 2005. Investasi Sosial. La
Tofi Enterprise. Jakarta.
Chongvilaivan, A., and J. Kim, 2015. “Indivi-dual Income Inequality and Its Drivers in Indonesia: A Theil Decomposition Reassessment”. Soc Indic Res, 79-98.
Darmawan, P. R., Sukesi, K., Suyadi, and Soemarno, 2014. “Empowerment and Social Capital Model of Lapindo Mud Affected Community on Brick Maker Community”.
American Journal of Sociological Research, 4(2), 34-41.
Debertin L. David, 1986. Agricultural Product Economics. Macmillan Publishing Com-pany, New York.
Fernández-Moral , M., Vidueira, P., Díaz-Puente, J., and V. De Nicolás, 2015. “Empowerment Evaluation in Spain: The Critical Friend Role in Working with Rural Communities”. Procedia - Social and Behavioral Sciences, 191, 984-989.
Harvey Charles, 1979. Rural Employment and administration in the State in South Eas Asia, los Angeles, London.
Hayami and Kikuchi, 1985. Direction of Agrain Change: A View from Villages in the Philipines. The John Hopkins Univercity Press. Baltimore and London.
Khairiyakh, R., Irham, and J. Handoyo Mulyo, 2015. “Contribution of Agricultural Sector and Sub Sectors on Indonesian Economy”.
Ilmu Pertanian, 18(3), 150-159.
Korten David, 1987. “Strategic Oganization for People Centered Development”. Public Administration Review Jurnal, 40, (5). Kumara, P., and S. Mehtab, 2016. “Poverty,
gender, and empowerment in sustained adoption of cleaner cooking systems: Making the case for refined measurement”.
Energy Research and Social Science, 19, 48-52.
Lineberry William, 1987. The Politics of Share Growth, some Indoesia Cases, Comparative Politics. London.
Loekman Soetrisno, 1988. “Negara dan Peranan-nya dalam Menciptakan Pembangunan Desa yang Mandiri”. Prisma,Tahun VIII, 1.
Manig Winfried, 1991. “Rural Social and Economic Structures and Social Develop-ment”. Socio-economic Studies on Rural Development, 85.
Mardikanto Totok, 2007. System Penyuluhan Pertanian. Pusat Pengembangan Agribisnis dan Perhutanan Sosial. Surakarta.
Mubyarto, 1982. Pengantar Ekonomi Pertanian. LP3ES. Penerbit PT. Pustaka, Jakarta. Murbeng, S., Saleh Soeaidy, M., and Riyant,
2013. “Pelaksanaan Program Nasional Pemberdayaan Masyarakat Mandiri Perde-saan ( PNPM MP), ( Studi pada Desa Bendungan Kecamatan Gondang Kabupaten Tulungagung )”. Jurnal Administrasi Publik (JAP), 1(6), 1257-1265.
OECD, 2010. Economic Importance of Agriculture for Sustainable Development and Poverty Reduction: Findings from a Case Study of Indonesia. Paris: OECD. Perkins, D., and M. Zimmerman,1995.
“Empowerment Theory, Research, and Application”. American Journal of Community Psychology, 23(5), 569-579. Rappaport, J., 1981. “In Praise of Paradox: A
Social Policy of Empowerment over Prevention”. American Journal of Community Psychology, 9(1), 1-25.
Rosyid Suherman, 2005. Pengantar Teori Ekonomi, Pendekatan Kepada Teori Ekono-mi Mikro dan Makro. PT. Raja Grafindo Persada, Jakarta.
Santoso Singgih, 2011. Structural Equation Modeling. Konsep dan Aplikasi dengan AMOS. Penerbit Elex Media Komputindo. Soekamto Soerjono, 2003. Sosisologi. Suatu
Pengantar. PT. Raja Grafindo Persada, Jakarta.
Soetomo, 2009. Pembangunan Masyarakat, Merangkai sebuah Kerangka. Pustaka Pelajar, Yogyakarta.
Van Den Ban, AW and HS. Hawkins, 1989.
Penyuluhan Pertanian. Kanisius, Yogya-karta.
You, J. W., 2016. “The relationship among college students' psychological capital, learning empowerment, and engagement”.
ANNEXES
Annex1: Percentage of ASEAN HDI development (1990-2013)
No HDI
Rank Country 1990 1995 2000 2005 2010 2011 2012 2013 Average
1 11 Singapore 7.660 5.951 2.686 6.659 0.669 0.221 0.442 0.330 3.077 2 31 Brunei Darussalam 2.941 1.739 2.076 0.837 0.474 0.590 0.000 0.469 1.141
3 62 Malaysia 6.240 6.167 1.107 5.335 0.390 0.129 0.388 0.257 2.502 4 93 Thailand 6.818 6.056 5.556 4.678 0.698 0.416 0.000 0.276 3.062
5 110 Indonesia 6.591 7.067 4.785 4.724 0.902 1.043 0.442 0.441 3.250 6 115 Philippines 2.048 4.181 2.729 2.188 -0.153 0.613 1.065 0.602 1.659
7 116 Viet Nam 11.579 8.491 7.130 6.006 0.613 0.457 0.455 0.452 4.398 8 141 Lao PDR 7.053 8.706 8.442 7.585 2.412 1.812 1.423 0.877 4.789
9 143 Cambodia 6.044 8.549 17.184 9.165 0.933 0.924 0.733 0.909 5.555
10 148 Myanmar 11.080 8.696 12.471 8.787 0.769 0.763 0.568 0.942 5.509
Source: Adapted from the data from the national statistics report (BPS, 2016)
Annex2: The number of poor people in the West Java region
First semester (March) Second semester (September)
Urban area Rural area Number Urban area Rural area Number
Year 2014
West Java 2,578.36 1,748.71 4,327.07 2,554.06 1,684.9 4,238.96
Real 2,578,360.00 1,748,710.00 4,327,070.00 2,554,060.00 1,684,900.00 4,238,960.00
% 59.59 40.41 60.25 39.75
Year 2015
West Java 2,638.38 1,797.32 4,435.7 2,706.52 1,779.13 4,485.65
Real 2,638,380.00 1,797,320.00 4,435,700.00 2,706,520.00 1,779,130.00 4,485,650.00
% 59.48 40.52 60.34 39.66 40.09
Source: Adapted from the data from the national statistics report (BPS, 2016)