LAMPIRAN
LAMPIRAN I
Daftar Sukuk yang Menjadi Sampel
No.
Nama Perusahaan
Tanggal
Listed
Tanggal
Jatuh
Tempo
Rating Obilgasi Syariah
2011
2012
2013
1
PT Salim Ivomas Pratama Tbk.
-
Sukuk Ijarah Salim Ivomas
Pratama I 2009
02-12-2009
01-12-2014
AA-
AA-
AA-
2
PT Summarecon Agung Tbk.
-
Sukuk
Ijarah
I
Summarecon Agung Tahun
2008
26-06-2008
25-06-2013
A-
A-
A-
3
PT Indosat Tbk.
-
Sukuk Ijarah Indosat II
Tahun 2007
-
Sukuk Ijarah Indosat III
Tahun 2008
-
Sukuk Ijarah Indosat IV
Tahun 2009 Seri A
-
Sukuk Ijarah Indosat IV
Tahun 2009 Seri B
30-05-2007
10-04-2008
09-12-2009
09-12-2009
29-05-2017
09-04-2013
08-12-2014
08-12-2016
AA+
Tanker Tahun 2007
-
Sukuk Ijarah Berlian Laju
06-07-2007
29-05-2009
29-05-2009
05-07-2013
28-05-2013
28-05-2014
A-
5
PT Matahari Putra Prima Tbk.
-
Sukuk
Ijarah
Matahari
Putra Prima II Tahun 2009
Seri B
15-04-2009
14-04-2014
A+
A+
A+
6
PT Mitra Adiperkasa Tbk.
-
Sukuk
Ijarah
Mitra
Adiperkasa I Tahun 2009
Seri B
Lampiran II
Lampiran ini berisikan rata-rata data rasio (
Debt Ratio
), (
Profit Margin
), Rasio Profitabilitas (
Return on Equity
) dan Rasio Likuiditas
(
Cash Ratio
) dari tahun 2011-2014.
Nama Perusahaan
Nama Sukuk
Debt Ratio (X1)
ROE (X2)
Cash Ratio
(X3)
Profit
Margin (X4)
Rating Obligasi
(Y)
Average
Average
Average
Average
Average
PT Salim Ivomas Pratama
Tbk
Sukuk Ijarah Salim Ivomas
0,42
0,24
1,22
0,23
15
PT Sumarecon Agung Tbk
Sukuk Ijarah I Sumarecon
0,67
0,20
1,23
0,28
12
PT Indosat Tbk
Sukuk Ijarah Indosat II
0,68
0,09
0,54
0,07
17
Sukuk Ijarah Indosat III
0,68
0,09
0,54
0,07
17
Sukuk Ijarah Indosat IV A
0,68
0,09
0,54
0,07
17
Sukuk Ijarah Indosat II B
0,68
0,09
0,54
0,07
17
PT. Berlian Laju Tanker
Sukuk Ijarah Berlian 2007
2,545
0,79
0,52
1,02
12
Sukuk Ijarah Berlian II 2009 Seri A
2,545
0,79
0,52
1,02
12
Sukuk Ijarah Berlian II 2009 Seri B
2,545
0,79
0,52
1,02
12
PT Matahari Putra Prima
Sukuk Ijarah Matahari II Seri B
2009
0,495
0,11
1,47
0,03
14
Lampiran III
1.
Statistik Deskriptif
Descriptive Statistics
N Minimum Maximum Mean Std. Deviation
Debt_Ratio 11 ,42 2,55 1,1427 ,90464
ROE 11 ,09 ,79 ,3136 ,31004
Cash_Ratio 11 ,52 1,47 ,8018 ,38212
Profit_Margin 11 ,03 1,02 ,3573 ,43260
Rating_Sukuk 11 12,00 17,00 14,4545 2,25227
Valid N (listwise) 11
2.
Uji Asumsi Klasik
2.1 Uji Normalitas
One-Sample Kolmogorov-Smirnov Test
Unstandardized Residual
N 11
Normal Parametersa,b Mean ,0000000
Std. Deviation ,48533125
Most Extreme Differences Absolute ,349
Positive ,265
Negative -,349
Kolmogorov-Smirnov Z 1,158
Asymp. Sig. (2-tailed) ,137
a. Test distribution is Normal.
Korelasi Antar Variabel Independen
Coefficient CorrelationsaModel Profit_Margin Cash_Ratio Debt_Ratio ROE
1 Correlations Profit_Margin 1,000 ,307 ,046 -,835
Cash_Ratio ,307 1,000 ,774 -,650
Debt_Ratio ,046 ,774 1,000 -,581
ROE -,835 -,650 -,581 1,000
Covariances Profit_Margin 21,056 1,373 ,339 -29,537
Cash_Ratio 1,373 ,952 1,204 -4,890
Debt_Ratio ,339 1,204 2,542 -7,143
ROE -29,537 -4,890 -7,143 59,427
a. Dependent Variable: Rating_Obligasi
2.3 Uji Autokorelasi
Hasil Uji Autokorelasi
Model SummarybModel R R Square Adjusted R Square Std. Error of the Estimate Durbin-Watson
dimension0 1 ,977
a ,954 ,923 ,62656 2,507
a. Predictors: (Constant), Profit_Margin, Cash_Ratio, Debt_Ratio, ROE
b. Dependent Variable: Rating_Obligasi
2.2 Uji Multikolinearitas
Hasil Uji Multikolinearitas
CoefficientsaModel Unstandardized
Coefficients
Standardized
Coefficients
t Sig.
Collinearity Statistics
B Std. Error Beta Tolerance VIF
1 (Constant) 21,427 1,254 17,091 ,000
Debt_Ratio -3,154 1,594 -1,267 -1,978 ,095 ,019 52,996
ROE 14,442 7,709 1,988 1,873 ,110 ,007 145,511
Cash_Ratio -5,484 ,976 -,930 -5,621 ,001 ,283 3,540
Profit_Margin -9,799 4,589 -1,882 -2,135 ,077 ,010 100,375
2.4 Uji Multikolinearitas
Uji Glejser
Coefficients
aModel Unstandardized
Coefficients
Standardized
Coefficients
t Sig.
B Std. Error Beta
1 (Constant) -,918 ,218 -4,212 ,006
Debt_Ratio ,711 ,277 1,738 2,563 ,043
ROE -,389 1,341 -,326 -,290 ,781
Cash_Ratio 1,156 ,170 1,195 6,817 ,000
Profit_Margin -1,117 ,798 -1,307 -1,400 ,211
a. Dependent Variable: absut
Lampiran IV
Lampiran ini berisi data hasil pengujian hipotesis simultan dan parsial.
Hasil Uji F
ANOVAbModel Sum of Squares df Mean Square F Sig.
1 Regression 48,372 4 12,093 30,804 ,000a
Residual 2,355 6 ,393
Total 50,727 10
a. Predictors: (Constant), Profit_Margin, Cash_Ratio, Debt_Ratio, ROE
b. Dependent Variable: Rating_Obligasi
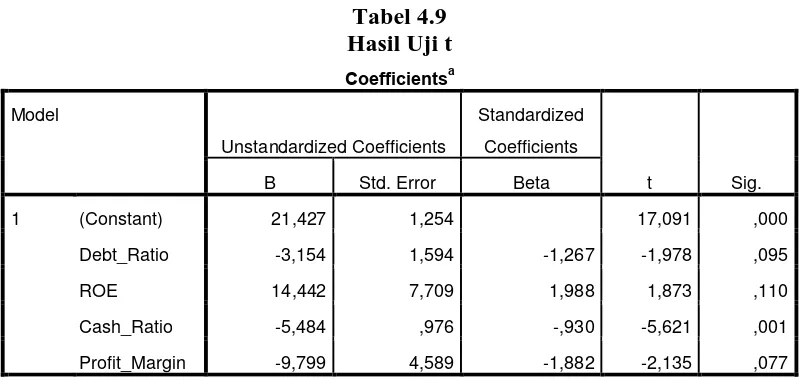
Tabel 4.9
Hasil Uji t
CoefficientsaModel
Unstandardized Coefficients
Standardized
Coefficients
t Sig.
B Std. Error Beta
1 (Constant) 21,427 1,254 17,091 ,000
Debt_Ratio -3,154 1,594 -1,267 -1,978 ,095
ROE 14,442 7,709 1,988 1,873 ,110
Cash_Ratio -5,484 ,976 -,930 -5,621 ,001
Profit_Margin -9,799 4,589 -1,882 -2,135 ,077
a. Dependent Variable: Rating_Sukuk
Uji Regresi Menggunakan Metode R
2 Model SummarybModel R R Square Adjusted R Square Std. Error of the Estimate
dimension0 1 ,977
a ,954 ,923 ,62656
a. Predictors: (Constant), Profit_Margin, Cash_Ratio, Debt_Ratio, ROE