2351-9789 © 2015 The Authors. Published by Elsevier B.V. This is an open access article under the CC BY-NC-ND license (http://creativecommons.org/licenses/by-nc-nd/4.0/).
Selection and Peer-review under responsibility of the Scientific Committee of MIMEC2015 doi: 10.1016/j.promfg.2015.07.022
Procedia Manufacturing 2 ( 2015 ) 124 – 129
Available online at www.sciencedirect.com
ScienceDirect
2nd International Materials, Industrial, and Manufacturing Engineering Conference, MIMEC2015,
4-6 February 2015, Bali Indonesia
Characterization of Material Parameters by Reverse Finite Element
Modelling Based on Dual Indenters Vickers and Spherical
Indentation
I Nyoman Budiarsa
a* I D.G Ary Subagia
a, I Wayan Widiada
a, Ngakan P.G Suardana
aa
Mechanical Engineering.University of Udayana.Bali. Indonesia
Abstract
Significantly advantage in the use of indentation testing its use for the characterization of materials is simple and requires only a small sample. In material characterization by indentation, the material behaviour is represented by the load (P)- depth (h) in the P-h curve. However, despite the breadth of use of indentation in the evaluation of the behaviour of the material has not been able to explicitly relate the behaviour of materials with constitutive material properties. This encourages further research to be able to predict the P-h curves and hardness and indentation resistance of the constitutive parameters of the material, it is also very important for research and practical use to explore the potential for using indentation data for predicting the constitutive properties of a material. This could potentially provide a faster way for identification of material parameters and applied in situations where a standard specimen is not available. In this research, the relationship between the constitutive parameters of the
material (represented by the yield stress (ıy) and work hardening coefficient (n)) of elasto-plastic materials, Indentation P-h curve, and Hardness value with dual indenters have been systematically investigated by combining the representative stress (ır)
analysis and FE modelling using steel as a system materials. FE model of Vickers and Spherical indentation has been developed and validated. Validation conducted on the feasibility of the FE models to investigate approaches to the material system, and establishing factors affecting the accuracy and robustness of the approach finite element programs used. A new approach for predicting the hardness values are developed based on the 3D relationship between hardness, yield stress (ıy) and strain
hardening coefficient (n). The prediction proposed method has been successfully used to produce hardness values of various material properties and is used to establish the relationship between the hardness values with representative stress. Prediction process of the material parameters based on the intersection between the indentations curves of the material properties of both the dual indenter Vickers and spherical indentation. It provides a useful tool to evaluate the feasibility of using a hardness value in predicting the constitutive material parameters with respect to the accuracy and uniqueness by mapping through all the range of potential materials.
* Corresponding author. Tel.: +62-0361-703321; fax: +62-0361-703321.
125 I. Nyoman Budiarsa et al. / Procedia Manufacturing 2 ( 2015 ) 124 – 129
© 2015 The Authors. Published by Elsevier B.V.
Selection and Peer-review under responsibility of the Scientific Committee of MIMEC2015.
Keywords:Yield stress (ıy), Work Hardening Coefficient (n), P-h Curve, FE Modelling, Dual indenters
1. Introduction
Evaluation of the material characteristics often associated with the use of indentation as an important method of testing materials. In indentation, when an indenter is pressed into the surface of the specimen, then the size of the permanent indentation is formed and can be measured to represent the indentation resistance (ie hardness value). The response behavior of the material on the test is based by the load (P) and displacement (h) on the curve (p-h) indentation. In the process of indentation, the material deforms complex shape deformation zone different mechanism which is one of the most effective ways to analyze indentation [1]. Earlier work showed that hardness
value can be associated with a representative stress (ır) [2], [3]. The concept coupled with finite element modeling
(FE) has been successfully used in analyzing the sharp indenter where representative strain and stress are well defined using fixed indenter angle[4]. In this case, the resulting relationship between material parameters and finally P-h curves can be used to estimate the hardness of the material parameters. Subsequent developments, many works have been explored in the search for ways to predict reverse (inverse prediction) material properties of the indentation[1]. Most studies have focused on using full P-h curve while most of the data properties and hardness
values have been available primarily using the yield stress (ıy) and ultimate tensile strength (ıt)[5]. The
relationship eventually built between material properties, indentation curves and hardness values that would be a
useful tool to investigate the feasibility of both constitutive material parameters (represented by the yield stress (ıy)
and strain hardening coefficient (n) which is based on the value of hardness (hardness value) is known. Established relationships developed to assess the characteristics of the material and assisted with the optimization program is used to directly identify all candidate sets of material properties that might correspond to the test using a dual indenter. It would also pave the way for future improvements in the measurement program using a reverse inverse additional measurable data.
2. Materials and Experimental
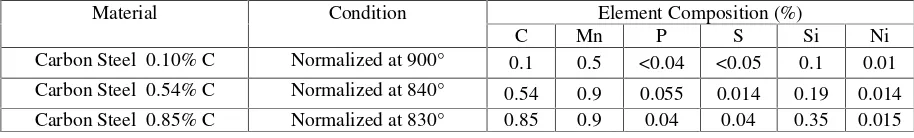
The material used in the research of plastic properties of metal is carbon steel with a carbon content of various composition (carbon steel with a carbon content of 0.10% C, 0.54% C and 0.85% C). chemical composition of the materials listed in Table 1.
Table 1. Composition and condition of the sample material (0.10% C, 0.54% C, and 0.85% C)
Material Condition Element Composition (%)
C Mn P S Si Ni
Carbon Steel 0.10% C Normalized at 900° 0.1 0.5 <0.04 <0.05 0.1 0.01
Carbon Steel 0.54% C Normalized at 840° 0.54 0.9 0.055 0.014 0.19 0.014
Carbon Steel 0.85% C Normalized at 830° 0.85 0.9 0.04 0.04 0.35 0.015
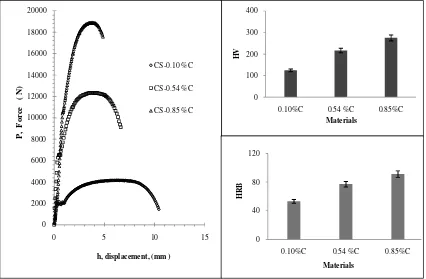
Sample material used is carbon steel with a carbon content of various composition (carbon steel with a carbon content of 0.10% C, 0.54% C and 0.85% C). Solid rod-shaped ellipse of 5 mm and 26.39 mm in the holder has the edge. Tensile test performed using a tensile test device. Tensile test results are displayed as diagrams force (P)–
displacement (h). Hardness test samples prepared as a disk with a diameter of 5 mm . Vickers hardness test performed using Struers Duramin-1 Vickers hardness. Indenter has a right pyramid shape with a square base and a 136oangle between opposite sides of the face. While the Rockwell B hardness test performed by using: Wilson Rockwell hardness tester. Indentation using scale indenter ball B, with R = 0.79 mm (steel balls = 1/16 in), under the initial minor load (Fm) = 10 kg and major load (FM) = 100 kg.
© 2015 The Authors. Published by Elsevier B.V. This is an open access article under the CC BY-NC-ND license (http://creativecommons.org/licenses/by-nc-nd/4.0/).
126 I. Nyoman Budiarsa et al. / Procedia Manufacturing 2 ( 2015 ) 124 – 129
Figure 2. Typical Tensile test results are displayed as diagrams force (P)–displacement (h) and the average value for HV, HRB for carbon steel with a carbon content of a 0.10% C, 0.54% C and 0.85% C with replication and the measurement error range of 5%
3. Analysis and Results
3.1. Numerical Model Of Dual Indenter And Results
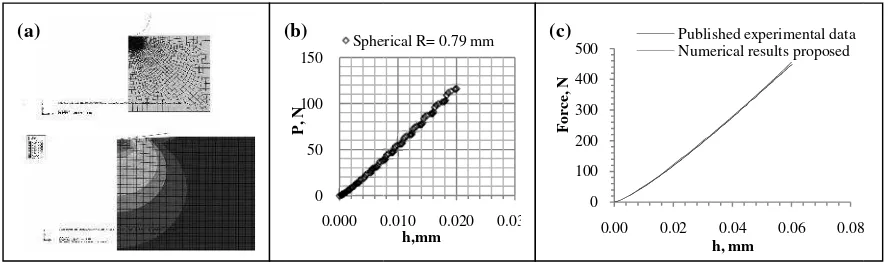
FE model Vickers indentation was designed as shown in Figure 3(a). The Model has the form of the right pyramid with a square base and an angle of between opposite face. Only a quarter of the indenter and material column was simulated as a result of plan symmetric geometry. The sample size is more than 10 time the maximum indentation depth, which is sufficiently large to avoid any sample size effect or boundary effect [6]. The bottom face was fixed in all degrees of freedom and two side faces were symmetrically fixed in z and x direction. The element type used is C3D8R (reduced integration element used in stress/displacement analysis). The mesh in the regions with large deformation such as that directly under the indenter tip was refined with high mesh density in order to obtain more accurate results. Model FE Vickers indentation is verified by comparing the numerical results of this study with several models of experimental results have been published. Results are shown in Figure 3(c). Material properties FE model was adopted from the data that is used by [1], and then the P-h curve predicted compared with numerical and experimental data is published. As shown in the curves, for both materials, the prediction results relate very well with experimental data. This indicates that the model is accurate and valid. Different from the Vickers indenters, spherical indenter is fully asymmetric, a typical FE model is shown in Figure 4(a). A planar specimen has been used and this specimen size is large enough to avoid potential sample size effect. The movement of the indenter was simulated by displacing a rigid arc along the Z axis. The bottom line was fixed in all degree of freedoms and the central line was symmetrically constrained. The element types used is CAX4R (4-node bilinear asymmetric quadrilateral). A gradient meshing scheme has been developed for different regions in order to obtain more accurate result. Model FE Spherical indentation is verified by comparing the numerical results and corresponding result using a known analytical solution for indentation of linear elastic materials. Figures 4(c), the FE results show a good agreement with the analytical solution.
0 100 200 300 400
0.10%C 0.54 %C 0.85%C
H V Materials 0 2000 4000 6000 8000 10000 12000 14000 16000 18000 20000
0 5 10 15
P , F o rc e ( N )
h, displacement, (mm ) CS-0.10 %C CS-0.54 %C CS-0.85 %C 0 40 80 120
0.10%C 0.54 %C 0.85%C
H
R
B
127 I. Nyoman Budiarsa et al. / Procedia Manufacturing 2 ( 2015 ) 124 – 129
Figure 3(a). Typical Vickers indentation Finite Element M loading and unloading of the Vickers indentation, (c) mode
Figure 4(a). Typical Spherical indentation Finite Element Force indentation- depth (P-h) curves during loading for FE model with analytical solution of elastic materials.
3.2. Model Material
Description Power Law is almost always used to ap the elastic-plastic material, the stress-strain curve isotropic hardening as a power law:
İ ı ı
İ ı ı
With 0.0<n<0.5 for metal, the yield stress (ıy)
hardening coefficient (n) allows to develop a parameters[8]. In general conditions, stress-strain pl
ൌ
İ ı ı ı ı İ ıı
Where ’E’ is the Young’s modulus, ’n’ strain hardeni ܭr states representative strain on certain plastic vo When ı >ıy, strain can be expressed as:
ൌ ͳ 0 50 100 150 200 0.00 P (N ) (b) 0 50 100 150 0.000 0 P , N Sphe (b) (a) (a)
Model and contact interface, (b) Force indentation depth (P-h) curve during el validation against published experimental data.
model, interfacial contact and plastic expansion in spherical indentation, (b the spherical indentation with indenter sizes R= 0.79 mm, (c) Validation o
pproach the plastic behavior of metals [7]. This study deals w can be represented by Hooke's law and criteria Von Misse
is defined at offset zero strain, elastic modulus(E) The str
relatively simple approach to infer the constitutive mate lastic is generally expressed
ing coefficient and ’ıy’ initial yield stress, the strain offset zero oltage, representative stress is ’ır’ At the point of plastic str
0.03 0.05 h, mm 0 2 4 6 8 10 12
0.000 0.005 0.010 0.015
P
,
N
h, Um
Material 1, This work numerical results Material 1, Published numerical results Material 1, Published experimental data Material 2, This work numerical results Material 2, Published numerical results Material 2, Published experimental data (c)
0.010 0.020 0.03 h,mm
erical R= 0.79 mm
0 100 200 300 400 500
0.00 0.02 0.04 0.06 0.08
F o rc e, N h, mm
Published experimental data Numerical results proposed (c)
g
) f
with es in
128 I. Nyoman Budiarsa et al. / Procedia Manufacturing 2 ( 2015 ) 124 – 129
3.3. Identification of Materials Parameters Base on Dual Indenters
Methods to determine the nature of the plastic material with dual indenter is developed through the conclusion prediction reverse by using the input material hardness values are known to identify the constitutive material properties. In the first stage, the FE models systematically developed to form a simulated space includes a variety of potential material properties. In the next stage, the load curve is used to develop the simulation space. Comparative approaches have been developed to predict the set of material has actually indented curvature. Through the voltage data (force) versus indentation depth associated with HV and HRB hardness value. Simulations with the model that has been validated done on various material properties (ıy: 100-900 MPa, and n: 0.0 - 0.3) the relationship between the yield stress (ıy), strain hardening coefficient (n), HV and HRB knowable. FE model simulation results are described in the mapping of 3D surface plot using steel as a model system known to have excellent material between the yield stress (ıy), strain hardening coefficient (n) of the HV or HRB with a correlation coefficient = 0.97 which is approximated by using non-linear regression 3D Gaussian. This relationship was found to follow the equation:
ıy = 91.34E+09 Ǥ
Ǥ
Ǥ Ǥ Ǥ (4)
ıy = 828.5
Ǥ Ǥ Ǥ Ǥ
(5)
Table 2. Typical experimental results for HV and HRB samples for carbon steel compared with the prediction results using dual indenters
Sample
Experiment FE Model Accuracy Study Hardness Properties Hardness Properties Accuracy (Error %)
HV HRB Sy n HV HRB Sy n ǻHV/HVǻHRB/HRB ǻSy /Sy ǻn/n
CS-0.10% C 124.77 53.21 126.55 0.25 123.11 55.21 127.75 0.26 0.013 -0.038 -0.010 -0.040 CS-0.54% C
216.59 77.08 345.90 0.14 219.72 78.78 340.88 0.14 -0.014 -0.022 0.015 0.008 CS-0.85% C
275.15 91.20 527.45 0.14 266.89 86.75 528.15 0.14 0.030 0.049 -0.001 -0.014
The mathematical model derived from surface mapping 3D plot simulation model then used to predict the material parameters. Prediction results of FE Modelling dual indenters with a hardness value of the selected input to the
plasticity (shown as the yield stress (ıy), strain hardening coefficient (n)) is shown in Table 2:
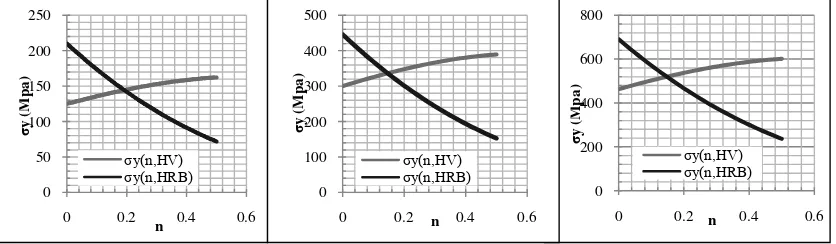
Figure 5.Typical relationship between the input value of dual hardness indenters each as a function of (n, HV) and (n, HRB) on the material parameters. intersection of the graph of the function is the set of predictions for the material parameters ((shown as the yield
stress (ıy), strain hardening coefficient (n)) as shown in Table 2:
0 200 400 600 800
0 0.2 0.4 0.6
ı y ( M p a ) n ıy(n,HV) ıy(n,HRB) 0 100 200 300 400 500
0 0.2 0.4 0.6
ı y ( M p a ) n ıy(n,HV) ıy(n,HRB) 0 50 100 150 200 250
0 0.2 0.4 0.6
129 I. Nyoman Budiarsa et al. / Procedia Manufacturing 2 ( 2015 ) 124 – 129
4. Conclusion
In this study, the relationship between the constitutive material parameters (ıy and n) of the elasto-plastic material, and hardness indentation P-h curve for dual indenters (sharp indenters (Vickers) and a spherical indenter) has been systematically investigated by combining representative stress and analysis FE modelling using steel as a material system. Vickers indentation FE models and Spherical have been developed and validated. Concepts and methodologies developed are then used to predict the values of hardness (Hv) and the value of Rockwell B hardness value (HRB) of materials through reverse analysis and validated with experimental data on a selected sample of steel. Through the method of 3D surface mapping plots by using steel as a material model system known
relationship between the yield stress (ıy), strain hardening coefficient (n) and value of HV or HRB with a
correlation coefficient = 0.97 which is approximated using a non-linear regression Gaussian 3D. This approach is known to have an error rate below five percent thus significantly unacceptable and shows an accurate model. Results prediction of material properties of FE Model dual indenters (carbon steel 0.10%C ıy=127.75 MPa, n=0.26;
0.54%C ıy =340.88 MPa, n=0.14 and 0.85%C ıy=528.15 MPa,n = 0.14). Prediction results of FE Modelling dual indenters developed quite well compared statistically between the input parameters and predicted properties of the material. has an error rate below five percent so significant predictor acceptable.
References
[1] Dao M., Chollacoop N., Van Vliet K. J., Venkatesh T. A. and Suresh S., Computational modelling of the forward and reverse problems in instrumented sharp indentation, Acta Materialia, Vol. 49 (2001) pp. 3899–
3918
[2] Budiarsa I N., Indentation Size Effect (ISE) of Vickers hardness in steels: correlation with H/E, Applied Mechanics and Materials Vol. 391 (2013) pp 23-28
[3] Budiarsa I N., Jamal M., P-h Curves and Hardness Value Prediction for Spherical Indentation Based on the Representative Stress Approach, App. Mech. and Mat.Vol. 493 (2014) pp 628-633
[4] Kang S., Kim J., Park C., Kim H., and Kwon D., Conventional Vickers and true instrumented indentation hardness determined by instrumented indentation tests, J. Mater. Res., Vol. 25 (2010), No. 2
[5] Busby J. T., Hash M. C., Was G. S., The relationship between hardness and yield stress in irradiated austenitic and ferritic steels, Journal of Nuclear Materials 336 (2005) 267-278
[6] Johnson K. L., Contact Mechanics, Cambridge: Cambridge University Press, UK, 1985
[7] Cao Y. P., Lu J., A new method to extract the plastic properties of metal materials from an instrumented spherical indentation loading curve, Acta Materialia, 52, (2004) 4023–4032
!"
#
$
%!&%%
'())*'+,'-./01
!&!!2#
,*0/,34-*
522&#%
4'43
611%2&#%
+////
+,
;
!$1%<#=
0
;
#%#%!2&!
+(
;
&$1%2#!
4
;
!%&#%1!
+
(
;
*
4
;
4
*
;
,
+
;
0
+
;
3
+
;
-
E
+
;
+'
E
+
;
++
E
+
;
+*
E
+
;
+4
E
+
;
+(
E
+
;
+/
E
+
;
+,
E
+
;
+0
E
+
;
=$&J&2%!
2#
=$&
$2>16<
2#
=$&1%6!
2
"777
!
<>7@)
)@?
!*''3)
%)
!I"
)!?'(B*''3
717I7@% A%.
1#A"
@?I"?+'B4+B*''3
!>"
!"