KONSUMSI KALORI DAN PROTEIN
PENDUDUK INDONESIA DAN PROVINSI
Consumption of Calorie and Protein of Indonesia and Province
Survei Sosial Ekonomi Nasional National Socio-Economic Survey Katalog BPS: 3202001
Buku 2 Book 2
Berdasarkan Hasil Susenas September 2015 Based on Susenas September 2015
2015
http://www.bps.go.id
KONSUMSI KALORI DAN PROTEIN
PENDUDUK INDONESIA DAN PROVINSI
Consumption of Calorie and Protein of Indonesia and Province
Survei Sosial Ekonomi Nasional National Socio-Economic Survey
Buku 2 Book 2
Berdasarkan Hasil Susenas September 2015 Based on Susenas September 2015
2015
http://www.bps.go.id
KONSUMSI KALORI DAN PROTEIN
PENDUDUK INDONESIA DAN PROVINSI Consumption of Calorie and Protein of Indonesia and Province
Berdasarkan Hasil Susenas September 2015 Based on September 2015 Susenas
ISSN - ISSN: 1979-6250
Nomor Publikasi - Publication Number: 04210.1606 .1306 Katalog BPS - BPS Catalogue: 3202001: 3202001
Ukuran Buku - Book Size: 18,2 x 25,71 cm
Jumlah Halaman - Total Pages: xii + 134 halaman/pages Naskah - Manuscript:
Subdirektorat Statistik Rumah Tangga Sub-directorate of Household Statistics Gambar Kulit - Cover Design:
Subdirektorat Publikasi dan Kompilasi Statistik
Sub-directorate of Statistical Compilation and Publication Diterbitkan oleh - Published by:
©Badan Pusat Statistik, Jakarta-Indonesia
©BPS - Statistics Indonesia Dicetak oleh - Printed by:
...
Dilarang mengumumkan, mendistribusikan, mengomunikasikan, dan/atau menggandakan sebagian atau seluruh isi buku ini untuk tujuan komersial tanpa izin tertulis dari Badan Pusat Statistik
Prohibited to announce, distribute, communicate, and/or copy part or all of this book for commercial purposes without permission from BPS-Statistics Indonesia
http://www.bps.go.id
ORGANISASI PENULISAN/ WRITING ORGANIZATION
Penanggung Jawab / Person in charge:
Gantjang Amanullah, M.A
Editor / Editors:
Nona Iriana, S.Si, M.Si
Ida Eridawaty Harahap, S.Si, M.Si
Penulis / Authors :
Siswi Puji Astuti, S.ST, S.E, M.Si
Pengolah Data / Data Processors : Satriana Yasmuarto, S.Si, M.M Ofi Ana Sari, S.ST
http://www.bps.go.id
http://www.bps.go.id
KATA PENGANTAR
Survei Sosial Ekonomi Nasional (Susenas) merupakan salah satu survei yang diselenggarakan oleh BPS, untuk mengumpulkan data mengenai berbagai aspek sosial ekonomi dan pemenuhan kebutuhan hidup seperti sandang, pangan, papan, pendidikan, kesehatan, keamanan dan pekerjaan. Data tersebut dapat memberikan gambaran proses dan capaian hasil program pembangunan, serta untuk mengetahui seberapa jauh program pembangunan yang diimplementasikan tersebut telah dinikmati oleh berbagai lapisan masyarakat.
Pengumpulan data sosial-ekonomi penduduk tersebut dilakukan melalui pendekatan rumah tangga. Mulai tahun 2015, pengumpulan data Susenas dilaksanakan dalam dua periode yaitu pada bulan Maret dan September. Data yang dipublikasikan dalam buku ini merupakan hasil Susenas yang dilaksanakan pada bulan September 2015.
Serial publikasi ini diterbitkan dalam tiga buku publikasi, yaitu Buku 1 (konsumsi/pengeluaran tingkat nasional), Buku 2 (konsumsi kalori dan protein tingkat nasional dan provinsi), dan Buku 3 (konsumsi/pengeluaran tingkat provinsi). Serial publikasi ini dimaksudkan untuk memberikan gambaran mengenai tingkat konsumsi serta perilaku konsumen di berbagai lapisan masyarakat pada tingkat nasional dan provinsi, serta konsumsi penduduk dalam satuan kalori dan protein.
Buku ini diharapkan dapat memperkecil kesenjangan antara ketersediaan dan kebutuhan data, khususnya data kesejahteraan rakyat. Kepada semua pihak yang telah ikut berpartisipasi dalam mewujudkan publikasi ini, baik langsung maupun tidak langsung, diucapkan terima kasih.
Jakarta, Mei 2016
KEPALA BADAN PUSAT STATISTIK REPUBLIK INDONESIA
Dr. Suryamin, M.Sc.
http://www.bps.go.id
PREFACE
The National Socio-Economic Survey (Susenas) is one of the survey carried out by BPS every year to collect data on various aspects of socio-economic and subsistence such as food, clothing, shelter, education, health, security, and employment. It is expected that the data will reflect the process and achievements of the development programs, and to find out to what extent national development benefits the various layers of society.
Susenas collects data through household approach. Since 2015 has been carried out 2 period, in March and September. Published data are the result of Susenas held in September 2015.
The results of September 2015 Susenas were published in three volumes, i.e., Volume 1 (consumption/expenditure at national level), Volume 2 (calories and protein consumption at national and the province level), and Volume 3 (consumption/
expenditure at province level). This publication meant for providing an overview of consumption level and consumer behavior in various layers of society at national and province level, as well as consumption in units of calories and protein.
This book is expected to reduce the gap between data availability and needs.
We would like on this occasion to extend our deep gratitude to those who have contributed, both directly and indirectly, in the endeavour to realize the publication.
Jakarta, May 2016 BPS – STATISTICS INDONESIA
Dr. Suryamin, M.Sc.
Chief Statistician
http://www.bps.go.id
RINGKASAN / SUMMARY
Publikasi Konsumsi Kalori dan Protein Penduduk Indonesia dan Provinsi hasil Susenas September 2015 memberikan gambaran mengenai pola konsumsi penduduk Indonesia. Publikasi ini juga menggambarkan tingkat kecukupan gizi penduduk yang digambarkan dalam kecukupan kalori dan protein.
The publication of Calorie and Protein Consumption among Indonesian Population and Province from the results of the September 2015 Susenas give an overview the consumption pattern. This publication also describes the level of nutrition adequacy which was presented in the adequacy of calorie and protein.
Hasil Susenas September 2015 menunjukkan bahwa:
The result of September 2015 Susenas shows that:
Rata-rata konsumsi kalori dan protein penduduk Indonesia masih berada di bawah standar kecukupan konsumsi kalori dan protein per kapita sehari (WNPG X tahun 2012, yaitu 2 150 kkal kalori dan 57 gram protein). Rata-rata konsumsi kalori 1 982,42 kkal dan rata-rata konsumsi protein 55,97 gram.
The average consumption of calorie and protein Indonesian population below the adequacy standards calorie and protein consumption per capita per day (WNPG X 2012, which is 2 150 kcal and 57 grams).
The average of calorie consumption was 1 982.42 kcal and average protein consumption was 55.97 grams.
Rata-rata konsumsi kalori dan protein penduduk yang tinggal di perkotaan lebih tinggi dibandingkan di perdesaan.
The average consumption of calorie and protein among urban population is higher than rural population.
Rata-rata konsumsi kalori di semua provinsi berada di bawah standar kecukupan, kecuali Nusa Tenggara Barat (2 167,26 kkal) dan DI Yogyakarta (2 150,65 kkal). Provinsi dengan rata- rata konsumsi kalori terendah adalah Maluku Utara (1 700,69 kkal).
The average consumption of calorie in all provinces are under adequacy standards, except Nusa Tenggara Barat (2 167.26 kcal) and DI Yogyakarta (2 150.65 kcal).
The province with the lowest average consumption of calorie is Maluku Utara (1 700.69 kcal).
http://www.bps.go.id
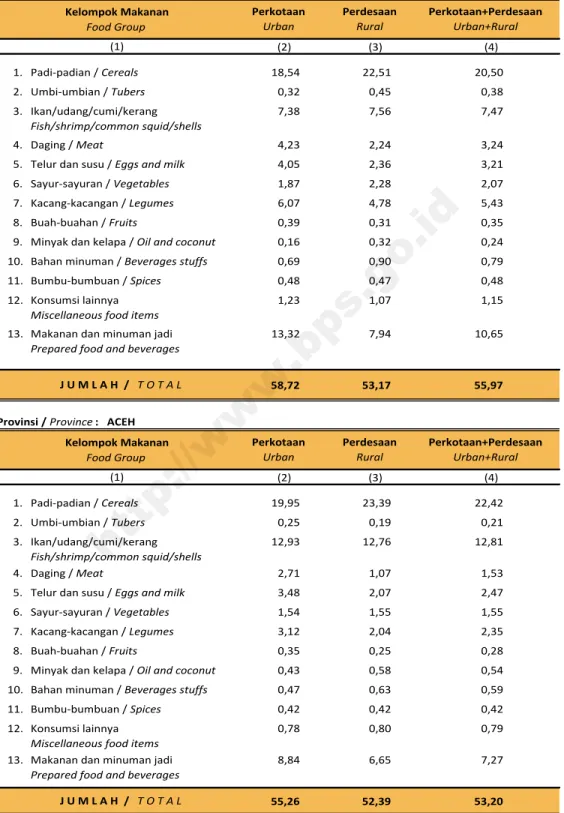
Rata-rata konsumsi protein yang telah memenuhi standar kecukupan protein hanya dicapai oleh 13 provinsi, sedangkan 21 provinsi lainnya masih berada di bawah standar kecukupan protein. Rata- rata konsumsi protein tertinggi terdapat di DI Yogyakarta (64,48 gram) dan terendah di Papua (38,98 gram).
13 provinces has met the average consumption of protein adequacy standard, while 21 other provinces are below the adequacy standard of protein.
The highest daily average consumption of protein is in DI Yogyakarta (64.48 grams) and the lowest is in Papua (38.98 grams).
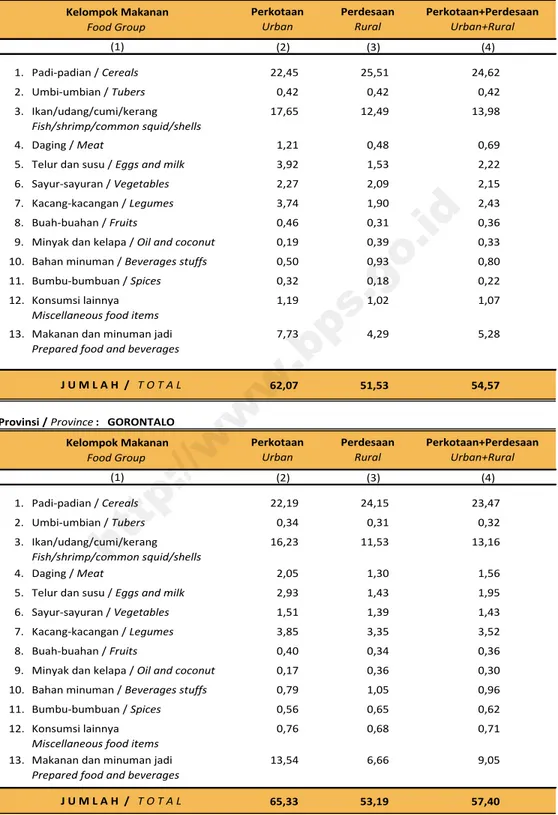
Rata-rata konsumsi kalori dan protein per kapita sehari dari kelompok makanan dan minuman jadi yang tertinggi terdapat di Provinsi DI Yogyakarta (594,93 kkal dan 21,92 gram) dan yang terendah adalah Provinsi Papua (107,96 kkal dan 2,55 gram).
The highest daily average per capita consumption of calorie and protein from prepared food and beverage group is DI Yogyakarta (594.93 kcal and 21.92 grams) while the lowest is Papua (107.96 kcal and 2.55 grams).
http://www.bps.go.id
DAFTAR ISI / CONTENTS
Halaman Pages ORGANISASI PENULISAN / WRITING ORGANIZATION iii
KATA PENGANTAR / PREFACE v
RINGKASAN / SUMMARY vii
DAFTAR ISI / CONTENTS ix
DAFTAR TABEL / LIST OF TABLE x
I. PENDAHULUAN / INTRODUCTION 1.1 Umum / General
1.2 Metode Survei / Survey Method
1.3 Konsep dan Definisi / Concept and Definition
1 3 7 10
II. PENJELASAN TEKNIS / TECHNICAL NOTES
2.1 Konversi Zat Gizi / Conversion of Nutrition Substance 2.2 Zat Gizi Kalori dan Protein / Nutritious Substance of Calorie
and Protein
15 17 18
III. ULASAN SINGKAT / OVERVIEW OF THE RESULTS
3.1 Konsumsi Kalori dan Protein pada Tingkat Nasional Consumption of Calorie and Protein at The National Level 3.2 Konsumsi Kalori dan Protein pada Tingkat Provinsi
Consumption of Calorie and Protein at The Provincial Level
19 21 30
LAMPIRAN A / APPENDIX A: TABEL-TABEL / TABLES 35 LAMPIRAN B / APPENDIX B: KUESIONER VSEN15.KP
QUESTIONNAIRE VSEN15.KP
113
http://www.bps.go.id
DAFTAR TABEL / LIST OF TABLE
Halaman Pages
TABEL 3.1
RATA-RATA KONSUMSI KALORI (KKAL) DAN PROTEIN (GRAM) PER KAPITA SEHARI MENURUT MAKANAN YANG DIMASAK DI RUMAH, MAKANAN DAN MINUMAN JADI, DAN DAERAH TEMPAT TINGGAL, SEPTEMBER 2015 TABLE DAILY AVERAGE CONSUMPTION OF CALORIE (KCAL) AND 23
PROTEIN (GRAMS) PER CAPITA BY FOOD PREPARED AT HOME, PREPARED FOOD AND BEVERAGES, AND URBAN RURAL CLASSIFICATION, SEPTEMBER 2015
TABEL 3.2
RATA-RATA KONSUMSI KALORI (KKAL) PER KAPITA SEHARI MENURUT KELOMPOK MAKANAN DAN DAERAH TEMPAT TINGGAL, SEPTEMBER 2015
TABLE DAILY AVERAGE CONSUMPTION OF CALORIE (KCAL) 24 PER CAPITA BY FOOD GROUP AND URBAN RURAL CLASSIFICATION, SEPTEMBER 2015
TABEL 3.3
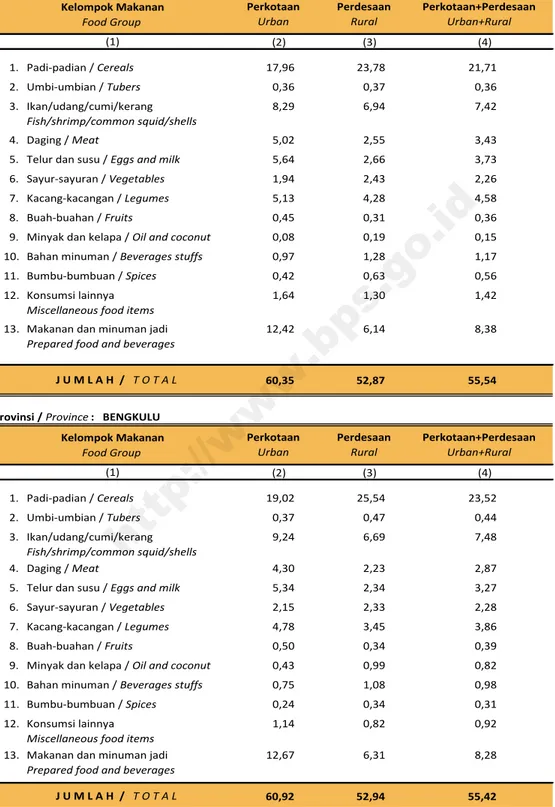
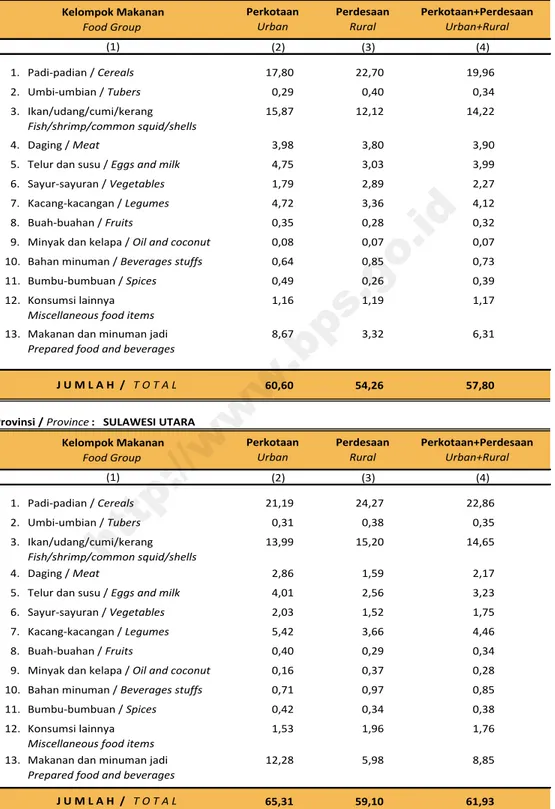
RATA-RATA KONSUMSI PROTEIN (GRAM) PER KAPITA SEHARI MENURUT KELOMPOK MAKANAN DAN DAERAH TEMPAT TINGGAL, SEPTEMBER 2015
TABLE DAILY AVERAGE CONSUMPTION OF PROTEIN (GRAMS) 26 PER CAPITA BY FOOD GROUP AND URBAN RURAL CLASSIFICATION, SEPTEMBER 2015
TABEL 3.4
RATA-RATA KONSUMSI KALORI (KKAL) PER KAPITA SEHARI BEBERAPA JENIS BAHAN MAKANAN DAN DAERAH TEMPAT TINGGAL, SEPTEMBER 2015
TABLE DAILY AVERAGE CONSUMPTION OF CALORIE (KCAL) PER 27 CAPITA FOR SEVERAL FOOD ITEMS AND URBAN RURAL CLASSIFICATION, SEPTEMBER 2015
TABEL 3.5
RATA-RATA KONSUMSI PROTEIN (GRAM) PER KAPITA SEHARI BEBERAPA JENIS BAHAN MAKANAN, SEPTEMBER
2015 29
TABLE DAILY AVERAGE CONSUMPTION OF PROTEIN (GRAMS) PER CAPITA FOR SEVERAL FOOD ITEMS, SEPTEMBER 2015
http://www.bps.go.id
TABEL
3.6.1
RATA-RATA KONSUMSI KALORI (KKAL) DAN PROTEIN (GRAM) PER KAPITA SEHARI DI DAERAH PERKOTAAN MENURUT PROVINSI, SEPTEMBER 2015
TABLE DAILY AVERAGE CONSUMPTION OF CALORIE (KCAL) AND 32 PROTEIN (GRAMS) PER CAPITA IN URBAN AREA BY PROVINCE, SEPTEMBER 2015
TABEL
3.6.2
RATA-RATA KONSUMSI KALORI (KKAL) DAN PROTEIN (GRAM) PER KAPITA SEHARI DI DAERAH PERDESAAN MENURUT PROVINSI, SEPTEMBER 2015
TABLE DAILY AVERAGE CONSUMPTION OF CALORIE (KCAL) 33 AND PROTEIN (GRAMS) PER CAPITA IN RURAL AREA BY PROVINCE, SEPTEMBER 2015
TABEL
3.6.2
RATA-RATA KONSUMSI KALORI (KKAL) DAN PROTEIN (GRAM) PER KAPITA SEHARI DI DAERAH PERKOTAAN DAN PERDESAAN MENURUT PROVINSI, SEPTEMBER 2015 TABLE DAILY AVERAGE CONSUMPTION OF CALORIE (KCAL) 34
AND PROTEIN (GRAMS) PER CAPITA IN URBAN AND RURAL AREA BY PROVINCE, SEPTEMBER 2015
TABEL A.1
RATA-RATA KONSUMSI KALORI PER KAPITA SEHARI (KKAL) MENURUT KELOMPOK MAKANAN DAN DAERAH TEMPAT TINGGAL, SEPTEMBER 2015
TABLE DAILY AVERAGE CONSUMPTION OF CALORIE PER CAPITA 37 (KCAL) BY FOOD GROUP AND URBAN RURAL
CLASSIFICATION, SEPTEMBER 2015
TABEL A.2
RATA-RATA KONSUMSI PROTEIN PER KAPITA SEHARI (GRAM) MENURUT KELOMPOK MAKANAN DAN DAERAH TEMPAT TINGGAL, SEPTEMBER 2015
TABLE DAILY AVERAGE CONSUMPTION OF PROTEIN PER CAPITA 55 (GRAMS) BY FOOD GROUP AND URBAN RURAL
CLASSIFICATION, SEPTEMBER 2015
TABEL A.3
RATA-RATA KONSUMSI KALORI (KKAL) DAN PROTEIN (GRAM) PER KAPITA SEHARI BEBERAPA JENIS MAKANAN, SEPTEMBER 2015
TABLE DAILY AVERAGE CONSUMPTION OF CALORIE (KCAL) AND 73 PROTEIN (GRAMS) PER CAPITA FOR SEVERAL FOOD ITEMS, SEPTEMBER 2015
http://www.bps.go.id
TABEL
A.4 DAFTAR KONVERSI ZAT GIZI (KALORI DAN PROTEIN) TABLE NUTRIENT CONVERSION TABLE (ENERGY AND PROTEIN) 108
http://www.bps.go.id
PENDAHULUAN
INTRODUCTION
http://www.bps.go.id
http://www.bps.go.id
I. PENDAHULUAN / INTRODUCTION
1.1 Umum
Kegiatan pengumpulan data sosial dan ekonomi yang dilaksanakan secara rutin oleh BPS diperoleh dari Survei Sosial Ekonomi Nasional (Susenas). Data hasil survei dapat dimanfaatkan oleh pemerintah sebagai alat monitoring program pembangunan khususnya bidang sosial. Susenas pertama kali dilaksanakan pada tahun 1963, dengan mengumpulkan data konsumsi pengeluaran rumah tangga, dan selanjutnya susenas telah mengalami beberapa kali pengembangan.
1.1 General
Socio-economic data collection activities are carried out regularly by the BPS obtained from the National Socio- Economic Survey (Susenas). The result of the survey can be used by governments as monitoring programs in particular areas of social development. Susenas first held in 1963, to collect consumption/
expenditure household data, and subsequently Susenas has repeatedly undergone several developments.
Mulai tahun 2015 pengumpulan
data Susenas dilaksanakan dua kali dalam setahun, yaitu pada Maret untuk pengumpulan data kor dan konsumsi/
pengeluaran rumah tangga dan September untuk pengumpulan data modul dan konsumsi/pengeluaran rumah tangga.
Since in 2015 Susenas collecting data carry out twice a year, in March for core and consumption/expenditures household and in September for modules and consumption/expenditure household.
Sampel Susenas Maret adalah 300 000 rumah tangga yang tersebar di seluruh provinsi di Indonesia, sedangkan sampel pada bulan September adalah sebanyak 75 000 rumah tangga.
The March Susenas covers 300 000 sample households spread out at all provinces in Indonesia, while the September Susenas covers 75 000 sample households.
Data hasil pencacahan Susenas Maret dapat disajikan untuk tingkat nasional, provinsi, dan kabupaten/kota, sedangkan untuk data hasil Susenas
The result from Susenas data collection in March can be disseminated for national, provincial, and district level estimates, while in September can be
http://www.bps.go.id
September hanya dapat disajikan untuk tingkat nasional dan provinsi.
disseminated only for the national and provincial levels.
Hasil pengumpulan data Kor Susenas 2015 dipublikasikan satu kali berdasarkan hasil Susenas Maret, sedangkan hasil pengumpulan data konsumsi/pengeluaran Susenas 2015 dipublikasikan dua kali berdasarkan hasil Susenas Maret dan September.
The results of Core Susenas data collection 2015 published annually based on March Susenas, while result of Susenas consumption/expenditure published twice based on March and September Susenas.
Data konsumsi/pengeluaran dibagi menjadi 2 (dua) kelompok, yaitu makanan dan bukan makanan. Pada tahun 2015, jumlah komoditi makanan sebanyak 112 komoditi, lebih sedikit dibandingkan tahun sebelumnya sebanyak 215 komoditi. Pengumpulan data kelompok makanan masih meliputi banyaknya komoditi yang dikonsumsi beserta nilai pengeluarannya.
Pengumpulan data pada sebagian besar kelompok bukan makanan hanya mencakup nilai pengeluaran barang yang dikonsumsi, kecuali beberapa jenis barang tertentu juga dikumpulkan kuantitasnya, seperti listrik, air, gas, dan Bahan Bakar Minyak (BBM). Beberapa jenis barang bukan makanan mengalami perubahan pengelompokan dibandingkan dengan Susenas tahun sebelumnya.
The consumption/expenditure data is divided into 2 (two) groups, i.e. food and non food. In 2015, the number of food commodity as much as 112 commodities, less than previous year as much as 215 commodities. The food data collection includes quantity and value.
Data collection on mostly non-food groups cover only the data value, except for certain types of expenditure also collected its quantity, such as the use of electricity, water, gas, and fuel oil (BBM).
Some non-food items having group changed compared with the previous Susenas.
Seperti Susenas sebelumnya, perangkat data empiris Susenas 2015 juga berguna untuk penelitian penerapan hukum ekonomi atau pengujian hipotesis baru. Salah satunya hukum ekonomi yang
Same as the previous Susenas, in 2015, also provides an empirical consumption data set which may be useful for economic theory application or testing new hypothesis. One useful theory
http://www.bps.go.id
dinyatakan oleh Ernst Engel (1857), yaitu bila selera tidak berbeda maka persentase pengeluaran untuk makanan cenderung menurun dengan semakin meningkatnya pendapatan. Engel menemukan hukum tersebut dari perangkat data survei pendapatan dan pengeluaran. Oleh karena itu data Susenas juga berguna untuk mendapatkan gambaran kesejahteraan penduduk.
that has already been widely applied is that of Ernst Engel (1857) which stated that, given that taste is unchanged, the percentage of expenditure on food declines as income increases. Engel discovered the law using income and expenditure data set as the basis of investigation. Consequently, Susenas data might also be useful to measure the level of population welfare.
Publikasi hasil Susenas September 2015 disajikan dalam tiga buku. Buku 1, Pengeluaran untuk Konsumsi Penduduk Indonesia, berisi tabel-tabel tingkat nasional, disajikan untuk perkotaan dan perdesaan, yaitu rata-rata pengeluaran per kapita sebulan (rupiah) menurut kelompok barang dan daerah tempat tinggal pada Tabel A.1.1, persentase rata- rata pengeluaran per kapita sebulan menurut kelompok barang dan daerah tempat tinggal pada Tabel A.1.2, rata-rata konsumsi dan pengeluaran per kapita seminggu (rupiah) menurut jenis makanan dan daerah tempat tinggal pada Tabel A.2.1 - Tabel A.2.3, dan rata-rata pengeluaran per kapita sebulan (rupiah) menurut jenis barang bukan makanan dan daerah tempat tinggal pada Tabel A.3.
The results of the September 2015 Susenas are published in three volumes.
Book 1, Expenditure for Consumption of Indonesia, contains tables, aggregated at national level, distinct between urban and rural areas, featuring monthly average expenditure per capita (rupiahs) by commodity group and urban rural classification, see Table A.1.1, percentage of monthly average expenditure per capita by commodity group and urban rural classification, see Table A.1.2, weekly average consumption and expenditure per capita by type of food and urban rural classification, see Table A.2.1 - Table A.2.3, monthly average expenditure per capita by type of non food and urban rural classification, see Table A.3.
Buku 2, Konsumsi Kalori dan Protein Penduduk Indonesia dan Provinsi, berisi tabel-tabel tingkat provinsi dan nasional yang menyajikan
Book 2, Consumption of Calorie and Protein of Indonesia and Province, contains both provincial and national tables show daily average calorie (kcal)
http://www.bps.go.id
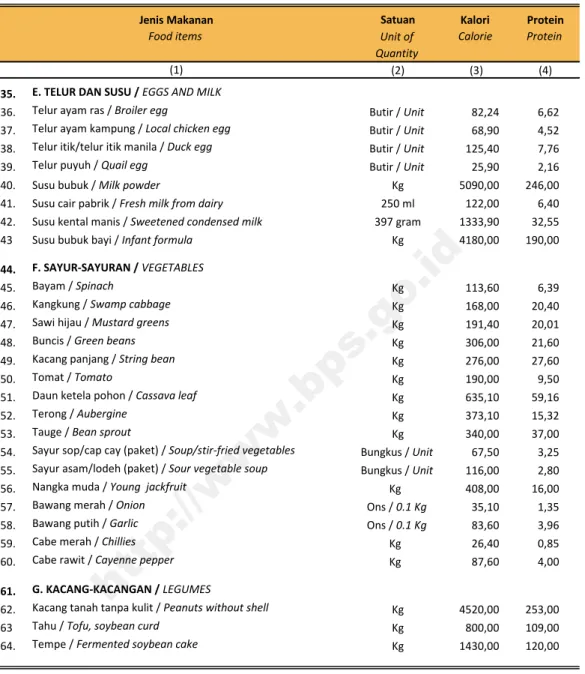
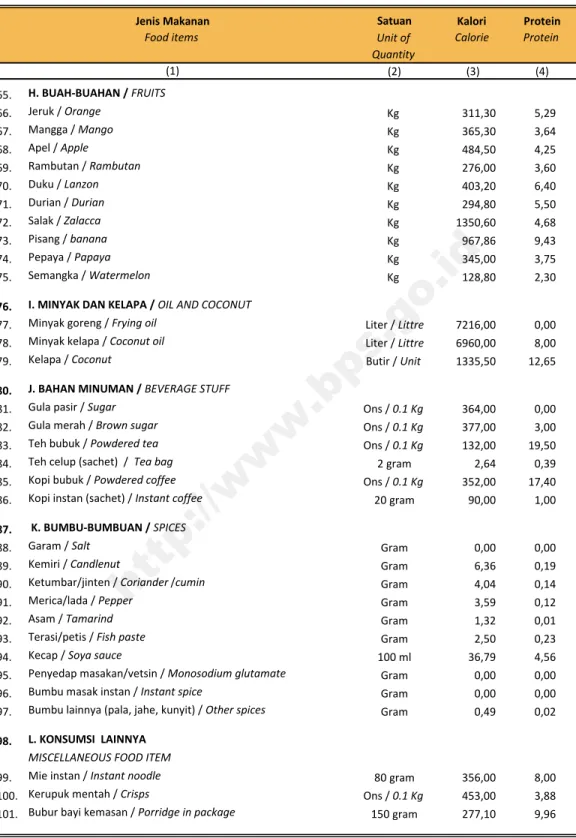
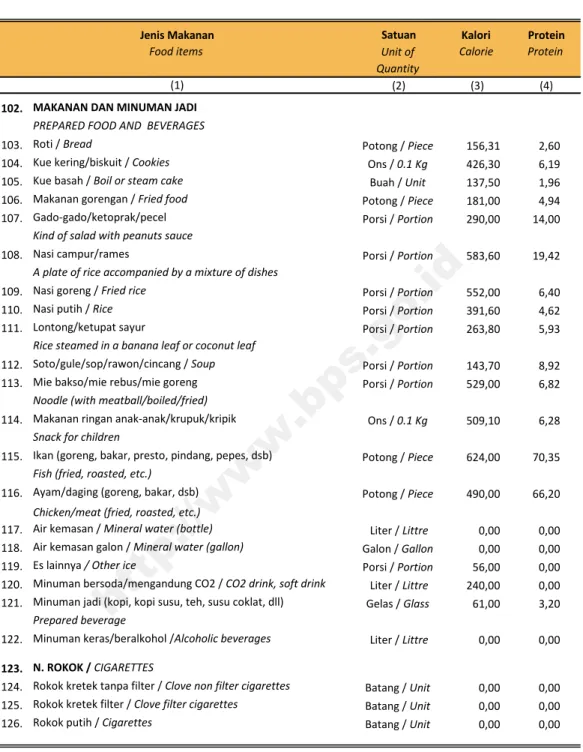
data mengenai rata-rata konsumsi kalori (kkal) dan protein (gram) per kapita sehari menurut kelompok makanan dan daerah tempat tinggal pada Tabel A.1 dan Tabel A.2, sedangkan rata-rata konsumsi kalori (kkal) dan protein (gram) per kapita sehari beberapa jenis makanan pada Tabel A.3 dan Tabel A.4 adalah daftar konversi zat gizi kalori dan protein.
and protein (grams) consumption per capita by commodity group and urban- rural classification see Table A.1 and Table A.2, while the average consumption of calories (kcal) and protein (grams) per capita a day according to the several food item in Table A.3 and Table A.4 is a list of the conversion of calories and protein nutrients.
Buku 3, Pengeluaran untuk Konsumsi Penduduk Indonesia per Provinsi berisi tabel-tabel tingkat provinsi (dibedakan menurut daerah perkotaan dan perdesaan), berisi persentase penduduk menurut provinsi dan golongan pengeluaran per kapita sebulan, September 2015 pada Tabel A.1, rata-rata pengeluaran per kapita sebulan (rupiah) menurut kelompok barang dan daerah tempat tinggal, September 2015 pada Tabel A.2, dan rata-rata konsumsi dan pengeluaran per kapita sebulan beberapa jenis bahan makanan menurut daerah tempat tinggal, September 2015 pada Tabel A.3.
Book 3, Expenditure for Consumption of Indonesia by Province, contains provincial tables (with urban- rural area) show percentage of population by province and monthly expenditure per capita class, September 2015 see Table A.1, average monthly expenditure per capita (rupiahs) by commodity group and urban-rural classification, September 2015 see Table A.2, and average monthly consumption and expenditure per capita of food items by urban rural classification,
September 2015 see Table A.3.
Data yang dimuat dalam ketiga publikasi terbatas hanya untuk memenuhi keperluan yang umum saja berdasarkan hasil pengumpulan data konsumsi dan pengeluaran. BPS membuka peluang bagi institusi atau peneliti yang menginginkan analisis yang lebih mendalam/rinci, atau data-data yang dikaitkan dengan Kor maupun membuat tabel yang berbeda dengan isi publikasi.
It is worth noting that the purpose of the three publications is only meant to fulfill the needs of the general public based on consumption and expenditure data. BPS-Statistics Indonesia welcomes to institutions or researchers who want a more in-depth analysis or detailed data associated with Core or create a different table with the contents of the publication.
http://www.bps.go.id
Buku publikasi ini merupakan buku kedua dari tiga buku hasil Susenas September 2015. Buku ini terdiri atas tiga bab, yaitu Pendahuluan, Penjelasan Teknis, dan Ulasan Singkat. Tabel rinci terdapat dalam tabel lampiran.
This publication is the second book of the three volumes of the September 2015 Susenas publications. It consists of three chapters i.e. Introduction, Technical Notes, and Overview of the Results.
Detailed tables contained in appendix table.
1.2 Metode Survei 1.2.1 Ruang Lingkup
Seperti dijelaskan sebelumnya, Susenas September 2015 mencakup 75 000 rumah tangga sampel yang tersebar di seluruh wilayah geografis Indonesia. Hasil Susenas September 2015 dapat disajikan pada tingkat nasional dan tingkat provinsi.
1.2 Survey Method 1.2.1 Coverage
As mentioned before, sample size of the September 2015 Susenas is 75 000 households for which sample is selected in order to represent all parts of the country.
It used for obtaining national and provincial level estimates.
1.2.2 Kerangka Sampel
Kerangka sampel induk atau sampling frame induk kegiatan Susenas, Sakernas, dan SUPAS 2015 adalah sekitar 180 000 blok sensus (25 persen populasi) yang ditarik secara Probability Proportional to Size (PPS) dengan size banyaknya rumah tangga hasil SP2010.
Kerangka sampel Susenas yang digunakan terdiri dari tiga yaitu:
1. Kerangka sampel tahap pertama adalah daftar blok sensus biasa SP2010.
2. Kerangka sampel tahap kedua adalah daftar 25 persen blok sensus SP2010 yang sudah ada kode stratanya. 25 persen blok sensus ini disebut sampling frame induk.
1.2.2 Sampling Frame
The sampling frame of Susenas, Sakernas, and SUPAS 2015 are approximately 180 000 census blocks (25 percent of the population) selected by Probability Proportional to Size (PPS) from 2010 Population Census (SP2010) household size. The sampling frame used consist of three:
1. The first phase sample frame is ordinary census block SP2010.
2. The second stage sample frame is a list of 25 percent of census block SP2010 existing strata code. 25 percent of census block is called the primary sampling frame.
http://www.bps.go.id
3. Kerangka sampel tahap ketiga adalah daftar rumah tangga hasil pemutakhiran di setiap blok sensus terpilih.
3. The third phase sample frame is the result of updating the list of households in each selected census block.
1.2.3 Desain Sampel
Sampel untuk Susenas estimasi provinsi merupakan subsampel dari Susenas estimasi kabupaten/kota dan dipilih menggunakan metode two stages stratified sampling seperti berikut:
Tahap 1: Memilih 7 500 blok sensus secara systematic sampling dari 30 000 blok sensus estimasi kabupaten/ kota sesuai alokasi dan mempertimbangkan distribusi sampel per strata di tingkat kabupaten/kota.
Tahap 2: Memilih 10 rumah tangga hasil pemutakhiran secara systematic sampling dengan implicit stratification pendidikan tertinggi yang ditamatkan KRT.
1.2.3 Sampling Design
Susenas sample to estimate the province is a sub sample of Susenas estimate of districts and selected using two stages stratified sampling method as follows:
Step 1: Select 7 500 census blocks by systematic sampling of the estimated 30 000 census blocks districts in accordance allocation and consider the distribution of samples per strata at the district.
Stage 2: Select 10 households by systematic sampling results updates with implicit stratification highest educational attainment head of household.
1.2.4 Metode Pengumpulan Data
Pengumpulan data dari rumah tangga terpilih dilakukan melalui wawancara tatap muka antara pencacah dengan responden. Pertanyaan- pertanyaan yang ditujukan kepada individu diusahakan agar individu bersangkutan yang diwawancarai.
Keterangan rumah tangga dikumpulkan
1.2.4 Procedure of Data Collection
The selected household data collection was conducted face to face interview between respondents and enumerator. Questions for individual was asked to their self. Informations about household characteristics were collected by interviewing to the head of household, spouse or another household member
http://www.bps.go.id
melalui wawancara dengan kepala rumah tangga, suami/istri kepala rumah tangga atau anggota rumah tangga yang mengetahui karakteristik yang ditanyakan.
who is familiar with the household’s characteristics.
Referensi waktu survei yang digunakan adalah selama seminggu terakhir untuk konsumsi makanan, dan sebulan atau setahun terakhir untuk konsumsi bukan makanan.
The survey reference period is previous week before enumeration date for food consumption and last month or last year for non food consumption.
1.2.5 Pengolahan Data
Sejak tahun 2007, proses pengolahan dokumen Susenas sepenuhnya menjadi tanggung jawab BPS daerah. Hal ini dimaksudkan untuk lebih memaksimalkan kualitas data melalui proses pengecekan data yang lebih dekat ke sumber utamanya.
1.2.5 Data Processing
Since 2007, the processing of Susenas data has became the full responsibility of BPS regional office. This is to maximize the quality of data through the process of data checking to the main sources.
Proses pengolahan dokumen dimulai dengan editing (cek kelengkapan isian, kewajaran, dan konsistensi) terhadap 73 035 dokumen yang masuk yaitu 97,38 persen dari target, dilanjutkan dengan proses perekaman dokumen ke media komputer untuk menghasilkan data mentah (raw data).
Setelah terbentuk raw data, setiap provinsi mengirimkan file datanya ke BPS Pusat untuk dilakukan proses pengolahan selanjutnya yaitu pengecekan kewajaran dan konsistensi antar isian untuk menghasilkan data yang bersih (clean data).
The data processing was started with editing documents (checking the completeness, appropriateness, and consistency) to 73 035 document received that is 97.38 percent of the target, followed by the process of data entry to produce raw data. Once the raw data is formed, every province sends the data to BPS-Statistics Indonesia to do further processing of the appropriateness and consistency to produce clean data.
http://www.bps.go.id
Selanjutnya dilakukan pengecekan terhadap data-data pencilan (outlier) antara lain konsumsi kalori per kapita per hari di bawah 1 000 kalori dan di atas 4 500 kalori, selanjutnya data pencilan tersebut dikeluarkan dari proses tabulasi.
Total data record hasil Susenas September 2015 yang diproses dalam tabulasi tercatat sebanyak 71 568 records (rumah tangga).
Furthermore outlier are checked, i.e.
the daily per capita calorie consumption was below 1 000 calories and over 4 500 calories the records for the household are excluded from the tabulation process. The actual sample for the September 2015 Susenas is 71 568 records (households).
1.3 Konsep dan Definisi 1.3.1 Daerah Tempat Tinggal
Sampel Susenas dirancang untuk dapat menghasilkan estimasi di tingkat provinsi dan nasional dan dibedakan menurut daerah perkotaan dan perdesaan. Adapun dasar penetapan lokasi sampel perkotaan dan perdesaan secara PPS dengan size banyaknya rumah tangga SP2010.
1.3 Concept and Definition 1.3.1 Urban-Rural Classification
Susenas sample is designed to produce estimates at the national and provincial levels and differentiated by urban and rural areas. The basis for determining the location of a sample of urban and rural PPS (Probability Proportional to Size) by size of household number SP2010.
1.3.2 Blok Sensus
Blok sensus merupakan wilayah kerja dari seorang petugas lapangan pada Susenas Maret 2015. Blok sensus terpilih sudah ditentukan oleh BPS RI dan terdaftar pada Daftar Sampel Blok Sensus (DSBS). Blok sensus harus mempunyai batas-batas yang jelas/mudah dikenali, baik batas alam maupun buatan. Batas satuan lingkungan setempat (SLS seperti RT, RW, dusun, lingkungan, dsb) diutamakan sebagai batas blok sensus
1.3.2 Census Block
Census block is an enumeration area, which is generally assigned to enumerator in the March 2015 Susenas.
Census blocks are selected by Statistics Indonesia and are listed in Census Block List Sample. Each census block should be identifiable by its natural or man-made boundaries, locally formed unit boundaries (neighbourhood association (RT), community association (RW), hamlet, and other local associations) are
http://www.bps.go.id
bila batas SLS tersebut jelas (batas alam atau buatan).
given the first priority to become boundaries of census block if their boundaries are clear.
1.3.3 Rumah Tangga dan Anggota Rumah Tangga
Rumah tangga dibedakan menjadi dua, yaitu rumah tangga biasa dan rumah tangga khusus.
1.3.3 Household and Member of Household
Household consists of two types, i.e., ordinary household and special household.
a. Rumah tangga biasa adalah seorang atau sekelompok orang yang mendiami sebagian atau seluruh bangunan fisik/sensus, dan biasanya makan bersama dari satu dapur.
Makan dari satu dapur adalah mengurus kebutuhan sehari-hari bersama menjadi satu. Ada bermacam-macam bentuk rumah tangga biasa, di antaranya:
a. The ordinary household is defined as a person or a group of persons living in a (physical/census) building or a part of and usually shares the same pot. Sharing the same pot means that every day’s common needs of the group are managed together as one unit. Examples of ordinary household are:
1) Orang yang tinggal bersama istri dan anaknya;
1) A man or woman who lives together with his or her spouse and children;
2) Orang yang menyewa kamar atau sebagian bangunan sensus dan mengurus makannya sendiri;
2) A person who rents a room or a part of census building and manage his or her own meals;
3) Keluarga yang tinggal terpisah di dua bangunan sensus, tetapi makannya dari satu dapur, asal kedua bangunan sensus tersebut masih dalam satu blok sensus;
3) A family who lives in two separated buildings, but shared the same pot, provided that both buildings are located in the same census block;
4) Rumah tangga yang menerima pondokan dengan makan (indekos) yang pemondoknya kurang dari 10 orang;
4) A boarding house with not more than 10 boarders;
http://www.bps.go.id
5) Pengurus asrama, panti asuhan, lembaga pemasyarakatan dan sejenisnya yang tinggal sendiri maupun bersama anak, istri serta anggota rumah tangga lainnya, makan dari satu dapur yang terpisah dari lembaga yang diurusnya;
5) The household of the manager of a boarding institution e.g., residence hall, dormitory, hospital, prison, orphanage, and the like when it is separated from institution they manage.
6) Beberapa orang yang bersama- sama menyewa kamar dalam satu bangunan sensus walaupun mengurus makannya sendiri- sendiri.
6) Each of a group of persons who rents a room or part of a census building together, but manages his or her meal individually.
b. Rumah tangga khusus adalah (i) orang-orang yang tinggal di asrama, tangsi, panti asuhan, lembaga pemasyarakatan, atau rumah tahanan yang pengurusan kebutuhan sehari-harinya dikelola oleh suatu yayasan atau lembaga, dan (ii) kelompok orang yang mondok dengan makan (indekos) dan berjumlah 10 orang atau lebih.
Rumah tangga khusus tidak dicakup dalam Susenas.
b. Specific household includes (i) people living in dormitory, barracks, orphanages, prisons, jails or the maintenance of daily needs are managed by a foundation or institution, and (ii) people living in boarding houses where the number of boarders is 10 persons and more.
Special household is excluded from the survey.
Anggota rumah tangga adalah semua orang yang biasanya bertempat tinggal di suatu rumah tangga, baik yang berada di rumah pada saat pencacahan maupun sementara tidak ada. Anggota rumah tangga yang telah bepergian 6 bulan atau lebih, dan anggota rumah tangga yang bepergian kurang dari 6 bulan tetapi bertujuan pindah/akan meninggalkan rumah, tidak dianggap sebagai anggota
Household member includes each of the persons who form a household regardless of whether he or she is present or temporarily absent at the date of enumeration. However, a household member who is on journey for 6 months or longer, or less than 6 months but intended to move away, is not regarded as household member. On the other hand, a person who has
http://www.bps.go.id
rumah tangga. Orang yang telah tinggal di suatu rumah tangga 6 bulan atau lebih atau yang telah tinggal di suatu rumah tangga kurang dari 6 bulan tetapi berniat menetap di rumah tangga tersebut dianggap sebagai anggota rumah tangga.
stayed for 6 months or longer, or has stayed for less than 6 months but intends to stay, is regarded as the member of the household.
Rata-rata pengeluaran per kapita sebulan adalah biaya yang dikeluarkan untuk konsumsi semua anggota rumah tangga selama sebulan dibagi dengan banyaknya anggota rumah tangga.
Average monthly expenditure per capita of a household is obtained by dividing the number of household members into total consumption expenses of the household.
Konsumsi rumah tangga dibedakan atas konsumsi makanan dan bukan makanan tanpa memperhatikan asal barang dan terbatas pada pengeluaran untuk kebutuhan rumah tangga saja, tidak termasuk konsumsi/
pengeluaran untuk keperluan usaha atau yang diberikan kepada pihak lain.
Household consumption, distinguished between food and non-food, is limited to goods and services used for household purposes, omitting those purchased for business or to be given away, regardless of their source or origin.
Pengeluaran untuk konsumsi makanan dihitung selama seminggu terakhir, sedangkan konsumsi bukan makanan dihitung sebulan dan setahun terakhir. Baik konsumsi makanan maupun bukan makanan selanjutnya dikonversikan ke dalam pengeluaran rata- rata sebulan. Angka konsumsi/
pengeluaran rata-rata per kapita yang disajikan dalam publikasi ini diperoleh dari hasil bagi jumlah konsumsi seluruh rumah tangga (baik mengonsumsi makanan maupun tidak) terhadap jumlah penduduk.
The reference period for food consumption is one week, and for non food consumption is one month and one year prior to enumeration. Both food and non food consumption are tabulated on a monthly basis for which purpose conversion may be required. Quantity consumed, or expenditure thereof per capita per month is obtained by dividing total consumption (or expenditure) of all households over total number of persons corresponding to the area of aggregation.
http://www.bps.go.id
http://www.bps.go.id
PENJELASAN TEKNIS
TECHNICAL NOTES
http://www.bps.go.id
http://www.bps.go.id
II. PENJELASAN TEKNIS / TECHNICAL NOTES
2.1 Konversi Zat Gizi
Sebelum tahun 1996, untuk menghitung besarnya konsumsi gizi hasil Susenas digunakan daftar konversi zat gizi yang berpedoman pada “Daftar Komposisi Bahan Makanan” yang dikeluarkan oleh Direktorat Gizi Departemen Kesehatan R.I.
pada tahun 1972 dan 1981. Sejak Susenas 1996 daftar konversi zat gizi yang digunakan untuk menghitung besarnya konsumsi gizi berpedoman pada beberapa sumber, yaitu:
2.1 Conversion Of Nutrition Substance
Before 1996, to calculate the consumption of nutrition Susenas data was used the conversion list of nutrition substance, referring to “List of Food Composition” issued by the Directorate of Nutrition Ministry of Health in 1972 and 1981. Since Susenas 1996, the list of the consumption of nutrition conversion which is used refer to some sources, such as:
1. Daftar Komposisi Bahan Makanan, Direktorat Gizi - Departemen Kesehatan, 1981;
1. List of Food Composition, Directorate of
Nutrition – Ministry of Health, 1981; List of Food Composition, Directorate of Nutrition – Ministry of Health, 1981;
2. Daftar Komposisi Zat Gizi Pangan Indonesia, Departemen Kesehatan, 1995;
2. List of Food Nutrition of Indonesia, Ministry of Health, 1995;
3. Daftar Kandungan Gizi Bahan Makanan (dalam bentuk hasil print-out), Puslitbang Gizi-Bogor, 1996;
3. List of Nutrition Content of Food (a print-out paper), Puslitbang Gizi-Bogor,
1996; List of Nutrition Content of Food (in the form of print-out paper), Puslitbang Gizi-Bogor, 1996;
Mulai tahun 2006 hingga sekarang, daftar konversi zat gizi berpedoman pada hasil Widyakarya Nasional Pangan dan Gizi VIII, 17-19 Mei 2004 di Jakarta, dalam buku karangan Hardinsyah dan Victor Tambunan dengan Judul “Angka Kecukupan Energi, Protein, Lemak, dan Serat Makanan”, LIPI Jakarta.
Since 2006 until now, list of the consumption of nutrition conversion refer to the result of Widyakarya Nasional Pangan dan Gizi VIII, 17-19 Mei 2004 in Jakarta, in the book by Hardinsyah dan Victor Tambunan and the title “Angka Kecukupan Energi, Protein, Lemak, dan Serat Makanan”, LIPI Jakarta.
http://www.bps.go.id
Khusus untuk makanan jadi, tetap menggunakan konversi dari Daftar Kandungan Gizi Bahan Makanan dari Puslitbang Gizi-Bogor tahun 1996, karena hampir semua komoditi ada konversinya.
Komoditi yang tidak ada konversi tersebut antara lain: udang/ebi dan cumi-cumi/
sotong yang diawetkan, dan air kemasan galon.
Especially for food, still using the conversion from List List of Nutrition Content of Food Puslitbang Gizi-Bogor, 1996, as almost all existing commodity conversion. Commodities that no such conversion include: shrimps and common squids preserved, and mineral water.
2.2 Zat Gizi Kalori dan Protein
Makanan yang dikonsumsi penduduk dari hasil Susenas September 2015 mengandung banyak zat gizi seperti kalori, protein, karbohidrat dan lemak. Dalam publikasi ini yang disajikan hanya dua zat gizi penting yaitu kalori dan protein.
Pengguna data yang ingin melihat kandungan konsumsi zat gizi karbohidrat dan lemak dapat menghubungi Subdit Statistik Rumah Tangga, BPS Pusat.
Rokok dalam Susenas termasuk bahan makanan yang dikonsumsi penduduk, namun karena tidak mengandung kalori dan protein (konversi gizi kalori maupun proteinnya bernilai nol) maka tidak termasuk yang disajikan dalam publikasi ini.
2.2 Nutritious Substance of Calorie and Protein
The food consumed by the people from the result of March 2015 contains much nutritious substance such as calorie, protein, carbohydrate and fat. In this publication, there are only two important nutritious substances presented, namely calorie and protein. Users who wish to know the content of other nutritious substances, like carbohydrate and fat, can contact Subdirectorate of Households Statistics, Central BPS.
Tobacco in Susenas are regarded as food consumed by the people. But their conversion of calorie and protein is zero, they are not included in this publication.
http://www.bps.go.id
ULASAN SINGKAT
OVERVIEW OF THE RESULTS
http://www.bps.go.id
http://www.bps.go.id
III. ULASAN SINGKAT / OVERVIEW OF THE RESULTS
Tingkat kecukupan gizi dapat digunakan sebagai indikator tingkat kesejahteraan penduduk yang dihitung berdasarkan banyaknya kalori dan protein yang dikonsumsi.
Besarnya konsumsi kalori dan protein dihitung dengan mengalikan kuantitas setiap makanan yang dikonsumsi dengan nilai kandungan kalori dan protein setiap jenis makanan
1)kemudian hasilnya dijumlahkan.
The level of nutrition adequacy can be used as an indicators to shows the level of people’s welfare that is calculated based on the amount of calorie and protein consumed by the people. The amount of calorie and protein consumption is calculated by multiplying the quantity of each food consumed with the content value of calorie and protein of each food
1), then summarizing the results.
Menurut hasil Widyakarya Nasional Pangan dan Gizi (WNPG) VIII tahun 2004
2), standar kecukupan konsumsi kalori dan protein penduduk Indonesia per kapita sehari masing- masing sebesar 2 000 kkal dan 52 gram protein.
Pada WNPG X tahun 2012, standar kecukupan konsumsi kalori dan protein penduduk Indonesia sedikit lebih tinggi dibanding WNPG VIII tahun 2004. Ini akibat dari berkembangnya ilmu pengetahuan dan teknologi gizi dan ukuran antropometri penduduk. Standar kecukupan konsumsi kalori dan protein penduduk Indonesia per kapita sehari secara agregatif (makro) menurut WNPG X tahun 2012
3)masing-masing sebesar 2 150 kkal dan 57 gram protein.
Based on Widyakarya Nasional Pangan dan Gizi (WNPG) VIII 2004
2), the standard of adequacy of calorie and protein consumption of Indonesian people per capita daily for 2 000 kcal and 52 grams protein. In WNPG X 2012, the standard consumption of calories and protein adequacy of Indonesia's population is slightly higher than the WNPG VIII 2004. This is a result of the development of science and technology on nutrition and anthropometry population size. Adequacy standards calorie and protein consumption per capita daily population of Indonesia by agregat (macro) according to WNPG X 2012
3)respectively are 2 150 kcal and 57 grams.
_______________
1) Menggunakan “Daftar Konversi Zat Gizi” seperti dijelaskan pada Bab II.
2) Hardinsyah dan Victor Tambunan: Angka Kecukupan Energi, Protein, Lemak, dan Serat Makanan, Widyakarya Nasional Pangan dan Gizi VIII, Jakarta, 17-19 Mei 2004, LIPI-Jakarta.
3) Djoko Kartono, Hardinsyah, Abas Basuni Jahari, Ahmad Sulaeman, dan Moesijanti Soekatri: Penyempurnaan Kecukupan Gizi untuk Orang Indonesia, Widyakarya Nasional Pangan dan Gizi X, Jakarta, 20-21 November 2012, LIPI Jakarta.
_________________
1) Use “Conversion List of Nutritious Substance” as explained in Chapter II
2) Hardinsyah and Victor Tambunan: Sufficiency Rate for Energy, Protein, Fat, and Fiber Foods, National Food and Nutrition Widyakarya VIII, Jakarta, 17-19 May 2004, LIPI-Jakarta.
3) Djoko Kartono, Hardinsyah, Abas Basuni Jahari, Ahmad Sulaeman, and Moesijanti Soekatri: Completion the Recommended Daily Intake for Indonesian People, National Food and Nutrition Widyakarya X, Jakarta, 20-21 November 2012, LIPI Jakarta.
http://www.bps.go.id
3.1 Konsumsi Kalori dan Protein pada Tingkat Nasional
Rata-rata konsumsi kalori dan protein penduduk Indonesia per kapita sehari hasil Susenas September 2015 sebesar 1 982,42 kkal dan 55,97 gram protein (lihat Tabel 3.1).
Berdasarkan standar kecukupan konsumsi kalori dan protein per kapita sehari (WNPG X tahun 2012), yaitu 2 150 kkal dan 57 gram protein, maka rata-rata konsumsi kalori dan protein penduduk Indonesia pada September 2015 masih berada di bawah standar kecukupan.
3.1 Consumption of Calorie and Protein at The National Level The daily average consumption of calorie and protein per capita Indonesian people from the result of September 2015 Susenas is 1 982.42 kcal and 55.97 grams protein (see Table 3.1). Based on the standard consumption of calories and protein adequacy per capita daily (WNPG X 2012), which is 2 150 kcal and 57 grams protein, the average consumption of calories and protein in September 2015 is still below the adequacy standard.
Rata-rata konsumsi kalori penduduk perkotaan dan perdesaan masih berada di bawah standar kecukupan kalori. Rata-rata konsumsi kalori di perkotaan sebesar 1 987,11 kkal, lebih tinggi dibandingkan konsumsi kalori di perdesaan sebesar 1 977,64 kkal. Hal yang sama terjadi pada konsumsi protein, dimana konsumsi protein penduduk di perkotaan juga lebih tinggi dibandingkan perdesaan yaitu 58,72 gram berbanding 53,17 gram, seperti terlihat pada Tabel 3.1. Hal ini dipengaruhi oleh ragam makanan yang dikonsumsi oleh penduduk perkotaan lebih banyak dibandingkan penduduk pedesaan karena di daerah perkotaan tersedia lebih banyak jenis bahan makanan maupun makanan jadi.
The average calorie intake of urban and rural population is still below the calorie adequacy standards. Average calorie consumption in urban areas is 1 987.11 kcal, higher than rural areas that is 1 977.64 kcal. Same pattern occur in consumption of protein, where the average consumption of protein in the urban areas (58.72 grams) is also higher than rural areas (53.17 grams), as seen on Table 3.1. This pattern influenced by the foods consumed in urban areas has more variety than consumption of residents in rural areas.
There are more kinds of foodstuffs and processed food in urban areas than rural areas.
Berdasarkan hasil Susenas September 2015, rata-rata konsumsi kalori per kapita sehari penduduk perkotaan (1 987,11 kkal) lebih tinggi dibandingkan
penduduk perdesaan (1 977,64 kkal)
Based on the result of September 2015 Susenas, average calorie
consumption in urban areas (1 987.11 kcal) is higher than in rural areas (1 977.64 kcal)
http://www.bps.go.id
Tabel 3.1
Rata-Rata Konsumsi Kalori (Kkal) dan Protein (Gram) per Kapita Sehari menurut Makanan yang Dimasak di Rumah, Makanan dan Minuman Jadi, dan Daerah Tempat Tinggal, September 2015
Table Daily Average Consumption of Calorie (Kcal) and Protein (Grams) per Capita by Food Prepared at Home, Prepared Food and Beverages and Urban Rural Classification, September 2015
Rincian Items
Kalori / Calorie Protein / Protein
Perkotaan Perdesaan
Perkotaan +
Perdesaan Perkotaan Perdesaan
Perkotaan + Perdesaan Urban Rural Urban +
Rural
Urban Rural Urban + Rural
(1) (2) (3) (4) (5) (6) (7)
1. Makanan dimasak di rumah 1 535,30 1 672,16 1 603,13 45,40 45,24 45,32 Food prepared at home 77,26% 84,55% 80,87% 77,32% 85,09% 80,97%
2. Makanan dan minuman jadi 451,81 305,48 379,29 13,32 7,93 10,65 Prepared food and beverages 22,74% 15,45% 19,13% 22,68% 14,91% 19,03%
Jumlah / Total 1 987,11 1 977,64 1 982,42 58,72 53,17 55,97
100,00% 100,00% 100,00%100,00%
100,00% 100,00%Sumber: BPS, Susenas September 2015 Source: BPS, September 2015 Susenas
Sumber konsumsi kalori dan protein penduduk dibedakan menjadi dua yaitu berdasarkan konsumsi makanan dan minuman yang dimasak di rumah serta konsumsi makanan dan minuman jadi. Pola konsumsi antara makanan yang dimasak di rumah dengan makanan dan minuman jadi dapat mengindikasikan perubahan pola konsumsi yang berkaitan dengan proses modernisasi. Konsumsi kalori dan protein dari makanan dan minuman jadi bagi penduduk di perkotaan (451,81 kkal dan 13,32 gram) lebih tinggi dari penduduk di perdesaan (305,48 kkal dan 7,94 gram).
Source of calorie and protein consumption devided into two groups, i.e food prepared at home and prepared food and beverages. The changes percentage consumption of prepared food and beverages may indicate changes in the consumption pattern due to modernization process. The consumption of calorie and protein from prepared food and beverages in urban areas (451.81 kcal and 13.32 grams) is higher than the consumption in rural areas (305.48 kcal and 7.94 grams).
http://www.bps.go.id
Persentase konsumsi kalori dari makanan dan minuman jadi terhadap total konsumsi kalori untuk penduduk di perkotaan (22,74 persen) lebih besar dibandingkan dengan penduduk di perdesaan (15,45 persen). Konsumsi protein dari makanan dan minuman jadi di perkotaan mencapai 22,68 persen sedangkan di perdesaan hanya 14,91 persen terhadap total konsumsi protein.
Calorie consumption percentage of the total calorie intake from prepared food and beverages in the urban areas (22.74 percent) is higher than rural areas (15.45 percent). The protein consumption from prepared food and beverages in urban areas reach 22.68 percent, while in rural areas only 14.91 percent of the total protein intake
Tabel
3.2.
Rata-rata Konsumsi Kalori (kkal) per Kapita Sehari menurut Kelompok Makanan dan Daerah Tempat Tinggal, September 2015 Table Daily Average Consumption of Calorie (kcal) per Capita by
Food Group and Urban Rural Classification, September 2015
Kelompok Makanan Food Group
Daerah Tempat Tinggal /
Urban and Rural Classification Persentase
%