STUDENTS’ TEST ANXIETY
AND ITS CORRELATION WITH THEIR ACADEMIC PERFORMANCE: A Study of Undergraduate Students
at a Private Higher Education Institution in Bandung
A THESIS
Submitted in Partial Fulfillment of the Requirements for Master’s Degree
in English Education
NUR AINANI FITRIA 1007014
DEPARTMENT OF ENGLISH EDUCATION SCHOOL OF POSTGRADUATE STUDIES INDONESIA UNIVERSITY OF EDUCATION
Nur Ainani Fitria, 2013
Students’ Test Anxiety And Its Correlation With Their Academic Performance: A Study of Undergraduate Students at a Private Higher Education Institution in Bandung
Universitas Pendidikan Indonesia | repository.upi.edu| perpustakaan.upi.edu
APPROVAL SHEET
This thesis entitled “STUDENTS’ TEST ANXIETY AND ITS
CORRELATION WITH THEIR ACADEMIC PERFORMANCE: A Study of Undergraduate Students at a Private Higher Education Institution in Bandung” has been approved by:
Supervisor,
Prof. Fuad Abdul Hamied, M.A., Ph.D. NIP. 195008211974121001
Head of English Education Study Program,
DECLARATION
I hereby certify that this thesis is wholly my own piece of work. I am entirely mindful that I have quoted relevant statements and ideas from other resources, and they are properly legitimated in the text.
Bandung, 5th of December 2012
Nur Ainani Fitria, 2013
Students’ Test Anxiety And Its Correlation With Their Academic Performance: A Study of Undergraduate Students at a Private Higher Education Institution in Bandung
Universitas Pendidikan Indonesia | repository.upi.edu| perpustakaan.upi.edu
At the university levels, test anxiety does exist. Considering that many language testing researchers, specifically test anxiety researchers, agree with the phenomena that the effect of test anxiety on test performance can infiltrate other aspects and cannot be underestimated, therefore, it is necessary to investigate the students’ test anxiety. Besides, in Indonesia, there are only a small number of studies which have taken the subject of test
anxiety.This study was intended to examine the general situation of EFL students’ test anxiety, especially among undergraduate students at a private higher education institution in Bandung. The units of analysis explored in this study included the test anxiety levels experienced by EFL students, factors that have caused
EFL students’ test anxiety, and correlation between students’ test anxiety and their academic performance.The data were collected by using a battery of self report measures (i.e. Spielberger’s Test Anxiety Inventory (TAI) 1980 and Test Anxiety Inventory retrieved and adapted from Academic Centers for Excellence) and a semi-structured interview. To see the correlation between the students’ test anxiety and their academic performance, a correlation analyses was used. For an accurate computation, SPSS (Statistical Package for Social Sciences) was applied. The research showed that the students experienced low, moderate, and high test anxiety levels. The majority of the students (52.69%) experienced low anxiety. Factors affecting their test anxiety in terms of test taker characteristics included self-image, other people’s view, preparation, future security, testing situation factors, the willingness to get a high score, personal problems, and situational and subjective determinants of test anxiety. Meanwhile, in terms of test characteristics, factors affecting their test anxiety included item type, time pressure, length of the test, item difficulty sequencing, and test taking information. Finally, the findings
showed that the students’ test anxiety had no significant correlation with their academic performance. Nevertheless, whether or not their test anxiety had statistically significant correlation with their academic performance, reducing the discomfort that some highly anxious test takers experienced would seem to be a laudable undertaking in an academic setting.
Key Words: test anxiety, academic performance, correlation between students’ test anxiety and their
TABLE OF CONTENTS
TITLE SHEET ... i
APPROVAL SHEET ... ii
DECLARATION... iii
ACKNOWLEDGMENTS ... iv
ABSTRACT ………v
TABLE OF CONTENTS ... vi
LIST OF TABLES ... viii
LIST OF CHARTS ... ix
LIST OF DIAGRAMS ... x
LIST OF APPENDICES ... xi
CHAPTER I INTRODUCTION 1.1 Background of the Study ... 1
1.2 Research Problems ... 3
1.3 Research Objectives ... 3
1.4 Significance of the Study ... 4
1.5 Hypothesis ... 4
1.6 Scope of the Study ... 4
1.7 Definition of Key Terms ... 5
1.8 Research Location ... 5
1.9 Thesis Organization ... 5
CHAPTER II LITERATURE REVIEW 2.1 Introduction ... 7
2.2 EFL Test Anxiety ... 7
2.2.1 The Nature of Test Anxiety ... 7
2.2.2 The Dimensions of Test Anxiety ... 8
2.2.3 Factors Affecting Test Anxiety ... 12
2.3 Academic Performance ... 15
2.4 Test Anxiety and Academic Performance ... 16
2.5 The Solutions for Test Anxiety ... 17
2.6 Concluding Remarks ... 19
CHAPTER III RESEARCH METHODOLOGY 3.1 Introduction ... 20
Nur Ainani Fitria, 2013
Students’ Test Anxiety And Its Correlation With Their Academic Performance: A Study of Undergraduate
Students at a Private Higher Education Institution in Bandung
Universitas Pendidikan Indonesia | repository.upi.edu| perpustakaan.upi.edu
3.4.1 A Battery of Self Report Measures ... 22
3.4.2 A Semi-structured Interview ... 23
3.5 Validity of the Instrument ... 25
3.6 Reliability of the Instrument ... 28
3.7 Data Analysis ... 28
3.8 Concluding Remarks ... 32
CHAPTER IV RESEARCH FINDINGS AND DISCUSSION 4.1 The Test Anxiety Levels Experienced by EFL Students ... 33
4.2 The Factors that Have Caused EFL Students’ Test Anxiety ... 38
4.2.1 Data from Test Anxiety Inventory Retrieved and Adapted from Academic Centers for Excellence ... 38
4.2.2 Data from Semi-Structured Interview ... 44
4.2.2.1 Item Type ... 47
4.2.2.2 Time Pressure ... 49
4.2.2.3 Length of the Test ... 51
4.2.2.4 Item Difficulty Sequencing ... 53
4.2.2.5 Test Taking Information Given ... 54
4.3 The Correlation between Students’ Test Anxiety and Their Academic Performance ... 55
4.4 Concluding Remarks ... 60
CHAPTER V CONCLUSIONS AND RECOMMENDATIONS 5.1 Conclusions... 61
5.2 Recommendations ... 64
CHAPTER I INTRODUCTION
This chapter presents some aspects related to the background of the study, research problems, research objectives, significance of the study, hypothesis, scope of the study, definition of key terms used throughout the study, research location, and thesis organization.
1.1Background of the Study
In daily lives, tests become more essential (Chen, 2004, p. 1), accordingly the wash back effects of tests cannot be ignored. Test anxiety, as one of the factors that may affect test results, need to be taken into account. Even, Hembree (1988) categorizes test anxiety as one of factors that can give negative effects to the students academically.
Specifically, at the university levels, test anxiety does exist (Damer and Melendres, 2011). According to them, test anxiety may arise related to the students’ poor study skills or their inadequate preparation. Tenenbaum (2012, p. 2) states that the trigger for test anxiety includes several situations like classroom-based and high-stakes testing, dramas and performances at school, class discussions and presentations, events related to sport, and many more.
Horwitz et al. (1986, p. 127) categorize test anxiety as one of three componential sources of language anxiety, which is a distinct phenomenon particularly to language learning. The other two componential sources of language anxiety are “communication apprehension” and “fear of negative evaluation”. Sarason (1983, p. 134) conceptualizes test anxiety as “a tendency to emit personalized task-irrelevant responses when individuals experience heightened awareness that their performance is being evaluated”.
Nur Ainani Fitria, 2013
Students’ Test Anxiety And Its Correlation With Their Academic Performance: A Study of
Undergraduate Students at a Private Higher Education Institution in Bandung Universitas Pendidikan Indonesia | repository.upi.edu| perpustakaan.upi.edu
is a feeling of apprehension and discomfort accompanied by cognitive difficulties during a test. Additionally, the diagnostic instrument used in this study to measure test anxiety was Spielberger’s Test Anxiety Inventory (TAI). It was developed by Charles Spielberger and colleagues in 1980 to measure worry and emotionality, two-component model of test anxiety (Lufi et al., 2004).
A literature survey on the empirical study of test anxiety reveals that so far factors affecting test anxiety include 1) test taker characteristics, such as language proficiency (Aydin, 2009, p. 134), self cognition and perceived academic achievement (Horwitz et al., 1986; Hembree, 1988), attitudes (Aydin et al., 2006, p. 145), and personal experience (Chan and Wu, 2004, p. 293), and 2) test characteristics, such as item difficulty sequencing, time pressure, item type, and test taking information (Xiaoping, 2009, p. 108).
In the last few years, many researchers have investigated the impact of test anxiety on test results (Sarason, 1983, p. 136; Hembree, 1988; Chapell et al., 2005, p. 268; etc.). Considering that many language testing researchers, specifically test anxiety researchers, agree with the phenomena that the effect of test anxiety on test performance can infiltrate other aspects and cannot be underestimated (Xiaoping, 2009, p. 109), therefore, it is necessary to investigate the students’ test anxiety.
The levels of test anxiety have been categorized by several writers (Busari and Osiki, 2002; Reteguiz, 2006; Abbott, 2009; Tsai and Li, 2012; Nemati and Habibi, 2012; Nemati, 2012). Firstly, the students are divided into low and high levels of test anxiety (Busari and Osiki, 2002; Tsai and Li, 2012). Secondly, they are divided into three groups: low, moderate, and high anxiety (Reteguiz, 2006; Nemati and Habibi, 2012; Nemati, 2012). Thirdly, their anxiety scores are divided into four levels, ranging from 1 (least anxious) to 4 (most anxious). Based on their anxiety scores, the participants of this study were divided into three groups: low, moderate, and high test anxiety – as proposed by Reteguiz (2006); Nemati and Habibi (2012); Nemati (2012).
3
Negeri I Haurgeulis, showed that the students’ test anxiety occurred in the level of mildly anxious and there was no significant correlation between their test anxiety and their academic performance. In addition, the study of test anxiety has been conducted by Tresna (2012). The result showed that the students of X class in SMA Negeri 2 Singaraja experienced very high test anxiety level and behavioral counseling with systematic desensitization techniques could effectively decrease their test anxiety level both in general and in terms of its aspects.
These chains of studies show that there are still many spaces that can be explored of how test anxiety occurs in language teaching and learning process. In Indonesia, there are only a small number of studies which have taken the subject of test anxiety. Therefore, to enrich the insight, this study took part in this foreign language teaching and learning issue.
This study was intended to examine the general situation of EFL students’ test anxiety, especially among undergraduate students at a private higher education institution in Bandung. The units of analysis explored in this study included the test anxiety levels experienced by EFL students, factors that have caused EFL students’ test anxiety, and correlation between students’ test anxiety and their academic performance.
1.2Research Problems
Based on the background mentioned above, research problems were formulated as follows.
1.2.1 What test anxiety levels are experienced by EFL students? 1.2.2 What factors have caused EFL students’ test anxiety?
1.2.3 Is there any correlation between students’ test anxiety and their academic performance?
1.3Research Objectives
In line with the research problems above, the research objectives were as follows.
Nur Ainani Fitria, 2013
Students’ Test Anxiety And Its Correlation With Their Academic Performance: A Study of
Undergraduate Students at a Private Higher Education Institution in Bandung Universitas Pendidikan Indonesia | repository.upi.edu| perpustakaan.upi.edu
1.3.2 To find out the factors that have caused EFL students’ test anxiety.
1.3.3 To find out the correlation between students’ test anxiety and their academic performance.
1.4Significance of the Study
Regarding the significance of the study, this study has the potential to the theory, education, and professional practices. Theoretically, this study is expected to enrich the literature on students’ test anxiety which is likely received a little attention in foreign language teaching and learning context. Practically, this study provides information related to students’ test anxiety, particularly in the context whether or not the students’ test anxiety has statistically significant correlation with their academic performance, reducing the discomfort that some of them experience will seem to be a laudable undertaking in an academic setting. Professionally, this study will hopefully broaden the insight into the issue of test anxiety and will help EFL teachers to be aware of the phenomenon that happens to their students and try to find the best solution for the test anxiety experienced by the students.
1.5Hypothesis
The researcher set the hypothesis as follows.
There is no significant correlation between the students’ test anxiety and their academic performance.
1.6Scope of the Study
5
1.7Definition of Key Terms
In order to avoid misunderstanding, some terms were clarified as follows. 1. Test anxiety is comprised of two primary components; worry and
emotionality (Liebert and Morris, 1967; Morris et al., 1981). Leaving from the two-component model of test anxiety, the definition of test anxiety for this study is a feeling of apprehension and discomfort accompanied by cognitive difficulties during a test.
2. Academic performance refers to the Grade Point Average (GPA) of the participants obtained in the latest semester. It reflects how well they performed academically within the prior semesters.
1.8Research Location
To collect the data, the researcher conducted a study of the undergraduate students at a private higher education institution in Bandung. In academic year of 2008 – 2011, this higher education institution has nine classes. However, because the fourth year students had no classes anymore (skripsi and Program Latihan Profesi (an internship program) left), the researcher only involved the students of
academic year of 2009-2011 (consisting of 541 students).
1.9Thesis Organization
This thesis is organized into five chapters as follows.
Chapter I deals with the background of the study, research problems, research objectives, significance of the study, hypothesis, scope of the study, definition of key terms used throughout the study, research location, and thesis organization. Chapter II reviews the relevant literature on EFL test anxiety (specifying the
discussion on the nature of test anxiety, dimensions of test anxiety, and factors affecting test anxiety), academic performance, test anxiety and academic performance, and the solutions for test anxiety.
Nur Ainani Fitria, 2013
Students’ Test Anxiety And Its Correlation With Their Academic Performance: A Study of
Undergraduate Students at a Private Higher Education Institution in Bandung Universitas Pendidikan Indonesia | repository.upi.edu| perpustakaan.upi.edu
instruments (including a battery of self report measures and a semi-structured interview), validity and reliability of the instrument, data analysis, and concluding remarks.
CHAPTER III
RESEARCH METHODOLOGY
3.1Introduction
This chapter discusses overview of the methodological aspects of the study. The overview comprises of seven parts; the research design, population and sampling procedures, research instruments (including a battery of self report measures and a semi-structured interview), validity and reliability of the instrument, data analysis, and concluding remarks.
3.2Research Design
Related to the research problems mentioned in the first chapter, this study employed descriptive analysis method by using an ex post facto design. The study employed a descriptive method as it “involves collecting data in order to test hypothesis or to answer questions concerning the current status of the subject” (Gay, 1987). In this study, the researcher collected data in order to test hypothesis that there is no significant correlation between the students‟ test anxiety and their academic performance. Meanwhile, an ex post facto design was used because – as stated by Ary et al. (1999, p. 298) - it is suitable to investigate attribute variables – a kind of characteristics that should be possessed by the participants of study before a researcher begins his or her study. In this study, students‟ test anxiety was an attribute variable, so that the variable could not be manipulated since it has been occurred in nature.
Nur Ainani Fitria, 2013
Students’ Test Anxiety And Its Correlation With Their Academic Performance: A Study of
Undergraduate Students at a Private Higher Education Institution in Bandung Universitas Pendidikan Indonesia | repository.upi.edu| perpustakaan.upi.edu
ex post facto design was considered appropriate to be research design of this study.
3.3Population and Sampling Procedures
The populations of this study were the undergraduate students at a private higher education institution in Bandung. The population was taken because of two reasons. The first reason is its accessibility – as proposed by Kvale (1996). Since the researcher is one of the teachers there, she gets a permission to do the research there. The second reason is because the population can portray the varieties of abilities of the undergraduate students. It is related to their heterogeneous background and intelligence.
To determine the amount of samples involved in this study, a simple random sampling was used. By using this sampling technique, each student had an equal opportunity to be selected randomly and be representative of the population (Fraenkel and Wallen, 2007). Accordingly, the researcher randomly took 20% of the total number of students (541 students). So, about 108 undergraduate students at this higher education institution became the sample of this study. However, because of several things, such as rejection from several students to be the sample of this study, students‟ leave-taking from this higher education institution, and their transfer from regular class to staff class, the sample of this study came to be about 93 students.
3.4Research Instruments
22
Nur Ainani Fitria, 2013
Students’ Test Anxiety And Its Correlation With Their Academic Performance: A Study of
Meanwhile, a semi-structured interview was conducted to gain rich and meaningful data into EFL students‟ experience of anxiety in relation to their tests.
3.4.1 A Battery of Self Report Measures
The first self-report measure was Spielberger‟s Test Anxiety Inventory (TAI) that was developed in 1980. It is already elaborated in the second chapter. The form of Spielberger‟s TAI can be seen in Appendix 1.
Meanwhile, the second self report measure, which was a Test Anxiety Inventory retrieved and adapted from Academic Centers for Excellence, was in response to the situation and condition of the participants. The adaptation was done based on the judgment from experts; considering the clarity, efficiency, and practicality of the self report measure and also considering the characteristics of the participants and in line with the problems investigated. The self report measure comprises of 23 statements that reflect the participants‟ experience in test taking. If the statement reflected their experience in test taking, they must place a check mark on the line next to the number of the statement. The individual scores of this self report measure were determined by circling the numbers to the statements that they had checked in the inventory. The areas they had answered “yes” to the most would help them identify the causes of their test anxiety in terms of test taker characteristics. The adapted self report measure is enclosed in Appendix 2.
Nur Ainani Fitria, 2013
Students’ Test Anxiety And Its Correlation With Their Academic Performance: A Study of
Undergraduate Students at a Private Higher Education Institution in Bandung Universitas Pendidikan Indonesia | repository.upi.edu| perpustakaan.upi.edu
The battery of self report measures itself was employed in this study in the classroom; there were eight classes observed for this study and it was done in July 2012, specifically from 2nd to 5th of July, 2012.
3.4.2 A Semi-structured Interview
Considering the clarity of the self report measures and the characteristics of the participants investigated, a semi-structured interview was conducted. In this study, to capture the richness and detail of test anxiety experienced by the students, a semi-structured interview was conducted on a one-to-one and face-to-face basis and recorded (as suggested by Silverman, 2005) to provide a permanent record. A semi-structured interview was considered to be the best to conduct in this study because this type of interview lets the interviewer off to look into the interviewee to be more detailed in giving responses or to follow a line of inquiry planned previously. The more responses interviewee gives, the higher possibility for the interviewer to get the data required (Heigham and Croker, 2009).
Furthermore, this type of interview offers “sufficient flexibility to probe some aspects in depth and, where necessary, to let the respondent lead in much the same way as in open interview” (Heigham and Croker, 2009, p. 186). In this regard, Merriam (1998, p. 74) says that the more flexibility the semi-structured interview offers is because of the use of less structured questions. In line with this, Gall et al. (2003, p. 240) state that “the semi-structured interview involves asking a series of structured questions and then probing more deeply using open-form questions to obtain additional information.” A list of questions that was formulated for the interview can be seen in Appendix 4.
24
Nur Ainani Fitria, 2013
Students’ Test Anxiety And Its Correlation With Their Academic Performance: A Study of
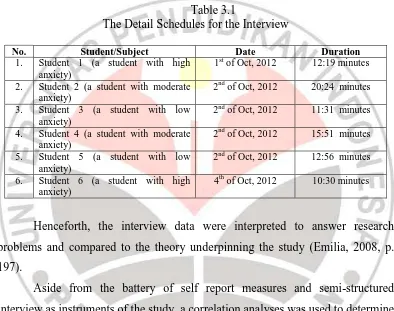
were their actions to each of those causal factors. In addition, two EFL students who exhibited moderate test anxiety and two EFL students who exhibited low test anxiety were interviewed to compare with the highly anxious students. The time required for the interview ranged from 11 to 20 minutes.
The detail schedules for the interview can be seen as follows.
Table 3.1
The Detail Schedules for the Interview
No. Student/Subject Date Duration
1. Student 1 (a student with high
Henceforth, the interview data were interpreted to answer research problems and compared to the theory underpinning the study (Emilia, 2008, p. 197).
Nur Ainani Fitria, 2013
Students’ Test Anxiety And Its Correlation With Their Academic Performance: A Study of
Undergraduate Students at a Private Higher Education Institution in Bandung Universitas Pendidikan Indonesia | repository.upi.edu| perpustakaan.upi.edu
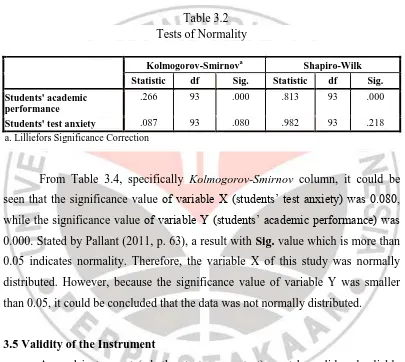
correlation when the distribution is not normal. The following table illustrates the distribution of data.
Table 3.2 Tests of Normality
Kolmogorov-Smirnova Shapiro-Wilk
Statistic df Sig. Statistic df Sig.
Students' academic performance
.266 93 .000 .813 93 .000
Students' test anxiety .087 93 .080 .982 93 .218
a. Lilliefors Significance Correction
From Table 3.4, specifically Kolmogorov-Smirnov column, it could be seen that the significance value of variable X (students‟ test anxiety) was 0.080, while the significance value of variable Y (students‟ academic performance) was 0.000. Stated by Pallant (2011, p. 63), a result with Sig. value which is more than 0.05 indicates normality. Therefore, the variable X of this study was normally distributed. However, because the significance value of variable Y was smaller than 0.05, it could be concluded that the data was not normally distributed.
3.5Validity of the Instrument
A good instrument (whether test or non-test) must be valid and reliable (Sugiyono, 2011, p. 169). This is intended to collect the valid and reliable data. Sugiyono (2011, p. 168) notes that by using the valid and reliable instruments in collecting data, it is expected that the result of the study is also valid and reliable.
26
Nur Ainani Fitria, 2013
Students’ Test Anxiety And Its Correlation With Their Academic Performance: A Study of
which was a battery of self report measures, according to Sugiyono (2011, p. 170), to be stated as a valid instrument, it only needed to fulfill construct validity. Moreover, in this study, the two self report measures were employed to measure attitude.
Dealing with construct validity, Hadi (cited in Sugiyono, 2011, p.170) treats construct validity like logical validity or validity by definition. Thus, an instrument can be stated for having construct validity if it can be used to measure the phenomenon as its definition is. Further, to utter an appropriate definition, the researcher needs several theories to consult with. In this case, Hadi states that when the theories used to utter a definition are already appropriate, the result of measurement using the instrument which is based on those theories is already able to be stated as a valid result.
To test the construct validity, the judgment from experts was employed in this study. For expert judgment, at least three doctorate experts are needed (Sugiyono, 2011, p. 172). Hence, in this study, the judgment was done by two doctorate lecturers from Educational Psychology and Guidance program and a doctorate lecturer from Early Childhood Teacher Education program with counseling as his area of expertise. In this regard, the measured aspects of an instrument (a battery of self report measures, in this study) which were already constructed based on certain theories (i.e. Liebert and Morris, 1967; Morris et al., 1981) were consulted with the experts. Then, the experts judged whether the instrument could be used without revision, it could be used with revision, or it needed to be revised totally.
Nur Ainani Fitria, 2013
Students’ Test Anxiety And Its Correlation With Their Academic Performance: A Study of
Undergraduate Students at a Private Higher Education Institution in Bandung Universitas Pendidikan Indonesia | repository.upi.edu| perpustakaan.upi.edu
Morris et al., 1981). Leaving from the two-component model of test anxiety, the
definition of test anxiety for this study is a feeling of apprehension and discomfort
accompanied by cognitive difficulties during a test. Therefore, relevant to other
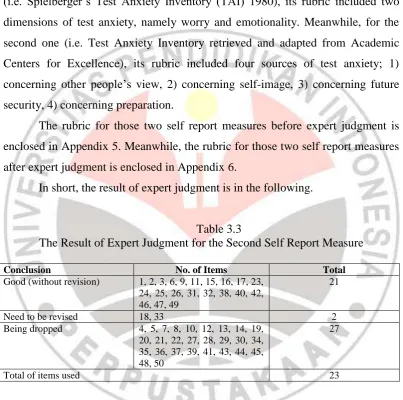
theories that have been referred to in this study, for the first self report measure (i.e. Spielberger‟s Test Anxiety Inventory (TAI) 1980), its rubric included two dimensions of test anxiety, namely worry and emotionality. Meanwhile, for the second one (i.e. Test Anxiety Inventory retrieved and adapted from Academic Centers for Excellence), its rubric included four sources of test anxiety; 1) concerning other people‟s view, 2) concerning self-image, 3) concerning future security, 4) concerning preparation.
The rubric for those two self report measures before expert judgment is enclosed in Appendix 5. Meanwhile, the rubric for those two self report measures after expert judgment is enclosed in Appendix 6.
In short, the result of expert judgment is in the following.
Table 3.3
The Result of Expert Judgment for the Second Self Report Measure
Conclusion No. of Items Total
Good (without revision) 1, 2, 3, 6, 9, 11, 15, 16, 17, 23,
28
Nur Ainani Fitria, 2013
Students’ Test Anxiety And Its Correlation With Their Academic Performance: A Study of
appropriate to be employed in this study, which was to find out the factors that have caused EFL students‟ test anxiety.
Meanwhile, for the first self report measure (i.e. Spielberger‟s TAI 1980), its validity has been proved. Widely employed in many studies to evaluate individual differences in test anxiety, TAI has demonstrated its validity in “before” and “after” research project. Spielberger and Vagg; Zeidner et al. (cited in Toubiana, 2005, p. 65) admit that „the effectiveness of different therapeutic approaches, such as systematic desensitization and cognitive behavior modification, have been evaluated.‟ Therefore, this self report measure was also considered appropriate to be employed in this study, which was to find out the test anxiety levels experienced by EFL students.
3.6Reliability of the Instrument
Reliability is “the consistency of the scores produced by a measurement tool” (Ross, 2006, p. 2). Meanwhile, Anderson et al. (cited in Arikunto, 2009, p. 87) say that „a reliable measure is the one that provides consistent and stable indication of the characteristic being investigated‟. In other words, reliability refers to the extent to which measurements are consistent. Regarding reliability, Anderson et al. say that the validity inferred from the instruments is essential - even more crucial than the reliability. Also, it is possible for a reliable instrument to be invalid; on the contrary, a valid instrument is usually reliable. Fink (2003; 2006) also states the same thing that a valid instrument is always reliable.
Based on this assumption, a battery of self report measures employed in this study was considered to be reliable. The Spileberger‟s TAI total scores have very high alpha coefficients, ranging between 0.92 and 0.96 (Spielberger, cited in Bushman et al. 2005, p. 80). It means that the TAI has high internal consistency reliability.
Nur Ainani Fitria, 2013
Students’ Test Anxiety And Its Correlation With Their Academic Performance: A Study of
Undergraduate Students at a Private Higher Education Institution in Bandung Universitas Pendidikan Indonesia | repository.upi.edu| perpustakaan.upi.edu
The data taken from the battery of self report measures (consisting of Spielberger‟s Test Anxiety Inventory (TAI) 1980 and a Test Anxiety Inventory retrieved and adapted from Academic Centers for Excellence) were elaborated and analyzed to answer the first and second research problem. The data analysis was organized based on each data collection technique.
In this study, the data that had been collected were analyzed based on the concept of data analysis given by Miles and Huberman (1984) in the following.
The analysis involves (1) selecting, focusing, simplifying, abstracting, and transforming the "raw" data which has been collected; (2) organizing and displaying the data, so as to allow conclusions to be drawn; and (3) drawing conclusions, by noting regularities, patterns, explanations, possible configurations, causal flows and propositions, and verifying those conclusions (pp. 21-22).
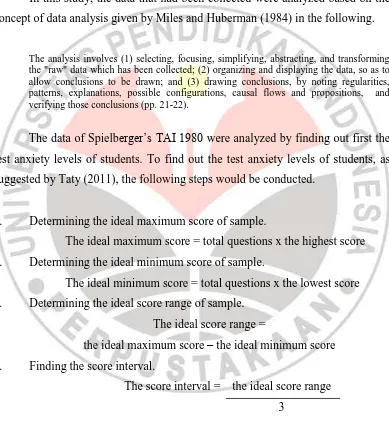
The data of Spielberger‟s TAI 1980 were analyzed by finding out first the test anxiety levels of students. To find out the test anxiety levels of students, as suggested by Taty (2011), the following steps would be conducted.
1. Determining the ideal maximum score of sample.
The ideal maximum score = total questions x the highest score 2. Determining the ideal minimum score of sample.
The ideal minimum score = total questions x the lowest score 3. Determining the ideal score range of sample.
The ideal score range =
the ideal maximum score – the ideal minimum score 4. Finding the score interval.
The score interval = the ideal score range 3
Then, the distribution of test anxiety level would be reflected as follows.
Table 3.4
30
Nur Ainani Fitria, 2013
Students’ Test Anxiety And Its Correlation With Their Academic Performance: A Study of
No. Interval Test Anxiety Level
1 20 – 40 Low
2 40 – 60 Moderate
3 60 – 80 High
Meanwhile, the data of Test Anxiety Inventory retrieved and adapted from Academic Centers for Excellence were analyzed by finding out first the factors that have caused EFL students‟ test anxiety. The areas that the participants had answered “yes” to the most would identify the causes of their test anxiety in terms of test taker characteristics.
The analysis of interview was conducted through several steps. The first step was transcribing (syntactic or orthographic transcription) the data from spoken (recorded form) to become written form. The second step was coding. The data from interview were coded according to Gail Jefferson (cited in Wray et al. 2001, pp. 202-211). The key of the convention symbols used in this study is as
It is used if the pause occurs within a speaker‟s turn.
It is used if the pause occurs between different speakers‟ turns.
A colon will be used immediately after the lengthened sound (in certain syllable), the longer the sound, the more colons will be used.
This latching, equals sign, is used at the end of the first component and the beginning of the second one.
It is used when the writer can hear the sounds but cannot work out what the words are.
A double oblique line put into the established speaker‟s line at the
point of interruption, and start the new speaker on the next line.
A double opening square bracket is used when more than one speaker speak.
If the language used is not English, the transcription will be written in italic.
The bracket is used to give more explanation on what the students do
Nur Ainani Fitria, 2013
Students’ Test Anxiety And Its Correlation With Their Academic Performance: A Study of
Undergraduate Students at a Private Higher Education Institution in Bandung Universitas Pendidikan Indonesia | repository.upi.edu| perpustakaan.upi.edu
- : A dash is used when the speaker has not finished the word uttered.
Then, the data were categorized. The third step was counting the data, and the last one was data analysis. It was expected that interview could open up more details about some of the specific things that usually bother the participants of the study in testing situation, especially the causes of their test anxiety in terms of test characteristics.
To answer the third research question, which was is there any relationship between students’ test anxiety and their academic performance?, a correlation analyses was used. Thus, the test anxiety levels experienced by EFL students were correlated to the students‟ GPA. In this regard, the Statistical Package for Social Sciences (SPSS) version 17.0 was used to analyze and calculate the data. This tool was considered to be much more practical and efficient, and provide more accurate analysis result. Accordingly, the degree of correlation which is generally expressed in ρ (Rho) was obtained. Then, this indicated both direction (whether positive or negative) and strength of the relationship between the two variables. A positive correlation indicated that as one variable increased, so did the other. Meanwhile, a negative correlation indicated that as one variable increased, the other decreased.
Henceforth, to determine the strength of the relationship between the two variables, the researcher applied Cohen‟s suggestion (1988, pp. 79–81) that correlation results can be interpreted as follows.
• r = 0.10 to 0.29 (small correlation) • r = 0.30 to 0.49 (medium correlation) • r = 0.50 to 1.00 (high correlation).
32
Nur Ainani Fitria, 2013
Students’ Test Anxiety And Its Correlation With Their Academic Performance: A Study of
The last thing to do was assessing the significance level (listed as Sig. 2 tailed). The level of statistical significance indicated how much confidence the researcher should have in the results of study. More importantly, it indicated whether the null hypothesis was rejected or accepted based on the certain level of significance. O‟neil (2009, p. 32) mentions that in SPSS, the p-value tells us whether results are statistically significant or not. Besides, for most research, the significance level of 0.05 or 0.01 is used. Thus, if the p-value is smaller than 0.05, the results will be statistically significant by 0.05. On the contrary, if the p-value is larger than 0.05, the results will not generally be accepted as “significant”. Finally, in this study, the null hypothesis was rejected when the p-value was smaller than 0.05. Meanwhile, when the p-value was larger than 0.05, the null hypothesis was accepted.
3.8Concluding Remarks
This chapter explains how the data in this study were collected and analysed. The primary data were taken from a battery of self report measures (including Spielberger‟s Test Anxiety Inventory (TAI) 1980 and a Test Anxiety Inventory retrieved and adapted from Academic Centers for Excellence) that was employed in the classroom - there were eight classes observed for this study - and was done in July 2012, specifically from 2nd to 5th of July, 2012.
Meanwhile, the secondary data were from the interview with six students chosen based on the results of Spielberger‟s TAI 1980 (i.e. two EFL students who exhibited high test anxiety, two EFL students who exhibited moderate test anxiety, and two EFL students who exhibited low test anxiety). Then, the data gathered from interview were transcribed, coded, categorized, counted, and analyzed.
Nur Ainani Fitria, 2013
Students’ Test Anxiety And Its Correlation With Their Academic Performance: A Study of
Undergraduate Students at a Private Higher Education Institution in Bandung Universitas Pendidikan Indonesia | repository.upi.edu| perpustakaan.upi.edu
answered “yes” to the most would identify the causes of their test anxiety in terms of test taker characteristics.
Furthermore, a correlation analyses was used to identify the degree of correlation between students' test anxiety and their academic performance. Regarding this, the Statistical Package for Social Sciences (SPSS) version 17.0 was used to analyze and calculate the data.
CHAPTER V
CONCLUSIONS AND RECOMMENDATIONS
Based on the research findings and discussions presented in the previous chapter, some conclusions and recommendations are formulated. It is expected that observing the two important variables of the present study (i.e. the students’ test anxiety and their academic performance) gives useful contributions to the teachers and others who concern with education, especially the area of students’ test anxiety and their academic performance.
5.1 Conclusions
Based on data from a battery of self report measures (comprising of
Spielberger’s Test Anxiety Inventory (TAI) 1980 and a Test Anxiety Inventory retrieved and adapted from Academic Centers for Excellence) and a semi-structured interview, some conclusions can be drawn.
To answer the first research question: What test anxiety levels are experienced by EFL students?, based on the scores the respondents gained
through TAI, it was found that the students experienced low test anxiety level (49 out of 93 students or 52.69 % of the total of respondents), moderate test anxiety level (42 out of 93 students or 45.16% of the total of respondents), and high test anxiety level (2 out of 93 students or 5.88 % of the total of respondents). Even though their test anxiety levels varied across different items of TAI, there was no student that had no test anxiety. It is in line with Horwitz et al.’s statement (1986, pp. 127-128) that test anxiety is a distinct phenomenon particularly to language learning.
The majority of the students (52.69%) experienced low anxiety. It could be argued that a number of reasons, such as test preparation (Damer and Melendres,
2011; Jaradat, 2004, p. 8; Zeidner, 1998), students’ familiarity with testing
condition (Putwain, 2008; Birjandi and Alemi, 2010), and maturity in terms of
Nur Ainani Fitria, 2013
Students’ Test Anxiety And Its Correlation With Their Academic Performance: A Study of
Undergraduate Students at a Private Higher Education Institution in Bandung Universitas Pendidikan Indonesia | repository.upi.edu| perpustakaan.upi.edu
More importantly, test anxiety does affect the performance of students on a high-stakes test (Chang and Read, 2008, p. 2). In other words, the percentages reflect the fact that the tests were low-stakes tests for most students. Then, it sounds to reason that as a whole, the students experienced low anxiety.
To answer the second research question: What factors have caused EFL
students’ test anxiety?, from the data of Test Anxiety Inventory retrieved and adapted from Academic Centers for Excellence, it was found that most of students stated that their cause of feeling anxious was concerning self-image (28.11%). Then, it was followed by concerning other people’s view (26.92%), preparation (23.86%), and future security (21.11%). This finding is in line with Raof and
Nasir’s (2010) statement that test anxiety occurs when the students are to do with other people’s view, self-image, future security, and preparation.
Meanwhile, from the data of interview, factors that have caused the
students’ test anxiety are also to do with other people’s view, self-image, and preparation. Besides, there were situational and subjective determinants of test anxiety (as revealed by Jaradat (2004)). They were also anxious because of testing situation factors (as stated by Chen (2004)). In addition, they were anxious when they wanted to get a high score (in line with Horwitz et al.’s (1986) statement) and when they faced personal problems (as identified by Busari and Osiki (2002)).
Aside from those causal factors of students’ test anxiety mentioned above, based on the data of interview, the researcher found other factors that have caused the EFL students to feel anxious, specifically in terms of test characteristics. Those were item type, time pressure, length of the test, item difficulty sequencing, and test taking information. All the five test characteristics had an effect on
63
To answer the third research question: Is there any correlation between
students’ test anxiety and their academic performance?, it was found that the
Spearman correlation coefficient between students’ test anxiety and their
academic performance was –0.192. It indicated that both variables were negatively correlated. The negative correlation between both variables meant that the highest the students’ test anxiety was, the lowest their academic performance was. Besides, those two variables had a small correlation – based on Cohen’s suggestion (1988, pp. 79–81).
Henceforth, since the p-value (0.065) was larger than 0.05, the students’ test anxiety had no statistically significant correlation with their academic performance. Therefore, the null hypothesis of this study was accepted. It meant that there was lack of test anxiety on students when they did the tests. Furthermore, the lack of test anxiety showed that for the students, the tests were not considered as a problem that could make them anxious. This phenomenon could have two meanings. Firstly, the students were already well-prepared in doing the tests and they did not face constraints in learning. Secondly, they neglected the significance of the tests to assess their academic performance. This case needs more specific concern and further research.
The finding of this study confirmed some studies showing non-significant
correlation between test anxiety and students’ achievement statistically (e.g.
Birjandi and Alemi (2010), Ndirangu et al. (2009), Zimmer and Hocevar (1994)). Going with them, Yuen and Chu (n.d.) find that there is a negative, but not significant relationship between oral test performance in English and anxiety.
In’nami (2006) also finds that test anxiety does not influence the students’
performance in a listening test.
Nevertheless, the finding of this study contrasted with some other studies
reporting the existence of relationship between students’ test anxiety and their
Nur Ainani Fitria, 2013
Students’ Test Anxiety And Its Correlation With Their Academic Performance: A Study of
Undergraduate Students at a Private Higher Education Institution in Bandung Universitas Pendidikan Indonesia | repository.upi.edu| perpustakaan.upi.edu
the lack of instrument of this study that was less able to distinguish between students with high anxiety and the ones with low anxiety, the lack of amount of
samples involved in this study, and the data for the students’ academic
performance that was too general and less specific. It was indeed that the data for
students’ academic performance in this study was taken from the total number of subjects. The researcher did not specify to take one of subjects, for instance the
most challenging subject like speaking. This goes with Chang and Read’s
statement (2008, p. 2) that test anxiety does affect the performance of students on a high-stakes test.
As to the result of hypothesis of this study, whether or not the students’ test anxiety had statistically significant correlation with their academic performance, reducing the discomfort that some highly anxious test takers experienced would seem to be a laudable undertaking in an academic setting.
5.2 Recommendations
Information about the relationship between students’ test anxiety and their
academic performance could be important for educators who develop educational programs and implement teaching strategies. Particularly for teachers, it is wise for them to be aware of the phenomenon that happens to their students and try to find what aspect that really affects the students’ academic performance, instead of test anxiety. In line with the assumption issued related to the third finding of this study, it is necessary to investigate preparation as one of aspects that may affect
the students’ academic performance.
Meanwhile, in accordance with the second finding of this study (i.e.
factors affecting students’ test anxiety, specifically in terms of test characteristics), it is necessary for further researchers to design a test while paying special attention to the five characteristics of item type, time pressure, length of the test, item difficulty sequencing, and test taking information in the same time. Henceforth, the researchers are required to test the controlled test, so that they can confirm the claim that the change of test characteristics will result in the change of
65
Like every other study, this study had certain limitations. The first possible limitation was regarding the sample size. All the participants were the undergraduate students at a private higher education institution in Bandung with English as their major. Thus, generalizability of the results would be limited with this sample. Leaving from this limitation, further studies should use a large sample for the desired results. The second limitation was consideration that this study was still a pilot or mini-scale study. Hence, there is need for further studies in this area by using the different methods, instruments, and subjects of the study. Therefore, those studies can enhance the richness of aspects related to the
students’ test anxiety.
Nur Ainani Fitria, 2013
Students’ Test Anxiety And Its Correlation With Their Academic Performance: A Study of Undergraduate Students at a Private Higher Education Institution in Bandung
Universitas Pendidikan Indonesia | repository.upi.edu| perpustakaan.upi.edu
Abbott, C. (2009). Are There Differences in Test Anxiety Levels for Middle School Students with and without Disabilities?. Unpublished Thesis, Ohio University, Ohio. Retrieved February 12, 2013 from http://www.cehs.ohio.edu/resources/documents/abbott.pdf
Acka, F. (2011). The Relationship between Test Anxiety and Learned Helplessness. Social Behavior and Personality, 39(1), 101-112. Retrieved
November 19, 2012 from
http://content.ebscohost.com/pdf25_26/pdf/2011/2ef/01feb11/58034293.pd f
Arikunto, S. (2001). Dasar-Dasar Evaluasi Pendidikan Edisi Revisi. Jakarta: PT Bumi Aksara.
Ary, D., Jacobs, L. C., & Razavieh, A. (1985). Introduction to Research in Education, Third Edition. New York: Holt, Rinehart and Winston.
Aydin, S. (2009). Test Anxiety among Foreign Language Learners: A Review of Literature. Journal of Language and Linguistic Studies, 5(1), 127-137.
Retrieved April 18, 2012 from
http://jlls.org/Issues/Volume%205/No.1/saydin.pdf.
Aydin, S., Yavuz, F., & Yesilyurt, S. (2006). Test Anxiety in Foreign Language Learning. Balikesir University, Journal of Social Sciences Institute, 9(16),
145-160. Retrieved April 18, 2012 from
http://sbe.balikesir.edu.tr/dergi/edergi/c9s16/makale/c9s16m8.pdf.
Beidel, D. C., Turner, S. M., & Taylor-Ferreira, J. C. (1999). Teaching Study Skills and Test-Taking Strategies to Elementary School Students: The Testbusters Program. Behavior Modification, 23(4), 630-646. Retrieved
November 26, 2012 from
http://clint.sharedwing.net/research/study%20skills/teaching%20study%20 skills2.pdf
Birjandi, P. & Alemi, M. (2010). The Impact of Test Anxiety on Test Performance among Iranian EFL Learners. Broad Research in Artificial Intelligence and Neuroscience (BRAIN), 1(4), 44-58. Retrieved November 26, 2012 from http://www.edusoft.ro
Bodas, J. & Ollendick, T. H. (2005). Test Anxiety: A Cross-Cultural Perspective. Clinical Child and Family Psychology Review, 8(1), 65-88. Retrieved
April 18, 2012 from
http://letsspeakgerman.com/Documents/crosscultural.pdf.
1-67
9. Retrieved November 21, 2012 from
http://unilorin.edu.ng/journals/education/ije/dec2002/TEST%20ANXIETY %20MANAGEMENT%20FOR%20STUDENTS.pdf
Burns, D. J. (2004). Anxiety at the Time of the Final Exam: Relationships with Expectations and Performance. Journal of Education for Business, 80(2), 119-124. Retrieved November 26, 2012 from http://tlc.apa.uoit.ca/wp-content/uploads/2011/12/Anxiety-at-the-time-of-the-exam.pdf
Bushman, B. J., Vagg, P. R., & Spielberger, C. D. (2005). Culture and Gender Factors in the Structure of the Test Anxiety Inventory: A Meta-Analysis. In C. D. Spielberger & I. G. Sarason (Eds.), Stress and Emotion: Anxiety, Anger, and Curiosity Volume 17 (pp. 77-95). New York and Great Britain: Routledge Taylor & Francis Group.
Centers for Disease Control and Prevention. (2010). The Association between School Based Physical Activity, including Physical Education, and Academic Performance. Atlanta, GA: U.S. Department of Health and Human Services. Retrieved April 18, 2012 from
http://www.cdc.gov/healthyyouth/health_and_academics/pdf/pa-pe_paper.pdf.
Chan, D. Y. & Wu, G. (2004). A Study of Foreign Language Anxiety of EFL Elementary School Students in Taipei County. Journal of National Taipei Teachers College, 17 (2), 287-320. Retrieved April 17, 2012 from Gubi, A., & McCann, N. (2005). Test Anxiety and Academic Performance in Undergraduate and Graduate Students. Journal of Educational Psychology, 97(2), 268-274. Retrieved April 18, 2012 from https://www.mercy.edu/libraries/samplearticlepsyn101.pdf.
Chen, J. (2004). Effects of Test Anxiety, Time Pressure, Ability and Gender on Response Aberrance. Unpublished Dissertation, The Ohio State University, Ohio. Retrieved April 17, 2012 from http://etd.ohiolink.edu/send-pdf.cgi/Chen%20Jing.pdf?osu1092840837. Chen, M. (2007. Test Anxiety, Reading Anxiety, and Reading Performance among
University English as Second Language Learners. Unpublished Thesis, Ming Chuan University, Taiwan. Retrieved November 26, 2012 from http://ethesys.lib.mcu.edu.tw
Nur Ainani Fitria, 2013
Students’ Test Anxiety And Its Correlation With Their Academic Performance: A Study of Undergraduate Students at a Private Higher Education Institution in Bandung
Universitas Pendidikan Indonesia | repository.upi.edu| perpustakaan.upi.edu
College Students. Journal for Specialists in Group Work, 36(3), 163-177.
Retrieved April 19, 2012 from
http://20.132.48.254/ERICWebPortal/search/recordDetails.jsp?ERICExtSe arch_Descriptor=%22Criticism%22&_pageLabel=RecordDetails&accno= EJ933268&_nfls=false.
Demirci, N. (2007). Turkish Prospective Teachers’ Perspective of Different Types of Exams: Multiple Choice, Essay and Computerized-type Testing. Essays in Education Special Edition, 48-62. Retrieved February 20, 2013 from http://www.usca.edu/essays/specialedition/NesetDemirci.pdf
Emilia, E. (2008). Menulis Tesis dan Disertasi. Bandung: ALFABETA.
Essential Academic Skills Second Edition (2011). Edited by Kathy Turner, Brenda Krenus, Lynette Ireland, and Leigh Pointon. Oxford: Oxford University
Press. Retrieved November 26, 2012 from
http://www.oup.com.au/__data/assets/pdf_file/0003/320961/Sample_essay .pdf
Fink, A. (2003). The Survey Handbook 2nd Edition. California: Sage Publications, Inc. Retrieved October 29, 2012 from http://srmo.sagepub.com/view/the-survey-handbook/n3.xml
Fink, A. (2006). How to Conduct Surveys: A Step-by-Step Guide Third Edition. California: Sage Publications, Inc.
Gall, M. D., Borg, W. R. & Gall, J. P. (2003). Educational Research: An Introduction. 7th Edition. Oregon: Pearson Education, Ltd.
Gay, L. R. (1987). Educational Research: Competencies for Analysis and Application. Third Edition. Columbus, Ohio: Merill.
Hatch, E. & Farhady, H. (1982). Research Design and Statistics for Applied Linguistics. Massachussetts: Newbury House Publishers, Inc.
Hatch, E. & Lazaraton, A. (1991). The Research Manual: Design and Statistics for Applied Linguistics. USA: Heinle & Heinle Publisher.
Heigham, J. & Croker, R. A. (2009). Qualitative Research in Applied Linguistics: A Practical Introduction. London: Palgrave Macmillan.
Hembree, R. (1988). Correlates, Causes, Effects, and Treatment of Test Anxiety. Review of Educational Research, 58(1), 47-77. Retrieved April 17, 2012 from http://rer.sagepub.com/content/58/1/47.abstract.
Horwitz, E. K., Horwitz, M. B., & Cope, J. (1986). Foreign Language Classroom Anxiety. The Modern Language Journal, 70(2), 125-132. Retrieved April
69
http://leighcherry.wikispaces.com/file/view/FL+Classroom+Anxiety+--+Horwitz.pdf
In’nami, Y. (2006). The Effects of Test Anxiety on Listening Test Performance. System, 34(3), 317-340. Retrieved November 26, 2012 from http://www.sciencedirect.com/science/article/pii/S0346251X06000571 Jaradat, A. M. (2004). Test Anxiety in Jordanian Students: Measurement,
Correlates, and Treatment. Unpublished Dissertation, Philipps-University of Marburg, Germany. Retrieved November 26, 2012 from http://archiv.ub.uni-marburg.de/diss/z2004/0124/pdf/dakmj.pdf
Kvale, S. (1996). Interview: An Introduction to Qualitative Research Interviewing. California: SAGE Publication.
Liebert, R. M. & Morris, L. W. (1967). Cognitive and Emotional Componenets of Test Anxiety: A Distinction and Some Initial Data. Psychological Reports, 20, 975-978. Retrieved January 14, 2013 from http://www.amsciepub.com/doi/abs/10.2466/pr0.1967.20.3.975
Lowe, P. A., Grumben, M. J., & Raad, J. M. (2011). Examination of the Psychometric Properties of the Test Anxiety Scale for Elementary Students (TAS-E) Scores. Journal of Psychoeducational Assessment,
29(6), 503-514. Retrieved April 17, 2012 from
http://jpa.sagepub.com/content/29/6/503.full.pdf+html.
Lufi, D., Okasha, S., & Cohen, A. (2004). Test Anxiety and Its Effect on the Personality of Students with Learning Disabilities. Learning Disability
Quarterly, 27(3). Retrieved January 14, 2013 from
http://www.questia.com/library/1G1-122258760/test-anxiety-and-its-effect-on-the-personality-of
Merriam, S.B. (1998). Qualitative Research and Case Study Application in Education: Revisited and Expanded from Study Research in Education. San Fransisco: Jossey-Bass Publisher.
Miles, M. B. & Huberman, A. M. (1984). Qualitative Data Analy-sis: A Sourcebook of New Members. Beverly Hills, CA: SAGE.
Morris, L. W., Davis, M. A. & Hutchings, C. H. (1981). Cognitive and Emotional Components of Anxiety: Literature Review and a Revised Worry– Emotionality Scale. Journal of Educational Psychology, 73(4), 541-555.
Retrieved January 14, 2013 from
http://psycnet.apa.org/index.cfm?fa=buy.optionToBuy&id=1981-29605-001
Nur Ainani Fitria, 2013
Students’ Test Anxiety And Its Correlation With Their Academic Performance: A Study of Undergraduate Students at a Private Higher Education Institution in Bandung
Universitas Pendidikan Indonesia | repository.upi.edu| perpustakaan.upi.edu from
http://www.globaljournalseries.com/index/index.php/gjer/article/viewFile/ 55/pdf.
Nemati, A. (2012). On the Dimensions of Test Anxiety and Foreign Language Learners. International Journal of English and literature 3(4), 97-102.
Retrieved January 14, 2013 from
http://www.academicjournals.org/ijel/PDF/pdf2012/Apr/Nemati.pdf Nemati, A. & Habibi, P. (2012). The Effect of Practicing Pranayama on Test
Anxiety and Test Performance. Indian Journal of Science and Technology, 5(4). Retrieved February 12, 2013 from http://www.indjst.org/archive/Apr-12/25_pranayam.pdf
Ohata, K. (2005). Potential Sources of Anxiety for Japanese Learners of English: Preliminary Case Interviews with Five Japanese College Students in the US. TESL-EJ, 9(3). Retrieved February 4, 2012 from http://tesl-ej.org/ej35/a3.pdf.
O’neil, S. (2009). Basic Statistics for the Utterly Confused. Paper presented at the University of Pretoria, Faculty of Economic and Management Science,
Pretoria. Retrieved November 18, 2012 from
http://dl.is.vnu.edu.vn/dspace/bitstream/123456789/316/1/Statistics_4_Utt erly_Confused.pdf
Pallant, J. (2011). SPSS Survival Manual: A Step by Step Guide to Data Analysis Using SPSS 4th Edition. NSW: Allen & Unwin. Retrieved November 26,
2012 from
http://core.ecu.edu/ofe/StatisticsResearch/Survival%20Analysis%20Using %20SPSS.pdf
Powers, D. E. (1986). Test Anxiety and the GRE General Test. GRE Professional Report No. 83-17P, Educational Testing Service, Princeton, NJ. Retrieved November 26, 2012 from www.ets.org/Media/Research/pdf/RR-86-45-Powers.pdf
Purnamasari, R. L. (2012). Hubungan antara Tingkat Kecemasan ketika Menghadapi Ujian dengan Prestasi Belajar Siswa Kelas VII SMP Negeri 1 Haurgeulis – Indramayu. Unpublished Skripsi, Indonesia University of Education, Bandung.
Putwain, D. (2008). Examination Stress and Test Anxiety. The Psychologist, 21,
1026-1029. Retrieved January 14, 2013 from
http://www.thepsychologist.org.uk/archive/archive_home.cfm?volumeID= 21&editionID=167&ArticleID=1440
63-71
74. Retrieved April 18, 2012 from
http://results.pu.edu.pk/images/journal/ier/PDF-FILES/4-Rizwan%20Akram%20Rana.pdf.
Raof, A. H. A. & Nasir, N. H. B. A. (2010). Overcoming test anxiety: perspectives of senior students of the Faculty of Education. Unpublished Article, Universiti Teknologi Malaysia, Johor. Retrieved November 26, 2012 from http://eprints.utm.my/10243/2/Nurul_Hana_Binti_Ab_Nasir.pdf
Reteguiz, J. (2006). Relationship between Anxiety and Standardized Patient Test Performance in the MedicineClerkship. J Gen Intern Med, 21(5), 415-418.
Retrieved February 12, 2013 from
http://www.ncbi.nlm.nih.gov/pmc/articles/PMC1484796/
Rezazadeh, M. & Tavakoli, M. (2009). Investigating the Relationship among Test Anxiety, Gender, Academic Achievement and Years of Study: A Case of Iranian EFL University Students. English Language Teaching, 2(4), 68-74.
Retrieved April 18, 2012 from
http://ccsenet.org/journal/index.php/elt/article/view/4449/3789.
Ross, J. A. (2006). The Reliability, Validity, and Utility of Self-Assessment. Practical Assessment, Research & Evaluation, 11(10), 1-13. Retrieved October 23, 2012 from http://pareonline.net/getvn.asp?v=11&n=10
Samelian, M. (2010). Increasing Stakes in Testing: the Impact on Test Anxiety in Middle School Students. School Psychology Program Directed Research Project, University of Wisconsin, River Falls. Retrieved November 19, 2012 from http://minds.wisconsin.edu
Sarason, I. G. (1983). Understanding and Modifying Test Anxiety. In S. B. Anderson &J. S. Helmick (Eds.), On Educational Testing: Intelligence, Performance Standards, Test Anxiety, and Latent Traits (pp. 133-149). California & London: Jossey-Bass Publishers.
Selkirk, L. C., Bouchey, H. A., & Eccles, J. S. (2010). Interactions among Domain-Specific Expectancies, Values, and Gender: Predictors of Test Anxiety during Early Adolescence. The Journal of Early Adolescence,
31(3), 361-389. Retrieved April 17, 2012 from
http://jea.sagepub.com/content/31/3/361.full.pdf+html.
Semper, H. M. (2008). Using a Trait Complex Model to Predict Types of Academic Performance in Undergraduate Medical Education in the UK. Unpublished Thesis, The University of Nottingham, UK. Retrieved April
18, 2012 from
http://etheses.nottingham.ac.uk/878/1/Heather_Semper_MPhil_2009.pdf. Silverman, D. (2005). Doing Qualitative Research. 2nd Edition. London: Sage
Nur Ainani Fitria, 2013
Students’ Test Anxiety And Its Correlation With Their Academic Performance: A Study of Undergraduate Students at a Private Higher Education Institution in Bandung
Universitas Pendidikan Indonesia | repository.upi.edu| perpustakaan.upi.edu
evaluation and assessment in higher education: a review1. Assessment &
Evaluation in Higher Education, 30(4), 331–347. Retrieved February 20,
2013 from
https://perswww.kuleuven.be/~u0015308/Publications/Proof%20CAEH30 0401.pdf
Sugiyono. (2011). Metode Penelitian Kuantitatif, Kualitatif, dan Kombinasi (Mixed Methods). Bandung: ALFABETA.
Taty. (2011). Model Konseling Behavioristik untuk Membantu Siswa Mengatasi Kecemasan Belajar. Unpublished Dissertation, Indonesia University of Education, Bandung.
Tenenbaum, L. S. (2012). A School-Based Intervention for Third Grade Students Experiencing Test Anxiety. Unpublished Dissertation, Georgia State University, Georgia. Retrieved April 17, 2012 from http://digitalarchive.gsu.edu/cgi/viewcontent.cgi?article=1072&context=cp s_diss.
Toubiana, J. (2005). Evaluation of Test Anxiety Using Pictorial Evaluation of Test Reactions (PETER). In C. D. Spielberger & I. G. Sarason (Eds.), Stress and Emotion: Anxiety, Anger, and Curiosity Volume 17 (pp. 61-75). New York and Great Britain: Routledge Taylor & Francis Group.
Tresna, I. G. (2012). Efektivitas Konseling Behavioral dengan Teknik Desensitisasi Sistematis untuk Mereduksi Kecemasan Menghadapi Ujian: Studi Eksperimen pada Siswa Kelas X SMA Negeri 2 Singaraja Tahun Ajaran 2010/2011. Unpublished Dissertation, Indonesia University of Education, Bandung.
Tsai, Y. & Li, Y. (2012). Test Anxiety and Foreign Language Reading Anxiety in a Reading-Proficiency Test. Journal of Social Sciences, 8(1), 95-103. Retrieved February 12, 2013 from http://thescipub.com
Van der Linde, G. J. (2005). The Role of Environmental Quality and Time Perspective on the Academic Performance of Grade 12 Learners. Unpublished Thesis, University of the Free State, Bloemfontein, South Africa. Retrieved April 18, 2012 from http://etd.uovs.ac.za/ETD-
db/theses/available/etd-09142006-085341/unrestricted/VanDerLindeGJ.pdf.
Wray, A. & Bloomer, A. (2001). Project in Linguistics: A Practical Guide to Researching Language. London: Foreign Language Teaching and Research Press, Edward Arnold Limited.
73
Coping, 17(3), 227-240. Retrieved January 14, 2013 from
http://www.andrews.edu/sed/gpc/faculty-research/montagano-research/measuring-test-anxie.pdf
Xiaoping, J. (2009). EFL Test Anxiety among Chinese Graduate Students: Effects of Test Characteristics. Indonesian Journal of English Language Teaching, 5(2), 108-130.
Yousefi, F., Talib, M. A., Mansor, M. B., Juhari, R. B., & Redzuan, M. (2010). The Relationship between Test-Anxiety and Academic Achievement among Iranian Adolescents. Asian Social Science, 6(5), 100-105.
Retrieved April 18, 2012 from
http://ccsenet.org/journal/index.php/ass/article/view/5979/4783.
Yuen, D. & Chu, S. (n.d.) The Effect of Perceived Anxiety on the English Oral Test Performance. Journal of Humanities and Social Sciences, 1, 187-193.
Retrieved November 20, 2012 from
http://web.hk.edu.tw/~humanities/journa/1-14.pdf
Zeidner, M. (1998). Test Anxiety: The State of the Art. New York: Plenum Press. Zimmer, J. W. & Hocevar, D. J. (1994). Effects of Massed Versus Distributed
Practice of Test Taking on Achievement and Test Anxiety. Psychological
Reports, 74, 915-919. Retrieved November 26, 2012 from