70 P-ISSN:2356-3109 E-ISSN: 2356-3117
IDENTIFICATION OF PATCHOULI PLANTS USING LANDSAT-8 SATELLITE IMAGERY AND IMPROVED K-MEANS METHOD
Candra Dewi1, Muhammad Syaifuddin Zuhri2, Achmad Basuki3, Budi Darma Setiawan4
1,2,3,4
Informatics Department, Universitas Brawijaya, Malang, Indonesia Email : [email protected]
, [email protected], [email protected]
ABSTRACT
To maintain the availability of the patchouli plants required monitoring the spread of patchouli plantation. This study performed the identification of patchouli plant through Landsat-8 satellite imagery and Improved K-Means method. Improved was done on this study include the process of determining the initial cluster by specifying the closeness between the data and the determination of the number of cluster (K) by using the histogram equalization technique. The result of internal criteria testing shows that determining the number of clusters using the histogram is less effective because it produces the lower value of the silhouette. On almost all image data test found the best value of the silhouette's coefficient is 75.089% at K=2 and data in February. Furthermore, based on the results of testing the external criteria known the highest purity value in February data with a number of cluster 5 is 0.6829268. The test results also show that the use of the Improved K-Means on the Landsat-8 image has not been able to recognize the difference patchouli plants with other crops due to the limited resolution of imagery data and also the minimum number and variation of test data. But, visually the patchouli plant cluster is found for February data while the age of the rice crop surrounding the patchouli is still in the early phase of planting.
Keywords: patchouli plants, Landsat-8 imagery, Improved K-Means, histogram equalization
1. INTRODUCTION
One of essential crop in Indonesia which has huge potential is Lemongrass scented (Cymbopogon nardus) and patchouli (Pogostemon cablin). Both plants produce essential oils for raw materials of perfume industry, insecticides, and medical. Essential plant growth is influenced by some factors such as intensity of sunlight, the height of land above sea level, and the climate (Kardinan, 2005). In Indonesia, there have been many essential plant cultivated commercially. According to the data of Ministry of Agriculture, the land area of essential plantation crops particularly patchouli reach 29,783 hectares (Directorate General of Plantations, 2013). Based on the data of
this area extent, Indonesia was able to supply 90% of the essential needs of the world's or 1600 tons per year (Ministry of Agriculture, 2015). Therefore, the Government should keep pushing the production of essential oils remain stable or even increased. Consequently, the position of Indonesia on essential oil world market can last. To that end, the availability of raw materials in the form of essential crops needs to be monitored. To maintain the availability of essential plants are required monitoring the distribution of essential crops plantation.
P-ISSN:2356-3109 E-ISSN: 2356-3117 71 directly (Lillesand, Kiefer, & Chipman,
2008).
In previous research, multispectral satellite imagery is used to map the agricultural land of rice plant in China. Monitoring rice crops utilizes satellite imagery from Landsat 8 OLI. This research method using Spatial-Temporal Probabilistic Models (TSPM) to distinguish the image of rice farmland with the image of the other. The results of this research can provide the agricultural area of rice in China (Sun, Xie, Zhang, Zhu, Wei, & Yuan, 2014). The other research conducted by Xiaoa et al (2005) applied the method of Temporal Profile Analysis to find out the area of rice crops. This study uses MODIS satellite images from EOS Terra. The composite image used was taken during the breeding period, cropping, and after the harvest. The probability calculation is done on each region by calculating the Normalized Difference Vegetation Index (NDVI), Enhanced Vegetation Index (EVI), and Land Surface Water Index (LSWI). This study used NLCD2000 dataset to validate the results from the MODIS image. The results of calculation by using the same algorithm on these two datasets shows that on NLCD2000 generate 560,257 km square of rice fields, while on the MODIS generate 420,572 km square of rice fields (Xiao, et al., 2005).
Both these studies perform recognition of rice plant based on spectral patterns of rice plant during its growth phase. It is very possible because at each phase, rice crops have greatly different color information. At the beginning of the planting up to 2 months, the plant's color is green, then at the time of flowering will turn yellowish and finally on the phases of the harvest being Brown. Thus the NDVI could produce a quiet accurate recognition. As for the spectral pattern of patchouli plant is very different from the rice plant. The difference in the color of leaves ranging from planting until harvest time has not seen clearly if recognized using
NDVI. Thus it takes a different approach in doing the recognition. This research used Improved K-Means method to perform the identification of patchouli plant.
K-Means working with grouped data based on characteristic equation. This method is simple and has a high performance (Ayech & Ziou, 2016). But, the number of cluster must be determined before. In addition, a different initial of centre cluster may produce different cluster. To that end, some research doing various approaches to improving the performance of the k-means method (Khanmohammadi, Adibeig, & Shanehbandy, 2017; Yao, Duan, Li, & Wang, 2013).
Khanmohammadi, et al, (2017) propose a hybrid method that combines k-harmonic means and overlapping k-means algorithms (KHM-OKM) to overcome overlapping information on medical dataset and sensitivity to the initial cluster centroids. The results shows the outperforms of proposed method than the original OKM algorithm.
Yao, et al (2012) propose a new method to improve the accuracy and stability of fish image segmentation. This study combine the KK-means clustering segmentation algorithm and mathematical morphology. The results show that the algorithm can separate between the fish image and the complex backgrounds.
The improved has done in this study is automatic initialization of cluster center and the number of cluster. The determination of the initial cluster is by specifying the closeness between the data the determination the number of cluster by using the histogram equalization techniques.
2. METHOD
72 P-ISSN:2356-3109 E-ISSN: 2356-3117
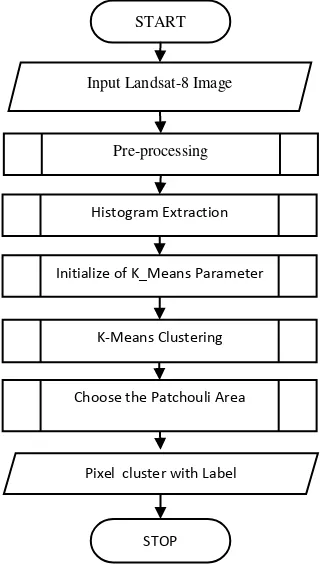
histogram equalization and the extraction of the histogram to get the number of peak histogram for initialization values of K in K-Means. After that is calculation the closeness between the data to get initial cluster value. The process continued with the clustering method using Modified K-Means. Then, choose the cluster that is identified as patchouli plants and displays the output in the form of cluster label on each pixel. The descriptions of each steps is described in the following section.
Figure 1 General flow of identification process
2.1 Histogram Equalization
Histogram equalization is a quite optimal technique of contrast sharpening. The result is depending on to the shape of the original image histogram. Histogram equalization provides more poignancy in appearance between the block object (Gonzalez & Woods, 2008). This technique has three stages, namely:
1. Calculate Probability Mass Function (PMF) of histogram formed using equation 1.
pixel total
frequency
PMF (1)
1. Calculate Cumulative Distribution Function (CDF) from PMF without doing sorting on histogram frequency by using equation 2.
pixel total
i frequency frequency
level n CDF
n i
0 ()
)
( (2)
2. Multiply CDF with the value of the second maximum pixel to obtain new histogram on image.
The new histogram will have pixels with new value, so the frequency of some pixels will increase.
The data used in this study have different qualities. Some data has almost same pixel value, so that the contrast stretching using this technique is necessary for more easily recognize the different of pixel values.
2.2 K-Means Clustering
K-Means clustering is
unsupervised learning that grouping input data without knowing the target class. The characteristics of each cluster are determined by the value of the center point (centroid) (MacQueen, 1967). Steps of K-Means algorithm is as follows:
1. Initialize the number of cluster (K) and dataset will be grouped.
2. Initialize initial centroid that can be . taken randomly from the dataset 3. Calculate the average value of each
formed cluster. This value is the average value of all record within the cluster and called centroid.
4. Entering each datum into a nearest centroid.
5. Change the centroid of each cluster by re-calculates the average of cluster. 6. Re-enter each datum into cluster as
step 4.
7. Repeat steps 5 and 6 to produce a stable centroid.
Input Landsat-8 Image START
STOP Pixel cluster with Label
Pre-processing
Initialize of K_Means Parameter
K-Means Clustering
P-ISSN:2356-3109 E-ISSN: 2356-3117 73 Centroid value obtained from the
average value of the data that is a member of a cluster. This value is calculated for each centroid feature, so that each feature on each cluster has own centroid value. Centroid value is calculated by equation 3.
Euclidean Distance to determine the distance between the centroid and data can be calculated by equation 4
Where dij is the distance benween object i
and object j, P is the data dimension, Xik is lies in the modification of determining the number of clusters and initial centroid. The number of clusters is determined by centroid. Steps for initializing the initial centroid are as follows:
1. Calculate the distance between each
used as initial centroid.
2.4 Silhouette Coefficient
Silhouette coefficient was used to assess the quality of clusters based on internal criteria. The evaluation by calculate the similarity of each cluster member in the cluster (Kogan, 2006). Steps to calculate silhouette coefficient is as follows:
1. Calculate the average value of Euclidean Distance from datum i to the other in the same cluster.
2. Calculate the average value of Euclidean Distance from datum i to the other at different cluster. Find the smallest value from all average value to set as neighbor cluster.
3. Calculate Silhouette coefficient by using equation 6. with other data on other cluster
The silhouette coefficient value is
-1 ≤ s (i) ≤ -1. The larger the value of
silhouette coefficient, the better the clustering is done.
2.5 Purity
74 P-ISSN:2356-3109 E-ISSN: 2356-3117
Where Ω = {ω1, ω2,...,ωk} is cluster set, C
= {c1, c2,…, cj} is class set, N is an amount
of data.
Purity value is ranging from 0 to 1. A clustering is said to be worse if the purity close to 0, and is said to be good if it has a value close to 1 (Deepa & Revathy, 2012).
3. DATA
This study uses two types of data, ie Landsat-8 satellite image OLI/TIRS Path/Row 118/66 and ground truth data.
The image data used are time series data acquired by satellites on every month starting from February to June 2015. The resolution of Landsat-8 is 30x30 m for each pixel. This images then are cropped of 42x41 pixels to take the area around the study area in the district of Kesamben, Blitar. A portion of this area is planted patchouli with area of 0.8 hectares. Specifications of satellite imagery used in this study are shown in Tabel 1.
Tabel 1 Specification of Landsat-8 imagery data
Date of
Acquired Time of Acquired
Cloud Coverage
(%) 2015-02-24 02:35:58.0503736Z 27.03 2015-03-28 02:35:38.8368115Z 9.62 2015-04-29 02:35:25.7222365Z 34.00 2015-05-15 02:35:10.0371358Z 16.75 2015-06-16 02:35:27.3889844Z 9.08 2015-07-18 02:35:43.8314918Z 8.83
This study uses three of the total 11 existing spectral, namely BAND 3 Visible Green, BAND 4 Visible Red and BAND 5 Near Infrared. The raw data were then processed into data that can be used by K-Means.
Ground truth data is taken in real terms in the field and used for testing the accuracy of the system. This data was obtained by field observation in the pathcouli garden in Kesamben Subdistrict, Blitar. Ground truth data is represented in
the form of images that have the same resolution as satellite imagery.
4. RESULD AND DISCUSSION
This study performs testing of internal criteria and external criteria to determine performance of Improved K-Means algorithm.
4.1 The Result of Internal Criteria Testing
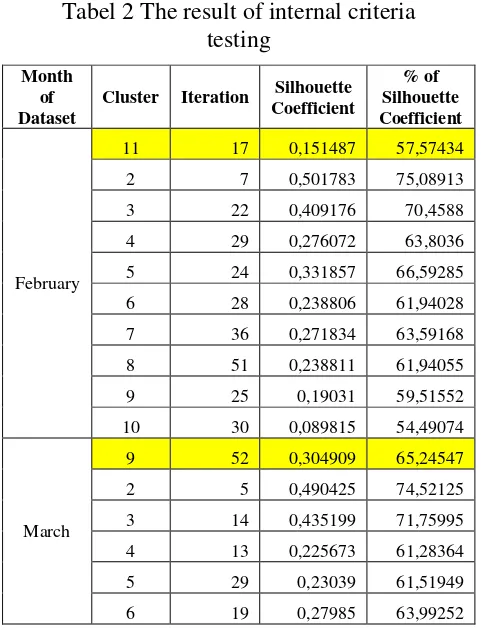
Internal criteria testing intended to determine the best number of clusters using the silhouette coefficient. This test uses six dataset image with the number of clusters is determined by the amount of image histogram (k). Besides that, it is also tested the other number of cluster to determine the effectiveness of using the histogram in the selection of the number of clusters. The number of clusters used in these tests ranging from 2 to (k-1). The test results are shown in Table 2. The result of using histogram is blocked by color and presented at the first line for each data.
Tabel 2 The result of internal criteria testing
Month of Dataset
Cluster Iteration Silhouette
Coefficient
% of Silhouette Coefficient
February
11 17 0,151487 57,57434 2 7 0,501783 75,08913 3 22 0,409176 70,4588 4 29 0,276072 63,8036 5 24 0,331857 66,59285 6 28 0,238806 61,94028 7 36 0,271834 63,59168 8 51 0,238811 61,94055 9 25 0,19031 59,51552 10 30 0,089815 54,49074
March
P-ISSN:2356-3109 E-ISSN: 2356-3117 75
Month of Dataset
Cluster Iteration Silhouette
Coefficient
% of Silhouette Coefficient
7 25 0,279438 63,97191 8 32 0,276578 63,82888
April
18 37 0,247563 62,37815 2 11 0,454482 72,72412 3 8 0,294645 64,73225 4 22 0,311183 65,55915 5 13 0,359866 67,99331 6 26 0,354707 67,73537 7 34 0,217087 60,85434 8 35 0,308593 65,42963 9 51 0,277278 63,86388 10 25 0,3274 66,37002
May
11 29 0,275796 63,78978 2 17 0,180354 59,01772 3 12 0,444787 72,23937 4 23 0,147451 57,37256 5 56 0,310375 65,51877 6 20 0,310662 65,5331 7 20 0,210869 60,54345 8 22 0,286683 64,33416 9 36 0,274681 63,73407 10 22 0,297544 64,87719
June
30 37 -0,1662 41,69012 2 6 0,430012 71,50058 3 14 0,356946 67,84729 4 20 0,342249 67,11243 5 34 0,383888 69,19441 6 22 0,249778 62,48888 7 29 0,32482 66,24098 8 7 0,294928 64,74638 9 36 0,284115 64,20574 10 49 0,249691 62,48455 11 31 0,263357 63,16787 12 46 0,26297 63,1485 13 30 0,260568 63,02841
July
5 16 -0,60609 19,6955 2 9 0,073238 53,66189 3 12 0,05185 52,59248 4 23 -0,66492 16,75379
Table 2 show the silhouette coefficient for each dataset is varies even though it is tested at the same number of clusters.
Silhouette coefficient value for dataset on July is significantly below than the other dataset. Even when using the initialization number of cluster by histogram only generate 19.6955%. The highest silhouette coefficient obtained is 75.08913%, which is tested on February dataset with the number of cluster 2.
Silhouette coefficient value changes due to differences in cluster membership generated by the K-Means clustering. The different on membership cause differences in the average distance of each pixel to another pixel.
This test only uses pixel value as parameter therefore it need further analysis to be associated with the identification of essential crops. Changes in the value of the pixel data for different months is quite large, this is due to weather conditions, solar lighting, the age of patchouli planting, the age of the rice planting, transplanting age on the other crop, and land use change.
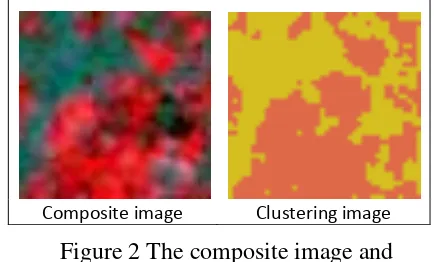
In February data and the number of cluster 2, the result of clustering has high quality due to striking color differences of the young age rice plant and the building. The composite image has a similar pattern when compared to the clustering image, especially for the visible similarities of the buildings and plants. The image of the building cluster shown by the yellow color and the rice crop is indicated by the pink color.
Composite image Clustering image
Figure 2 The composite image and clustering image on February data
76 P-ISSN:2356-3109 E-ISSN: 2356-3117
Actual data class used in this test was obtained from field observation as described in the previous section.
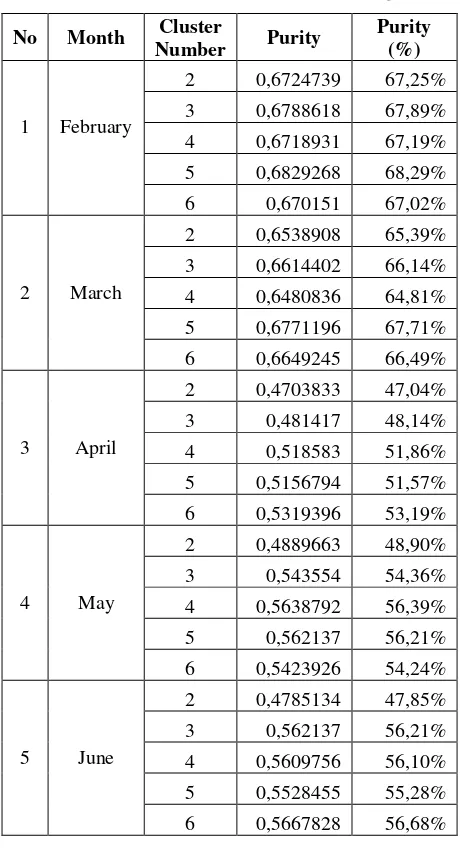
The external criteria testing uses 5 image dataset from February to June. Dataset in July is not used because it produces a low silhouette coefficient value. Each dataset was tested using 2 to 6 of clusters. The test results of purity can be seen in Tabel 3.
Tabel 3 The result of purity testing
No Month Cluster
Number Purity
Purity (%)
1 February
2 0,6724739 67,25% 3 0,6788618 67,89%
4 0,6718931 67,19% 5 0,6829268 68,29% 6 0,670151 67,02%
2 March
2 0,6538908 65,39%
3 0,6614402 66,14% 4 0,6480836 64,81% 5 0,6771196 67,71% 6 0,6649245 66,49%
3 April
2 0,4703833 47,04% 3 0,481417 48,14% 4 0,518583 51,86% 5 0,5156794 51,57%
6 0,5319396 53,19%
4 May
2 0,4889663 48,90% 3 0,543554 54,36% 4 0,5638792 56,39%
5 0,562137 56,21% 6 0,5423926 54,24%
5 June
2 0,4785134 47,85% 3 0,562137 56,21%
4 0,5609756 56,10% 5 0,5528455 55,28% 6 0,5667828 56,68%
Based on Tabel 3 is known that the highest purity is 0.6829268 at the February dataset with cluster number 5. The lowest one is occurred in April dataset with the number of cluster 2 which produces purity value 0.4703833.
Purity value for February and March datasets is above 0.6 because the age of the rice planting is still young as described above on internal analysis criteria. Here, the rice plant is dominates because it has very large area. The dominance of the rice plant led to a class dominated in almost the entire cluster. Therefore the purity test does not find cluster is dominated by a class of patchouli plant. Patchouli is quite difficult to recognize because it has a similar color to rice plants. However, when observed visually more closely it will be found a few clusters of patchouli.
On April to June, the patchouli and rice plants are growing older. At this age, visually the color of patchouli plant increasingly red and rice plant growing yellow. Different visual changes that occur for these two plantations are apparently not capable captured by the satellite sensors in visible green composite BAND, visible red BAND and near infrared BAND. The difference between the pixel value of the plants are still thin so that the recognition by the improved K-Means method is still bad and produce lower purity value, which is below 0.6. This is mainly due to patchouli crop area is very small and its position adjacent to the quite spacious area of rice crop.
5. CONCLUSION
Based on the results of testing that was done, we conclude that initialization
P-ISSN:2356-3109 E-ISSN: 2356-3117 77 limited number of test data and the limited
resolution of Landsat-8 image. However, the few clusters of patchouli can be identified while observed on February data.
REFERENCE
AYECH, M. W., & ZIOU, D. (2016). Terahertz image segmentation using k-means clustering based on weighted feature learning and
random pixel sampling.
Neurocomputing, Volume 175, Part A, 243–264.
DANOEDORO, P. (2012). Pengantar Peninderaan Jauh Digital. Yogyakarta: Andi.
DEEPA, M., & REVATHY, P. (2012). Validation of Document Clustering based on Purity and Entropy Measures. International Journal of Advanced Research in Computer and Communication Engineering Vol. 1, Issue 3, 147-152.
DIRECTORATE GENERAL OF
PLANTATIONS, MINISTRY OF AGRICULTURE.(2013). Luas Areal Perkebunan Angka Estimasi Tahun 2013. Accessed March 24,
2015, from http://
ditjenbun.pertanian.go.id/statis-35-luasareal.html
GONZALEZ, R. C., & WOODS, R. E. (2008). Digital Image Processing 3rd Edition. New Jersey, USA: Pearson Prentice Hall.
KARDINAN, A. (2005). Tanaman Penghasil Minyak Atsiri. AgroMedia.
KHANMOHAMMADI, S., ADIBEIG, N., & SHANEHBANDY, S. (2017). An Improved overlapping k-means clustering method for Medical applications. Expert Systems With Applications, Vol. 67, 12-18.
KOGAN, J. (2006). Introduction to Clustering Large and High-Dimensional Data 1st Edition. Cambridge University Press. LILLESAND, T. M., KIEFER, R. W., &
CHIPMAN, J. (2008). Remote Sensing and Image Interpretation 6th Edition. USA: John Wiley & Sons.
MACQUEEN, J. (1967). Some Methods for classification and Analysis of Multivariate Observations. 5-th
Berkeley Symposium on
Mathematical Statistics and Probability (hal. 281-297). Berkeley: University of California Press.
MINISTRY OF AGRICULTURE. 2015. Bahan Baku Dunia, Tapi RI Masih Impor Parfum. Acessed March 24,
2015, from
http://www.kemenperin.go.id/artik el/1921/Pemasok-90-Bahan-Baku- Dunia,-Tapi-RI-Masih-Impor-Parfum
SUN, P., XIE, D., ZHANG, J., ZHU, X., WEI, F., & YUAN, Z. (2014). Tempora-Spatial-Probabilistic Model Based For Mapping Paddy Rice Using Multi-Temporal Landsat Images. Geoscience and Remote Sensing Symposium (IGARSS). IEEE International. XIAO, X., BOLES, S., LIU, J., ZHUANG,
D., FROLKING, S., LI, C.. (2005). Mapping paddy rice agriculture in southern China using multi-temporal MODIS images. Remote Sensing of Environment, Volume 95, Issue 4, 480–492.