________________________________
IDENTIFYING WOODY VEGETATION ON COAL SURFACE MINES USING
PHENOLOGICAL INDICATORS WITH MULTITEMPORAL LANDSAT IMAGERY
A. J. Oliphant a *, J. Li b, R. H. Wynne c, P. F. Donovan d, C. E. Zipper e
a Dept. of Forest Resources and Environmental Conservation, Virginia Polytechnic Institute and State University, Blacksburg, Virginia 24061, USA. [email protected]
b China University of Mining & Technology, Beijing, China. Currently at: Dept. of Crop and Soil and Environmental Sciences, Smyth Hall, Virginia Polytechnic Institute and State University, Blacksburg, Virginia, 24061, USA - [email protected] c Dept. of Forest Resources and Environmental Conservation, Virginia Polytechnic Institute and State University, Blacksburg,
Virginia 24061. USA. 540-231-7811. [email protected]
d Dept. of Crop and Soil and Environmental Sciences, Smyth Hall, Virginia Polytechnic Institute and State University, Blacksburg, Virginia, 24061, USA, 540-231-9795. - [email protected]
e Dept. of Crop and Soil and Environmental Sciences, Smyth Hall, Virginia Polytechnic Institute and State University, Blacksburg, Virginia, 24061, USA 540-231-9782, [email protected]
Commission VI, WG VI/4
KEY WORDS: Afforestation, Ecosystem Recovery, Elaeagnus umbellata, Landsat, Land Cover Change, Mine Reclamation, Exotic Plants
ABSTRACT:
Surface mining for coal has disturbed large land areas in the Appalachian Mountains. Better information on mined lands’ ecosystem recovery status is necessary for effective environmental management in mining-impacted regions. Because record quality varies between state mining agencies and much mining occurred prior to widespread use of geospatial technologies, accurate maps of mining extents, durations, and land cover effects are often not available. Landsat data are well suited to mapping and characterizing land cover and forest recovery on former coal surface mines. Past mine reclamation techniques have often failed to restore pre-mining forest vegetation but natural processes may enable native forests to re-establish on mined areas with time. However, the invasive species autumn olive (Elaeagnus umbellate) is proliferating widely on former coal surface mines, often inhibiting re-establishment of native forests. Autumn olive outcompetes native vegetation because it fixes atmospheric nitrogen and benefits from a longer growing season than native deciduous trees. This longer growing season, along with Landsat 8's high signal to noise ratio, has enabled species-level classification of autumn olive using multitemporal Landsat 8 data at accuracy levels usually only obtainable using higher spatial or spectral resolution sensors. We have used classification and regression tree (CART®) and support vector machine (SVM) to classify five counties in the coal mining region of Virginia for presence and absence of autumn olive. The best model found was a CART® model with 36 nodes which had an overall accuracy of 84% and kappa of 0.68. Autumn olive had conditional kappa of 0.65 and a producers and users accuracy of 86% and 83% respectively. The best SVM model used a second order polynomial kernel and had an overall accuracy of 77%, an overall kappa of 0.54 and a producers and users accuracy of 60% and 90% respectively.
1. INTRODUCTION
Former surface coalmines cover an estimated 1.5 million acres of land in Appalachia (Zipper et al., 2011). After the Surface Mining and Control Reclamation Act (SMCRA) was enacted in 1978, coal companies are required to reclaim land that has been mined. Historically, surface coal mines were reclaimed by moving large amounts of overburden to approximate pre-mining topography and were heavily compacted to reduce erosion and give the land a smooth manicured look. A thin layer of topsoil and fertilizer was added to serve as a growing medium for quick growing grasses and shrubs. This reclamation method produced a poor growing medium for native hardwood trees that require much deeper soils over weathered parent materials. Over the past 10 years native hardwood forests have become the preferred land cover for reclamation. However, huge tracks of land which were reclaimed after passage of SMCRA using earlier reclamation practices are frozen in ecological succession and are called legacy mine sites (Burger et al., 2013). Research is being conducted on methods that can be used to convert legacy mines into native hardwood forest (Evans et al., 2013; Fields-Johnson et al., 2014)
One factor that significantly influences the cost and success of reforestation on legacy mine sites is the invasive species
Elaeagnus umbellata, commonly known as autumn olive, autumn berry, or Japanese silverberry. It is a deciduous shrub native to Japan and Northeastern Asia which can grow up to 5 m tall and 6 m wide but is often smaller (Black et al., 2005). Autumn olive was widely planted on mine sites from the 1980s and 1990s to provide food for wildlife (Zarger, 1980). In disturbed areas with full sun, it tends to outcompete native plant species. It fixes nitrogen from the atmosphere, enabling it to grow rapidly in nutrient-poor soils such as those that are common on former mine sites (Johnson et al., 1997). It propagates by root shoots and edible red berries that ripen from August to October (Black et al., 2005). Once the plant has established, pesticide application or repeated mechanical removal is required for eradication because it will resprout from cut stumps and root fragments. If left entirely unmanaged, autumn olive will overtake grasses, converting pastures to “shrub land” in about a decade (personal observation). This species’ vigour and tenacity make it a significant obstacle in establishing hardwood forest on legacy mine sites, and assessment of its growth and spatial distribution is warranted (Lemke et al., 2013).
Reforestation of a Wise County, Virginia, legacy mine was compromised by failure to control autumn olive effectively (Evans et al., 2013). Autumn olive was present on the parts of the mine site prior to reforestation. Autumn olive plants were cut prior to soil ripping, but the plant and its roots were not killed with herbicide as recommended by Burger et al. (2013) due to concern for expense. After soil ripping and tree planting, autumn olive grew rapidly from the living roots that remained in the soil. Four years later, some parts of the site were dominated by the autumn olive which had overtopped the planted tree seedlings.
Prior research has shown that autumn olive should be either absent or controlled to maximize the likelihood that reforestation will be successful (Patrick Angel, US Office of Surface Mining; personal communication). The non-native autumn olive is considered as an undesirable plant species throughout the Appalachian coalfield; hence, its removal from a mine site can add to the “ecological lift” to be achieved through successful reforestation of the mine site. Thus, locating where autumn olive is and is not present is a prerequisite for evaluating the economic feasibility of reforestation. However, given that the majority of former mine land is privately owned, gaining permission to investigate areas on the ground can be difficult and expensive. Fortunately, remote sensing technology has the potential to identify areas of autumn olive dominance without requiring physical access to the legacy mines being investigated.
Species-level classification of vegetation using multispectral imagery with accuracies higher than 80% is usually only achievable with high spatial resolution multispectral, hyperspectral, or LiDAR imagery, although exceptions do exist. Given that freely available LiDAR or hyperspectral imagery does not currently exist for the active coal mining region of Virginia, Landsat imagery has served as the primary spatial data source for this project. Individual invasive species have been mapped with greater than 81% accuracy using Landsat data in other instances where species occur in clumps greater than 0.5 ha and the invasive species has a distinctive spectral signature (Bradley and Mustard, 2006; Peterson, 2005). For instance, the invasive species glossy privet, Ligustrum lucidum, was successfully identified using Landsat imagery in Argentina because glossy privet is an evergreen species while the native forests are deciduous, which results in glossy privet having a much higher NDVI in the winter months (Gavier-Pizarro et al. 2012, Hoyos et al. 2010).
Unfortunately, autumn olive and a majority of the native tree species in the coal mining region of Virginia are deciduous which makes distinguishing autumn olive more difficult. However, local forestry experts and our investigations indicate that autumn olive produces leaves about two weeks before native trees and other bushes. Our investigations also reveal that autumn olive’s spectral hue differs from that of most native deciduous species early in the leaf-on season. When proliferating on mine sites, it produces a distinctive visual pattern when viewed from the air due to its somewhat circular form which makes it identifiable on National Agriculture Imagery Program (NAIP) aerial photographs. Initial results indicate that a subtle phenology signal is sufficient to identify autumn olive using Landsat 8 imagery, provided that cloud-free imagery is available at key times. The objective of this study is to develop methods for interpreting Landsat imagery that can be applied to identify where autumn olive is a major vegetative Virginia, namely Buchannan, Dickenson, Russell, Tazewell, and Wise, see figure 1. Extensive surface mining history has been traced back to 1960s (Sen et al., 2012). The National Land Cover Database (NLCD) 2011, indicates that grassland land, cultivated land, developed, and water are major land cover classes for the area. Forest is still the dominant land cover type, which accounts for about 75% of the total area.
Figure 1. Map of study area. 2.2 Available Imagery
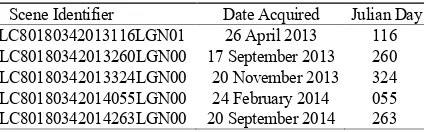
The majority of coal mining in Virginia is within Landsat scene path 18 row 34 which also covers major coal producing counties in West Virginia and Kentucky, see figure 1. Five nearly cloud-free Landsat 8 scenes acquired on 4/26/2013, 9/17/2013, 11/20/2013, 2/24/2014, and 9/20/2014 were downloaded from USGS Earth Explorer, see table 1. For ease of reference, the Landsat scenes will be referred to by their date of acquisition in Julian Day, see table 1. The 2011 National Land Cover Database (NLCD) National Land Cover Layer was downloaded from USDA Data Gateway along with NAIP aerial photographs (NRCS 2013, Jin et al., 2013).
Table 1. Landsat 8 imagery used in study
Scene Identifier Date Acquired Julian Day LC80180342013116LGN01 26 April 2013 116 LC80180342013260LGN00 17 September 2013 260 LC80180342013324LGN00 20 November 2013 324 LC80180342014055LGN00 24 February 2014 055 LC80180342014263LGN00 20 September 2014 263 2.3 Reference data
Training and validation data were obtained to aid model development. Due to the difficulty in accessing legacy sites on the ground, gathering required training data from ground surveys was not feasible. Training data were acquired by manually classifying high resolution imagery from NAIP for the years 2003 through 2014. Primary classifications were based on the 2012 images, while historic images were used as supplementary information when needed for accurate classification of the 2012 image. The 2014 NAIP imagery was released after collection of reference data was completed.
Fortunately, random comparisons indicated that land cover was very similar between the two dates.
Visual interpretation of NAIP aerial imagery was used to classify Landsat pixels as containing or not containing autumn olive. No mis-coregistration between the NAIP and Landsat 8 scenes were observed. Pixels were classified as containing autumn olive if the species could be identified in the NAIP imagery as the dominant plant species, or as a co-dominant plant species when growing with herbaceous vegetation. During classification of training data, it was observed that many of the Landsat 8 pixels contained both autumn olive and forest or other land class types. Since it is problematic to use non-homogenous pixels for model training, such pixels were omitted from model development. To generate an adequate number of random homogenous pixels, a maplet based heads up classification was performed (Scrivani et al., 2001).
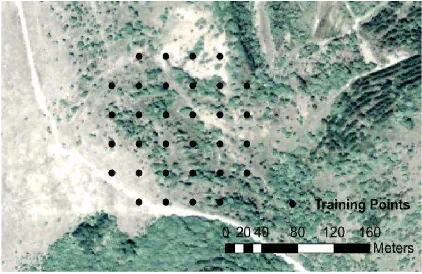
Maplets are small subsections of a larger map used to collect training data. 400 maplets were randomly generated within shapefile designating current and past coal mining permits provided by the Virginia Department of Mines, Minerals, and Energy. These clusters of pixels allowed the analyst to efficiently classify homogenous pixels. Figure 2 shows one maplet containing Landsat 8 pixel points overlaid autumn olive shown on the 2014 NAIP of Wise County. Each homogenous pixel within the 400 maplets were classified.
Figure 2. An example of a maplet which shows relative size of training points to autumn olive
Six land cover types were used: autumn olive (dominant or co-dominant); agriculture or grass; forest; developed; surface mines; and water. Other than autumn olive, these classes were easily identified visually using aerial imagery. By observing NAIP images where autumn olive was known to be present it was found that autumn olive have the following characteristics (1) light green/gray/blue vegetation growing in or near a clearing/field, (2) apparent growth over 5 to 10 years, and (3) exhibits circular popcorn texture. Often sparse autumn olive bushes surround dense mature bushes. It was found that bands 3, 4, 5, and 6 from the April 2013 Landsat 8 scenes were effective in identifying autumn olive. With practice the analysis could consistently identify autumn olive with confidence. Table 2 shows the relative abundance of the 6 land cover types used for this classification.
Table 2. Numbers of training data points by classified category
Class Count % of Total
Agriculture or Grass 366 9.59
Autumn Olive 553 14.49
Forest 2052 53.76
Developed 266 6.97
Mine 480 12.57
Water 100 2.62
Total 3817 100.00
2.3 Data Pre-processing
The Semi-Automatic Classification Plugin inside QGSIS 2.4.0 was used to convert Landsat 8 images from digital numbers to top of atmosphere reflectance (TOA) (Congedo, 2014) using equations 1 and 2. To further enhance images, a dark object subtraction was also performed following the procedure outlined in Congedo and Macchi (2013).
Images were converted from digital numbers to top-of-atmosphere (TOA) reflectance:
ρλ' = M
ρQcal + Aρ (1) where
ρλ' = TOA planetary reflectance, without correction for sun angle.
Mρ = band-specific multiplicative rescaling factor from the MTL metadata file.
Aρ = band-specific additive rescaling factor from the MTL metadata file.
Qcal = quantized and calibrated standard product pixel values (DN)
TOA reflectance was calculated as follows:
ρλ = ( ) (2) where
ρλ = TOA planetary reflectance
θSE = local sun elevation angle in degrees, provided in the metadata.
After TOA reflectance and dark object subtraction were performed, tasselled cap bands brightness, greenness, wetness, 4, 5, and 6 were calculated using coefficients from Baig et. al. (2014). Tasselled cap was introduced as a model input because it has been successfully used in many land classification products including the 2011 NLCD (Crist and Cicone 1984, Jin et. al. 2013).
2.4 Modelling Process
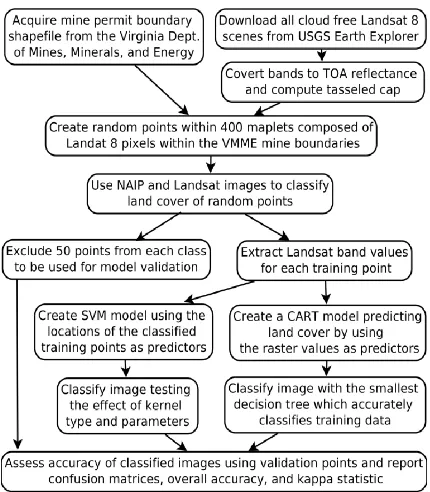
The autumn olive classification models were developed using classification and regression tree (CART®) and support vector machine (SVM). Figure 3 shows the process behind data pre-processing, reference data collection, model development, and accuracy assessment. Implementation of CART® requires a significant amount of training data randomly distributed across the study area (Lawrence, Wright, 2001). By choosing to collect training data using randomly distributed maplets rather than simple randomly distributed samples increased the sample number and decreased analyst time.
Figure 3. Flow diagram outlining the input data and processing steps used to generate models for presence or absence of autumn olive for the study area.
2.4.1 CART®
Salford Predictive Modeler® Builder v6.6 was used to create a series of CART® classification trees from the training data. The raster values from Landsat 8 bands 1-7 and tasselled cap bands 1-6 from the 5 scenes listed previously for the training points were used as model predictors. In addition, the 2011 NLCD National Land Cover Layer was reclassified as ‘forest’ and ‘not forest’ and was included as a model predictor. The optimum tree selected by Salford was evaluated by the analyst. If the tree had an excessive amount of nodes, an indicator of model over-fit; or a smaller tree had a similar estimated accuracy, the smaller tree was used for classification. Otherwise the larger tree was used and classified maps were computed.
2.4.2 Support Vector Machine
Support Vector Machines separate classes with a decision surface that maximizes the boundary between classes (Huang et. al. 2002). The surface between the classes is referred to as the optimum hyperplane and the training points, called training vectors in this context, that are nearest the hyperplane are support vectors. The optimum hyperplane can follow the curved surface between classes; it is not bound to the Cartesian coorante system imposed by the bands like many other classification techniques, such as CART®. This allows SVM to classify some datasets which are not well modeled by other classification techniques.
Analysis of feature spaces such as the one on figure 4 showed that the boundary between autumn olive and the other classes is not orthogonal to any 2 band combination which supports the use of SVM.
Figure 4. An example of separation between autumn olive (black) and other land classes (yellow) in a 3 dimensional space, composed of the near-IR band over different dates.
2.3 Accuracy Assessment
Before executing each model, an equal number of reference points per class were removed from the training data set to serve as validation points so an independent validation could be performed, see figure 3. Congalton and Green (2009) recommend using no fewer than 50 validation points. Only 50 validation points were used because only 100 water reference pixels were classified since surface water is uncommon on legacy mines.
Accuracy of the resulting maps was assessed from the confusion matrixes that are shown below. The kappa score (κ) is a measure of accuracy that accounts for the likelihood of pixels being classified correctly based on random chance and is given in the equation (3), (4) and (5). (Chrisman 1980).
̂ = – (3)
where
= ∑ (4)
= ∑ (5) where
i = class of interest
n = number of classes
N =total number of observations
xii= number correctly classified for i
xTii = row total for i
xTij = column total for i
The conditional kappa ( ) is a measure of kappa for a particular class (Stehman 1997, Janssen and van der Wel 1994), see equation (6).
= (6) where
i = class of interest
N =number of samples for i
xii= number correctly classified for i
xTii = row total for i
xTij = column total for i
3. RESULTS AND DISCUSSION 3.1 Overall CART® Model Assessment
A CART® model was chosen as an introductory classification method because CART® can exploit the physical significance of each Landsat band along with additional data sources. Originally it was believed that incorporating slope, aspect, and elevation would help distinguish land classes. However, when topography was incorporated into the CART® model, accuracy significantly decreased. This is most likely due to poor co-registration between Landsat 8 and the DEM used or that the available DEM did not account for post mining topographic changes which can be extreme on surface coal mines. 3.2 Overall SVM Model Assessment
In classification scenarios when one class highly outnumbers a smaller class a SVM technique may have trouble separating the classes because the variability between instances of the larger class my be greater than the variability between the large class and small class (Huang et.al. 2002). One strategy to separate such classes would be to reduce the number of training vectors from the larger class to equal the training vector from the smaller class which removes much of the bias in separating the classes (Huang et. al.). Following this strategy for the SVM classifications, the not autumn olive training points were randomly reduced to equal the number of autumn olive training points. The results from these assessments were in progress at time of writing. Also, classified maps created by SVM kernels seemed to agree closely with aerial imagery by visual comparisons. A hybrid approach of SVM and object oriented analysis similar to the one suggested by Salah could possibly improve classification accuracy (2014).
3.3 Binary Autumn Olive Presence Models
To ensure maximum classification accuracy of autumn olive, a binary autumn olive presence-absence model was implemented. A series of CART® and models were created and their resulting accuracies determined by validation points and statistics created by Salford Predictive Modeler® were compared. Binary autumn olive models were also implemented within the SVM package within ENVI 4.4®. The resulting accuracies determined by validation points for the linear, radial, polynomial, and sigmoid kernels were compared. A CART® model had the highest overall classification accuracy for autumn olive, see table 4.
Table 4. Overall accuracy and kappa statistics for the binary autumn olive classification from CART and SVM.
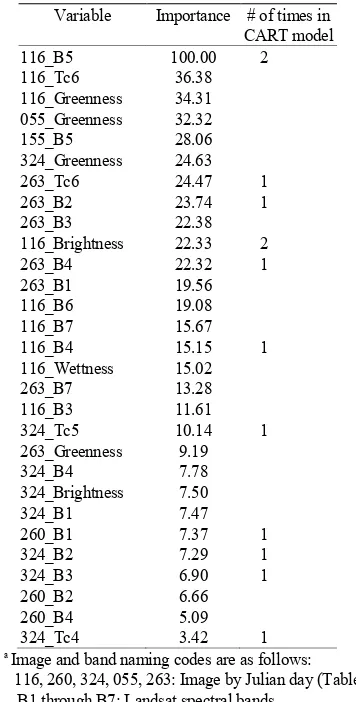
Linear Radial Polynomial Sigmoid CART Overall % presence absence model is shown on table 5. Listed on the left is the Julian Date of the scene followed by the band number. On the right is the number of nodes the variable occurred in the
a Image and band naming codes are as follows:
116, 260, 324, 055, 263: Image by Julian day (Table 1) B1 through B7: Landsat spectral bands
TC: Tasselled Cap
Several combinations of Landsat 8 bands were chosen from different scenes as input data for the SVM binary classification. The bands were chosen from the leading variable of importance tables generated by CART®. For all 4 kernel types the best accuracies were achieved utilizing all bands discussed previously: Landsat 8 bands 1-7 for the 5 scenes and tasselled cap bands 1-6 for the 5 scenes.
The autumn olive was higher for the liner kernel than the polynomial kernel, see table 4. That was an artefact of a particularly accurate classification of the non-autumn olive pixels (49 right 1 wrong) rather than an assessment of the accuracy of autumn olive classification. Table 6 and 7 show the confusion matrices for the most accurate SVM and CART® classified maps respectively.
Table 6. Confusion matrix for the best binary SVM autumn olive classified map which had a polynomial kernel.
AO Not AO Total
AO 30 3 33
Not AO 20 47 67
Total 50 50 100
Table 7. Confusion matrix of the best binary CART® autumn olive classified map.
AO Not AO Total
AO 43 9 52
Not AO 7 41 48
Total 50 50 100
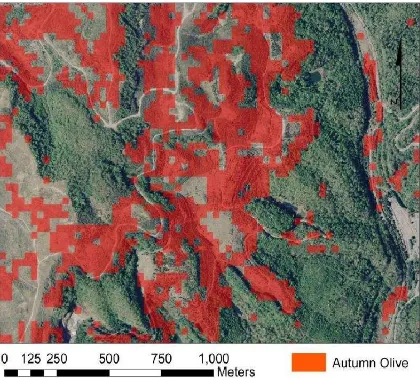
Although not perfect, the binary autumn olive classified image aligns well with existing autumn olive as shown in figure 5. As the maps support, the CART® model largely because it classifies more of the image as autumn olive. The linear SVM model appears to be more conservative; as a result it misses much of the autumn olive found in the landscape as shown in figure 6.
Figure 5. Classified areas of autumn olive in red are in good agreement with autumn olive on the landscape in the binary CART model.
Figure 6. Classified areas of autumn olive in red are in fair agreement with autumn olive on the landscape in the linear SVM model.
4. CONCLUSIONS
This is an exploratory study to map the coverage of autumn olive over legacy mine sites in Virginia. To the author’s best knowledge, no study has mapped autumn olive in Appalachia over a several county area primarily using Landsat imagery. Models were created from training data acquired by a heads-up classification of NAIP imagery. 50 pixels per class were retained so independent accuracy assessments could be performed. To increase accuracy, classes were merged to became autumn olive and not autumn olive. A CART® model was created which had higher classification accuracies for autumn olive than did any of the SVM models with different kernel types. The accuracies and resulting classified map obtained with the CART® were lower than were desired. We believed that additional training and validation points will increase these to some extent.
A key assumption to this work is that autumn olive was correctly classified for the training data set. In areas known to contain autumn olive spectral and textural characteristics were found which distinguished autumn olive from other types of vegetation. In the coal mining area of Virginia, autumn olive is the major bush cover. In areas where this is not the case it may not be appropriate to assess autumn olive coverage with Landsat imagery. Future field validation will test this assumption. Autumn olive is not only a problem on legacy mines in Virginia, it is widespread across the United States and Canada. Unlike hyperspectral and high spatial resolution data, Landsat imagery is regularly acquired over the entire U.S. and, at time of writing is provided free of charge. With these two factors it is reasonable that autumn olive could be mapped in other areas in the United States following similar techniques an employed here.
ACKNOWLEDGEMENTS
Funding provided by Virginia Department of Forestry. Software and computers provided by the Center for Environmental Applications of Remote Sensing at Virginia Tech
Buck Kline at the Virginia Department of Forestry for his continued support
Richard Davis at the Virginia Department of Mines, Minerals, and Energy for providing coal mine permits and locations of many fields of autumn olive in Wise County
REFERENCES
Baig, M.H. A., Zhang, L., Shuai, T., and Tong, Q. 2014. Derivation of a tasselled cap transformation based on Landsat 8 at-satellite reflectance. Remote Sensing Letters, 5(5), pp. 423-431.
Black, B.L., Fordham, I.M., and Perkins-Veazie, P. 2005. Autumnberry (Elaeagnus umbellata): A Potential Cash Crop.
Journal of the American Pomological Society, 59, pp. 125-134. Bradley, B.A., and Mustard, J.F. 2006. Characterizing the Landscape Dynamics of an Invasive Plant and Risk of Invasion Using Remote Sensing. Ecological Applications, 16, pp. 1132-1147.
Burger J., C.E. Zipper, P. Angel, N. Hall, J. Skousen, C. Barton, S. Eggerud. 2013. Establishing native trees on legacy surface mines. Appalachian Regional Reforestation Initiative Advisory No. 11. US Office of Surface Mining.
Chrisman, N.R. 1980. Assessing Landsat Accuracy: A Geographic Application of Misclassification Analysis. In Second Colloquium on Quantitative and Theoretical Geography. Cambridge, UK.
Congalton, R.G., and K. Green. 2009. Assessing the Accuracy of Remotely Sensed Data: Principles and Practices (2nd ed.). Boca Raton, FL, CRC Press.
Congedo, L. 2014. Land Cover Classification of Cropland: a Tutorial Using the Semi-Automatic Classification Plugin for QGIS, Directions Magazine, http://www.directionsmag.com/ articles/land-cover-classification-of-cropland-a-tutorial-using-the-semi-automa/376137, 17 March 2014.
Congedo, L., and Macchi, S. 2013. Investigating the relationship between land cover and vulnerability to climate change in the Dar es Salaam. http://www. planning4adaptation. eu/Docs/events/WorkShopII/WorkingPaper_Activity2_1_compl ete.pdf (accessed 21. August. 2014).
Crist, E.P., and Cicone, R.C. 1984. A physically-based transformation of Thematic Mapper data---The TM Tasseled Cap. IEEE Transactions onGeoscience and Remote Sensing, 3, pp. 256-263.
Evans, D.M., Zipper, C.E., Burger, J.A., Strahm, B.D., and Villamagna, A.M. 2013. Reforestation practice for enhancement of ecosystem services on a compacted surface mine: Path
toward ecosystem recovery. Ecological Engineering, 51, pp.
16-23.
Fields-Johnson C.W., Burger J.A., Evans D.M., Zipper C.E.. 2014. Ripping improves tree survival and growth on unused
reclaimed mined lands. Environmental Management, 53, pp.
1059-1065.
Foody, G.M. 2009. Sample size determination for image classification accuracy assessment and comparison.
International Journal of Remote Sensing, 30, pp. 5273–5291. Gavier-Pizarro, G.I., Kuemmerle, T., Hoyos, L.E., Stewart, S.I., Huebner, C.D., Keuler, N.S., and Radeloff, V.C. 2012. Monitoring the invasion of an exotic tree (Ligustrum lucidum) from 1983 to 2006 with Landsat TM/ETM+; satellite data and Support Vector Machines in Córdoba, Argentina. Remote Sensing of Environment, 122, pp. 134-145.
Hopkinson, C., and Chasmer, L. 2009. Testing LiDAR models of fractional cover across multiple forest ecozones. Remote Sensing of Environment, 113, pp. 275-288.
Hoyos, L., Gavier-Pizarro, G., Kuemmerle, T., Bucher, E., Radeloff, V., and Tecco, P. 2010. Invasion of glossy privet (Ligustrum lucidum) and native forest loss in the Sierras Chicas of Córdoba, Argentina. Biological Invasions, 12, pp. 3261-3275.
Huang, C., Davis, L.S., & Townshend, J.R. G. 2002. An assessment of support vector machines for land cover classification. International Journal of Remote Sensing, 23(4), pp. 725-749.
Janssen, L. L. F., and van der Wel, F. J. M. 1994. Accuracy assessment of satellite derived land-cover data: a review.
Photogrammetric Engineering and Remote Sensing, 60, pp. 419-426.
Jin, S., Yang, L., Danielson, P., Homer, C., Fry, J., and Xian, G. 2013. A comprehensive change detection method for updating the National Land Cover Database to circa 2011. Remote Sensing of Environment, 132, pp. 159 – 175.
Johnson, G., Schwintzer, C., and Tjepkema, J. 1997. The acetylene-induced decline in nitrogenase activity in root nodules of Elaeagnus angustifolia. Plant and Soil, 191, pp. 157-161. Lemke D., Schweitzer C.J., Tadesse W., Wang Y. and Brown J.A. 2013. Geospatial assessment of invasive plants on reclaimed mines in Alabama. Invasive Plant Science and Management, 6, pp. 401-410.
Peterson, E.B. 2005. Estimating cover of an invasive grass (Bromus tectorum) using tobit regression and phenology derived from two dates of Landsat ETM+ data. International Journal of Remote Sensing, 26, pp. 2491-2507.
Salah, M. 2014. Combining Pixel-based and Object-oriented Support Vector Machines Bayesian Probability Theory. ISPRS Annals of the Photogrammetry, Remote Sensing and Spatial Information Sciences, Volume II-7
Scrivani, J.A., Wynne, R.H., Blinn, C.E., and Musy, R.F. 2001. Phase I forest area estimation using Landsat TM and iterative guided spectral class rejection: Assessment of possible training data protocols. In: Reams, G.A.; McRoberts, R.E.; Van Deusen, P.C., eds. 2001. Proceedings of the second annual Forest Inventory and Analysis symposium; 2000 October 17-18; Salt Lake City, UT. Gen. Tech. Rep. SRS-47. Asheville, NC: U.S. Department of Agriculture, Forest Service, Southern Research Station. pp. 11-14
Sen S, Zipper C.E., Wynne R.H., Donovan P. F., 2012. Identifying Revegetated Mines as Disturbance/Recovery Trajectories Using and Interannual Landsat Chronosequence.
Photogrammetric Engineering & Remote Sensing, 62(3), pp. 223-235.
Stehman, S.V. 1997. Selecting and interpreting measures of thematic classification accuracy. Remote Sensing of Environment, 62(1), pp. 77-89.
Zarger, T.G. 1980. Forestation of surface mines for wildlife.
General Technical Report, Northeastern Forest Experiment Station, USDA Forest Service NE-61 pp. 71-74.
Zipper C.E., Burger J.A., Skousen J.G., Angel P.N., Barton C.D., Davis V., Franklin J.A.. 2011. Restoring forests and associated ecosystem services on Appalachian coal surface mines. Environmental Management, 47, pp. 751–765.