DOI: 10.12928/TELKOMNIKA.v15i1.3460 336
Received July 1, 2016; Revised August 4, 2016; Accepted September 6, 2016
Multiple Regression to Analyse Social Graph of Brand
Awareness
Yahya Peranginangin*, Andry Alamsyah Universitas Telkom, Jl. Telekomunikasi No. 1 Bandung
*Corresponding author, e-mail: [email protected]
Abstract
Social Network Analysis (SNA) has become a common tool to conduct social and business research. SNA can be used to measure how well a marketing campaign affect conversation in social media. A good marketing campaign is expected to stimulate conversation between users in social media. In this paper we use SNA metrics to understand the nature of network of top brand awareness products. We analyses networks structure of social media conversation regarding cellular service provider and smartphone brand in Indonesia that achieve top brand awareness in 2015. We use conversational datasets acquired from Twitter. To get more understanding we also compare the result with network structure of knowledge dissemination. We use multiple regression algorithm, a machine learning algorithm that is extension of linear regression, to analyses network properties to get insight on the correlation of the network structure and brand awareness' rank of a product. The result suggests how we should define network properties in brand awareness context.
Keywords: machine learning, brand awareness, social network analysis, regression
Copyright © 2017 Universitas Ahmad Dahlan. All rights reserved.
1. Introduction
The use of Social Network Analysis (SNA) has become common in analyzing problem in marketing. Digitally recorded data stored in the Internet made it possible for researcher to map user activities in whole, instead of partly (as we find in sampling method). Moreover, the advancing of computational technology enables researcher to analyses large amount of data acquired from Internet. Many researchers have successfully showed the usage social media as valuable data resource. When combined with data mining technology, it can give researchers valuable insights in a significantly reduced time [1-3].
It is arguable that the most acknowledged method at the moment in studying social behavior is through survey using questionnaires or interviews. There are many efforts to redefine social metrics in order to adopt big data (data mining) method in social studies, but there is almost none generic metric that can be used to measure general problem. The complexity of real network, the area that big data is trying to resolve, has different nature than the research that using sampling method. While sampling method try to analyses pre-defined problem, data mining is aimed to draw patterns or relationship in data [4]. Even though data mining tools is heavily based on statistics formula, but there is no specific procedure to find patterns in data, as we used to find in statistical tools.
Social Network Analysis (SNA) is a method used to analyses graph in order to get pattern and insight from it. SNA has been used in social studies since 1930s. In the earlier usage, SNA studies use interviews with every person and observation to get information about relationship between people and the quality of the relationship. To avoid complexity because of the number of data, SNA study usually conduct in a limited community, such as friendship at a school, conversation at a karate club, etc. Current computing technology has enable researcher to process large set of network data as never been done before. Thousands or even hundreds of thousands of node and edge can be processed by using parallel computing. But when the network size is too large, analyzing graph using visualization tool often considered to be ineffective. Hence we need SNA metrics to describe structure of a network.
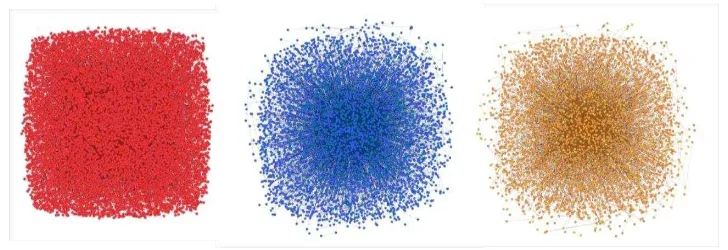
Figure 1.Network Graph of Telkomsel (left), XL (centre), and Indosat (right) with Size of Network more than 3000 Nodes
In this paper we use SNA metric to measure network structure of social media conversations for each cellular service provider and smartphone brand that are considered as Indonesia top brand by Frontier Consulting Group. Network for each brand is formed by using conversational data crawled from Twitter (the data is acquired from August to October 2015). We use multiple regressions to analyze correlations between network structures and brand awareness score. We also compare the result with network structure of knowledge dissemination. The result of this paper is to show the network behavior of top brand awareness in smartphone and cellular service provider in Indonesia as compared to the network behavior of knowledge dissemination.
2. Social Network Analysis Metrics
Characteristic of a network can be described by using seven properties of graph, i.e. (1) average degree, (2) density, (3) modularity, (4) average clustering coefficient, (5) diameter, (6) average path length, and (7) connected component [6]. In information dissemination case, the properties above can be interpreted as follow.
An average degree of a network is the ratio between the numbers of edge compare to the number of node. It shows the average connection that every node has. In this case it shows average connection of every user has in a community. The bigger the average degree, the more shortcuts found from one person to any person in the network, the faster information spread between persons. Increment of average degree automatically reduce diameter of network since it will reduce the longest shortest path required between nodes.
Density of a network shows ratio of actual connection compare to the maximum possible connection happened in the network. The denser a network, the more connections and shortcuts found in that network. It also leads to faster information dissemination. In a denser network a product message would spread faster.
TELKOMNIKA Vol. 15, No. 1, March 2017 : 336 – 340
concern of product feature in every community. A higher modularity could lead to the increment of product information dissemination.
Clustering coefficient in a network shows tendency of connected nodes to create a group. The coefficient number is laid between 0 to 1. Zero means that every direct connected node to a particular node does not have any connection among them. Clustering coefficient one means that every node that directly connected to a particular node is connected to each other as well. Every node in the network has their own clustering coefficient. The mean of this coefficient then create average clustering coefficient of a network. The higher the average clustering coefficient means the denser the network is. As we have explained beforehand, denser network means better information dissemination.
Diameter of a network is the longest of shortest path found between two nodes in the network. Denser network tends to have smaller diameter. Therefore, smaller diameter would lead to faster information dissemination across network.
Average path length is the mean of all shortest paths in the network. The smaller the number, the denser the network.
The last property is connected component. This property shows the number of component in the network that connected to each other at least by one path. Larger number of connected component means the network is forming many islands but connected to each other. It also means that the network is formed by many specific communities that are connected to each other.
In this research we acquire the datasets of the seven brands by crawling conversational data from twitter using keywords related to each brand. We conduct data cleaning in order to remove conversations that has no relation with the particular brand. To analyses conversational data, we use visualizations tool to represent conversational data in the form of graph. The node in the graph is represented twitter user. The edge between nodes exists if there is conversation between two or more users. There is conversation between users if a tweet/post from a user is replied or forwarded by another one, or a tweet is designated for a specific user.
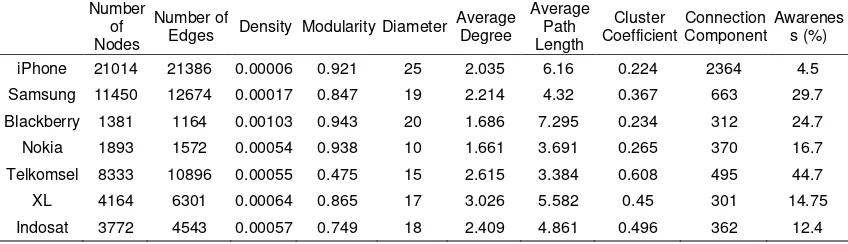
From those seven datasets, we formed seven graphs that represent network between users of each brand. For each graph we calculate seven properties as explained above. Table 1 shows the properties of each graph. The conversation crawled is from one-month duration for each brand, limited to posts that create conversation and for user who post the message from Indonesia only.
Table 1. Graph Properties of the Seven Brands. (Awareness ratings are courtesy of Frontier Consulting Group)
3. Modelling Brand Awareness with Multiple Regression
A response variable with continuous scale can be modeled by using linear regression. We choose linear regression over polynomial regression to avoid over fitted model against small number of dataset. A simple linear regression uses one predictor to predict a response variable (equation 1). But in this case there is more than one predictor. Thus we use multiple regressions (equation 2) that can accommodate multiple predictor variables.
(1)
(2)
The numbers of graphs we have are fewer than the number of properties, which may lead to inadequate sample. To avoid this problem, we reduce the number of variable into five, i.e. reducing the number of property in the regression function. The network properties that we use are: (1) density, (2) modularity, (3) clustering coefficient, (4) diameter, and (5) connected component. We exclude the network properties of average degree and average path length for it has positive correlation with density.
We ignore the size of network (number of nodes and edges) because we want to focus on the network structure. We also exclude average degree and average path length properties from our analysis because those two properties explain more to inter-individual relationship than how the network took shape.
The analysis using multiple regressions give us coefficient for each properties as shown in Table 2.
Table 2. Coefficient for Multiple Regression Function of Brand Awareness Network Properties
Density Modularity Diameter Cluster Coefficient Connection Component Intercept -2.689e+04 -1.633e+02 1.358 -1.592e+02 -2.702e-02 2.232e+02
4. Discussion
Table 2 shows the trend for each network property. We find that most of the trend is different, even consistently contradict with our assumption of a good network structure that is applied in knowledge dissemination. The table shows that if brand awareness score increase, it will reduce density, modularity, cluster coefficient, and connection component. It also tells that the increment would increase the diameter of a network. Overall the analysis result suggests that the better the brand awareness of a product, the lesser the network performance in spreading knowledge or information.
This finding can be explained as follows: (1) conversation in social media about a brand might be dominated with negative content, such as complaint [9], (2) brand awareness is more to how consumer perceived a product to match their needs, not about how well information about a brand spread across the network, (3) community or cluster formed in the network might shows conversation on specific problem/complaint faced by the customer rather than specific interest on product’s feature [10].
Based on the reasons above we suggest how to define each network property for brand awareness problem. Density shows how many people is interacted altogether in a discussion of a problem. The more the density means the more people a user interact with in discussing a particular problem. Modularity shows how distinct is the problem around a product or service. Larger modularity means clearer boundary between communities or topic of discussion. Diameter of a network shows the maximum distance between a user and potential solution that already discussed inside a network. Clustering coefficient shows tendency of conversation between users to create a discussion group. And connected component shows interconnection between different discussion groups.
Y
=
a
+
b
X
Y
=
a
+
b
TELKOMNIKA Vol. 15, No. 1, March 2017 : 336 – 340 5. Conclusion
SNA metrics can be used to analyses conversational network in social media. Although the interpretation of those metrics can be differ regarding the context of the network. The analysis result of network properties from several top brand products using multiple regressions shows us that conversational network in social media regarding top brand products might not have the structure as we expect in knowledge dissemination context. Brand with better awareness doesn't necessary to have a good network to support its marketing campaign, such as word of mouth message.
The result of this research could help industries to gain better insight from their customer, especially if they are already using social media as one of their data resource. More studies are required to get more detail view of the network, such as analyzing the conversations using text mining algorithm. Eventually the research could assist a brand owner to optimize their marketing effort by anticipating problems that arise among their customers.
References
[1] Magdy W, et al. FailedRevolutions: Using Twitter to Study the Antecedents of ISIS Support. 2015. [2] Mocanu D, et al. Collective attention in the age of (mis)information. 2014.
[3] Issenberg S. A More Perfect Union: How President Obama’s Campaign Used Big Data to Rally Individual Voters. MIT Technology Review. 2012; 116(1): 38-49.
[4] Friedman JH. Data Mining and Statistics: What's the Connection? Department of Statistics, Stanford Uni versity.
[5] Knobil M. Superbrands: An Insight into 100 of Britain's Strongest Brands: Insight into 100 of Britain's Strongest Brands. Superbrands Ltd. 2001.
[6] Alamsyah A, Peranginangin Y. Effective Knowledge Management using Big Data and Social Network Analysis. ISCLO 2013 Proceeding. Bandung: 2013.
[7] Kotler P, Keller KL. Marketing Management. 14th edition. New Jersey: Prentice Hall. 2012. [8] Newman MEJ. Networks: An Introduction. New York: Oxford University Press. 2010.
[9] Institute of Customer Service. Service Goes Social: how organisations can deliver customer service through social media. Institute of Customer Service. 2015.
[10] St tes , Str ns A. Complaining Behaviour in Social Media. Socialines Technologijos. 2015; 5(1): 22-31.
[11] Turkey JW. The Future of Data Analysis. The Annals of Mathematical Statistics. 1962; 33(1): 1-67. [12] Chambers JM. Chapter 4 Linear models. In Chambers JM, Hastie TJ. Editors. Statistical Models in S.
London: Chapman & Hall. 1993: 95-144.
[13] Wilkinson GN, Rogers CE. Symbolic descriptions of factorial models for analysis of variance. Applied Statistics. 1973; 22: 392-399.
[14] Brandes U. A Faster Algorithm for Betweenness Centrality. Journal of Mathematical Sociology. 2001; 25(2): 163-177.
[15] Tarjan R. Depth-First Search and Linear Graph Algorithms. SIAM Journal on Computing. 1972; 1(2): 146-160.
[16] Li J, Zhang B. Limitation of Small-world Topology for Application in Non-Dominated Sorting Differential Evolution. TELKOMNIKA. 2012; 10(2): 400-408.
[17] Nasiruzzaman ABM, Pota HR. Complex Network Framework Based Comparative Study of Power Grid Centrality Measures. International Journal of Electrical and Computer Engineering. 2013; 3(4): 543-552.