DETERMINANTS OF INDONESIA FURNITURE EXPORTS
TO THE EUROPEAN UNION AND THE IMPACT OF
ECOLABELS
IMAM SUWITA
BOGOR POSTGRADUATE SCHOOL
AGRICULTURAL UNIVERSITY
STATUTORY DECLARATION
I, Imam Suwita, hereby declare that the master thesis entitled
“Determinants of Indonesia Furniture Exports to the European Unionand the
Impact of Ecolabels” is my original work under the supervision of Advisory
Committee and has not been submitted in any form and to another higher education institution. This thesis is submitted independently without having used any other source or means stated therein. Any source of information originated from published and unpublished work already stated in the part of references of this thesis. Herewith I passed the thesis copyright to Bogor Agricultural University.
Bogor, Januari 2016
RINGKASAN
IMAM SUWITA. Faktor-faktor yang Mempengaruhi Ekspor Furnitur Indonesia ke Pasar Uni Eropa dan Pengaruh dari Ecolabel. Dibimbing oleh HERMANTO SIREGAR dan FLORIAN PLOECKL.
Perdagangan bebas memiliki pengaruh yang sangat besar terhadap industri furnitur di Indonesia karena menciptakan berbagai tantangan baru, diantaranya meningkatkan persaingan diantara negara pengekspor dan menumbuhkan kekhawatiran akan meningkatnya penerapan ecolabel di negara-negara pengimpor. Adapun tujuan dari penelitian ini adalah untuk menganalisis pengaruh dari penerapan ecolabel dan faktor-faktor utama lainnya, serta untuk meneliti daya saing dari produk furnitur Indonesia di pasar Uni Eropa.
Gravity model dengan panel data, yang terdiri dari 27 negara Uni Eropa dengan periode waktu 15 tahun dari tahun 2000 sampai 2014, digunakan untuk menganalisis faktor-faktor yang mempengaruhi ekspor produk furnitur Indonesia. Hasil analisis menunjukkan bahwa GDP dan populasi negara pengimpor serta nilai tukar riil berpengaruh terhadap aliran ekspor produk furnitur Indonesia di pasar Uni Eropa. Sedangkan pengaruh dari ecolabel belum dapat disimpulkan dan diperlukan penelitian lebih lanjut untuk menganalisis pengaruh yang sebenarnya dari variabel ini. Selain itu, daya saing furniture Indonesia dianalisis dengan menggunakan metode revealed comparative advantage, dan hasil analisis menunjukkan bahwa produk furniture Indonesia memiliki daya saing yang tinggi di pasar Uni Eropa, namun secara umum terjadi penurunan tingkat daya saing dalam rentang waktu delapan tahun terakhir.
Untuk meningkatkan export furniture Indonesia ke pasar Uni Eropa, pembuat kebijakan dapat membuat suatu program yang dapat menunjang industri furniture, terutama bagi industri kecil dan menengah sehingga dapat meningkatkan kualitas dan rancangan dari produknya. Pembuat kebijakan juga dapat memberikan informasi kepada produsen furniture terkait regulasi, standard dan kondisi pasar Uni Eropa. Hal lain yang dapat dilakukan adalah melakukan kerjasama dengan institusi keuangan maupun laboratorium milik pemerintah dalam menyediakan bantuan keuangan atau skema pembayaran untuk sertifikasi produk yang tidak memberatkan bagi industry kecil dan menengah.
Selain itu pemerintah juga harus dapat menjaga kondisi ekonomi makro, seperti menjaga nilai tukar dan kondisi politik yang stabil. Pengambil kebijakan juga harus dapat menyediakan peraturan yang efektif terutama dalam penyediaan infrastruktur dalam bidang transportasi, telekomunikasi, teknologi dan birokrasi sehingga dapat mengurangi biaya produksi dan waktu pengiriman. Hal lainnya yang dapat dilakukan adalah dengan mendukung industry cluster dan zona ekonomi khusus bagi industri furniture karena hal ini dapat meningkatkan produktivitas, efisiensi dan inovasi sehingga dapat mempercepat pertumbuhan industri furniture di Indonesia.
SUMMARY
IMAM SUWITA.Determinants of Indonesia Furniture Exports to the European Unionand the Impact of Ecolabels. Under Supervision of HERMANTO SIREGAR and FLORIAN PLOECKL.
Trade liberalisation has great implications for the Indonesian furniture industry as it creates new challenges,such as rising competition among exporting countries and growing concerns about the impact of increasing implementation of ecolabels in importing countries. The objective of this study is to analyse the influence of determinants and ecolabels, on export of Indonesia furniture products, and to investigate competitiveness of Indonesian furniture in the EU market.
The analysis of determinants of Indonesia furniture export are assessed using gravity models constructed with panel data derived from 27 EU countries and 15 time periods from 2000 to 2014. The result indicates that GDP of importing countries, real exchange rate and population, significantly influence export flow of Indonesian furniture products into the EU market, while the effect of ecolabels are inconclusive and further study is needed to analyse the real impact of these variables. Meanwhile, the competitiveness of Indonesian furniture is assessed using revealed comparative advantage. The result indicates that Indonesian furniture has strong comparative advantage in the EU market, however, the general trend of Indonesian comparative advantage has decreased over the last eight years.
To increase export of Indonesian furniture to the EU market, it is recommended that:Policy makers couldintroduce programs to support the furniture industry, especially for SMEs, to improve quality and design of products.Then inform furniture producers about the EU regulations, standards and market access conditions. Moreover, policy makers could work together with financial institutions andgovernment laboratories to provide financial supports for certification orto propose a payment scheme which is not burdensome to SMEs.
Furthermore, government must be able to provide appropriate macroeconomic conditions,such as maintaining a stable real exchange rate and political stability. Policy makers shouldintroduce effective regulations to improve infrastructure, especially in transportation, telecommunication, technology and bureaucracy to reduce cost of production and time delivery. Moreover to support furniture industry clusters and facilitate special economic zones, as clusters could increase productivity, efficiency and capacity of innovation which lead to faster growth of Indonesian furniture industry.
© Copyright belongs to IPB, 2016
All rights Reserved Law
Prohibited quoting part or all of this paper without including or mentioning The source. The quotation is only for educational purposes, research, scientific writing, preparation of reports, writing criticism, or review an issue; and citations are not detrimental to the interest of IPB.
DETERMINANTS OF INDONESIA FURNITURE EXPORTS
TO THE EUROPEAN UNION AND THE IMPACT OF
ECOLABELS
IMAM SUWITA
Master Thesis
As a requirement to obtain a degree Master of Science in
Economics Program
POSTGRADUATE SCHOOL
BOGOR AGRICULTURAL UNIVERSITY
BOGOR
ACKNOWLEDGEMENT
First of all, I would like to express my gratitude to Allah S.W.T. for His blessing which enable me to accomplish this thesis. I would also like to extend my gratitude to my supervisor, Prof. Hermanto Siregar and Dr.Florian Ploeckl, for their excellent suggestions, guidance and support during the completingof this thesis.
In addition, I would like to thank to Australia Awards Scholarship, Ministry of Trade, Bogor Agricultural University and the University of Adelaide for providing sponsorship to undertake my study.I would also like to express my deepest gratitude to all lecturers in the School of Economics who had shared their valuable knowledge and to all staff of the University of Adelaide, especially Athena, Niranjala and Gus who were always willing to help and give their best suggestions tosupport my study.
Finally, I would like to express my sincere appreciation to my family, friends and anybody who has supported and encouraged me throughout my study.
Bogor, Januari 2016
TABLE OF CONTENTS
LIST OF TABLES ... xiii
LIST OF FIGURES ... xiii
1 INTRODUCTION ... 1
2 BACKGROUND ... 2
Indonesian Furniture Industry ... 2
The EU Furniture Market ... 3
The EU ecolabel ... 4
3 LITERATURE REVIEW ... 5
The Gravity Model ... 5
Revealed Comparative Advantage ... 6
4 SPECIFICATION AND DATA ... 7
Specification and Data for Gravity Model ... 7
Specification and Data for Revealed Comparative Advantage (RCA) ... 10
5 RESULTS ... 11
Factors affecting the export flow of Indonesian furniture to the EU market .... 11
Competitiveness of Indonesian furniture in the EU market ... 14
6 CONCLUSION ... 17
REFERENCES ... 19
APPENDICES ... 22
LIST OF TABLES
Table 1. Estimates result for all furniture (HS 9403) ... 12
Table 2. Summary of gravity results for furniture made of wood, metal and plastic ... 13
Table 3. Indonesia‟s RCA value for furniture (HS 9403) against selected countries from 2000-2014. ... 15
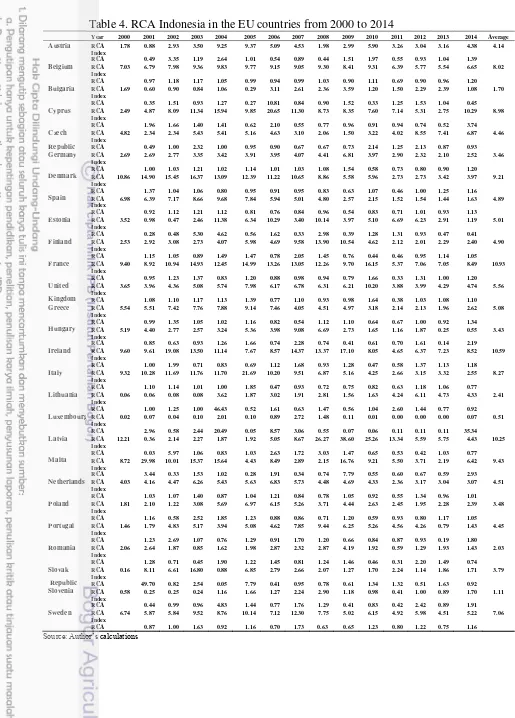
Table 4. RCA Indonesia in the EU countries from 2000 to 2014 ... 16
LIST OF FIGURES Figure 1. Furniture export (HS 9403) to the EU from world‟s five top exporter countries 3 Figure 2. Indonesian furniture export (HS 9403)to the EU ... 3
Figure 3. Export flow furniture made of wood, metal and plastic to the EU market. ... 14
LIST OF APPENDICES Appendix 1. Hausman Test (HS 9403) ... 22
Appendix 2. Fixed Effect estimation using robust ... 23
Appendix 3. Estimation result for furniture made of wood ... 24
Appendix 4. Estimation result for furniture made of metal ... 25
1 INTRODUCTION
Trade liberalisation has substantialimplications for the global furniture industry as it creates both new opportunities and new challenges. The most valuable benefits that globalisation can provide is wider market access to trade. In the last two decades, openness in the furniture market has increased and furniture trade in the international market has grown very fast from US$42 billion in 1997 to US$97 billion in 2007 (You 2007). However, new opportunities are accompanied by enormous challenges, such as increasing competition in the international market (Awuwah & Amal 2011) and growing concerns about increasing implementation of non-tariff measures, such as licencing, technical regulations and labelling (Lord, Oktaviani & Ruehe 2010). For example, the European Union (EU) provides large market access for Indonesian products. According to the Eurostat data, trade between Indonesian and EU reaching € 20 billion in 2010.Nonetheless, especially for furniture products, the European Commission implements voluntary ecolabels for furniture sold in the EU market.
It has now become a matter of concern whether the implementation of the EU‟s ecolabel has a trade-impeding effect on export of Indonesian furniture (Sianturi & Subarudi 2008).The furniture industry plays an important role in Indonesia‟s economy because most of furniture producers are small to medium enterprises (SMEs). These companies provide a source of employment for almost two million people, and the export of their products makes a significant contribution to Indonesia‟s economy (TREDA 2008). Empirical literature analysing the Indonesian furniture trade with the EU is still limited. Hence, it is important to investigate the export flow between these countries, especially regarding the impact of the European Union‟s ecolabel on Indonesia‟s furniture exports to the European Union market. Such investigation may help furniture producers in Indonesia to develop a better strategy to compete in this market
With the introduction of the ecolabel comes new challenges, especially for Indonesia competing in the EU market. In EU countries, including Germany, United Kingdom and France, people are already environmentally aware and people are more likely to buy environmentally friendly products. Moreover, local and regional authorities explicitly promote ecolabel products in their procurement guidelines. As awareness of environmental friendly products increases, the demand for these products also rises. In this case, the ecolabel provides opportunities for exporting countries to serve this niche market, on the other hand, it also creates challenges because to get the ecolabel exporting countries must be able to meet specific requirements. Thus, this study aims to answer the following research questions:
1. What is the impact of the implementation of the EU‟s ecolabel policy and the determinants influencing export flow of Indonesian furniture to the EU market? 2. What is the degree to which Indonesian furniture products are competitive in
the EU market?
to the EU. To answer the second question, this study used revealed comparative advantage (RCA) to analyse the competitiveness of Indonesian furniture products in the EU ranging from 2000 to 2014.
This study is structured in six sections. Section one is the introduction, section two provides an overview of the Indonesian furniture industry, the EU‟s furniture market and the implementation of ecolabel policy. Section three reviews the literature and theory on gravity model and RCA. Section four presents the main specifications and data used in the gravity model and RCA. Section five discusses results of the analysis. Section six draws final conclusions.
2 BACKGROUND
Indonesian Furniture Industry
This section provides an overview regarding the role of the furniture industry in Indonesia‟s economy, major competitor countries and the type of furniture products exported to the EU market.
The furniture industry has an important role in Indonesia‟s economy as it provides job opportunities for Indonesian people. This industry employs two million people directly, and an additional eight million workers indirectly (TREDA 2008). Most of the industry involves small and medium enterprises (SMEs) and contributes to substantial poverty alleviation throughout Indonesia. Typical Indonesian furniture products are made of wood and rattan. Around 57 per cent of Indonesian furniture exports are made of wood, another 20 per cent consist of furniture made of rattan, and around five per cent include other materials such as bamboo, plastic and metal (TREDA 2008). This is because Indonesia has an abundance of raw materials, especially wood. Almost 108 million hectares of Indonesian land area consist of permanent forest (TREDA 2008).
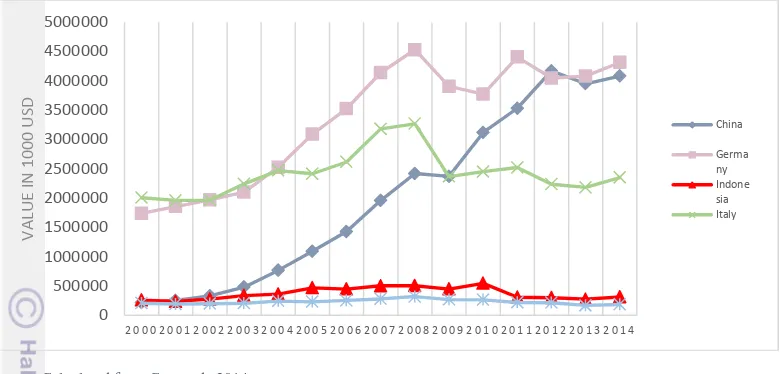
Furniture products from Indonesia are exported mostly to EU countries. In
2009, almost 33 per cent of Indonesia‟s furniture export addressed the EU market
Source: Calculated from Comtrade 2014
Figure 1. Furniture export (HS 9403) to the EU from world‟s five top exporter
countries
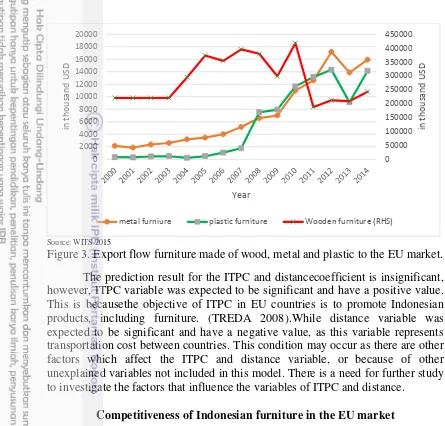
Figure 2 shows Indonesian wooden furniture exports almost doubled from 2000 to 2007, with slight drops in 2001 and 2006, but since 2010 exports have continued to decrease. This pattern raises the question of whether the decrease in the export flow has been influenced by implementation of the EU ecolabels which may have decreased competitiveness of Indonesian furniture products in the EU market, or because of other factors. This question is answered by analysing these factors using gravity model and RCA.
Source: Calculated from Comtrade 2014
Figure 2. Indonesian furniture export (HS 9403)to the EU
The EU Furniture Market
This section explores the EU furniture market in terms of market prospects and market access requirements. This information can be used to identify the opportunities and challenges presented by this market.
share for furniture products. Since 2002 the trade balance for furniture in EU countries as one entity has decreased dramatically. Specifically, from 2002 to 2008 the trade balance of EU furniture products deteriorated by 1.8 billion euros. This means that EU countries import more furniture products from abroad than countries is affected by many factors, such as macro-economic conditions like the monetary crisis. Other factors which influence demand are increasing gross domestic product (GDP), price, promotion activities and taste (Salzman 1997). One of the significant factors which has influenced demand is changes in GDP. Lord,Oktaviani & Ruehe (2010) estimated the effect of GDP changes on furniture imports in the EU market. The results showed that when the EU‟s real GDP increases by one per cent there is an average increase in furniture import by 3.8 percent. This condition offers great opportunities for furniture exporter countries to export furniture to this market.
There are two market access requirements for Indonesian exporters in entering EU markets: tariff and product specific requirements (European Commission 2015). Since 2010, two types of tariff applied to furniture from developing countries: a 2.3 per cent advolarem tariff of the most-favoured-nation (MFN) and a 0.2 per cent preferential tariff rate of generalised system of preferences (GSP) which applies to Indonesia. Moreover, there are two product specific requirements applied to furniture, general product safety requirements and rules of origin (European Commission 2015).
The EU ecolabel
Currently, third-party (governmental organisation or a private non-commercial entity) environmental labelling, such as the ecolabel program, is increasing globally. However, many organised industries claim that this kind of label could result in a trade barrier (Salzman 1997), as to get this label the furniture industries have to spend a lot of efforts and costs. All of expenses incurred will increase cost of production, this led to increase in selling price of the products, which resulted in a decreased of price competitiveness. For Indonesian furniture industries, which are mostly small and medium enterprises (SMEs), it is very hard to obtain the EU ecolabel because it is costly (Sianturi & Subarudi
2008). For example, to get the EU ecolabel, a company must spend around € 2000
for application fee and approximately €25000 for annual fee (European Commission 2015).
organisations have strong purchasing power; 16 per cent of the EU‟s GDP is used for public procurement (Nissinen, Parikka & Rita 2009).
Ecolabels exist because of growing environmental concern. In the last two decades, consumer concern has increased, especially regarding the environmental impacts of their purchases. Four out of five consumers in European countries would like to buy products that support sustainable development (European Commission 2015). Ecolabels arose because of consumer needs to identify which products are environmentally friendly. The objective of ecolabelling is to provide information to consumers about the environmental qualities of the product. For the furniture industry, the ecolabel is expected to increase competitiveness and sales of an ecolabelled product in the market. For the government and environmental groups, ecolabels can be used as an instrument to promote environmental protection.
The EU‟s ecolabel can be applied to many product groups, such as chemicals, electronics, furniture and other products, including wooden furniture. In November 2009, the European Commission established an ecological criteria used to assess wooden furniture products (European Commission 2015). The criteria is based on ISO 14024 which focuses onthe furniture life cycle starting from the processing of raw materials (wood must be obtained from legal sources) through tomaterial production, delivery to the consumer and ease of recycling. The objectives of these criteria are to reduce the impact of furniture products on human health and the environment throughout the product life cycle. The awarding body for this label is governmental organisations or private non-commercial entities (Allison 2000).
3 LITERATURE REVIEW
In the era of trade liberalisation each country tries to reduce trade barriers to increase access to international markets. Greater access to international markets will increase competition between countries and this condition raises many considerations, such as do all countries benefit from these conditions?How does trade policy, such as ecolabels, affect trade flow between countries?What are the factors that influence trade in the international market? The answers to these questions can be considered from a theory perspective and in empirical research. In the next section, the gravity model are discussed, as this model concerns the factors likely to influence trade flows between countries.
The Gravity Model
method used by Tinbergen inspired other researchers to use the gravity model in their studies (Krugman and Maurice 2005).
The gravity model has been very popular and is used widely by researchers around the world. This model can be used to analyse trade between bilateral countries.For example, Rahman (2003) used this model to analyse export between Bangladesh and its trading partners. This author found that trade is determined by GNP per capita, openness, distance and size of the economy. Moreover, this model was also used to investigate trade between one country and a block of countries. For example, Anaman &Al-Kharusi (2003) used the gravity model to showthe determinant factor of Brunei‟s trade with the EU is the population of Brunei and the EU. Martinez-Zarzoso & Nowak-Lehmann (2003) used this model to investigate the relationship between the formation of regional trade blocs, volume and direction of international trade. Moreover, thegravity model also can be used to analyse intra-regional trade. For instance, Thornton and Goglio (2002) showed that factors affecting intra-regional trade between ASEAN countries is common language, distance and economic size. This modelis also used to investigate a specific industry or individual sector between countries, such as Martinez-Zarzoso & Nowak-Lehmann (2004) who used the gravity model to classify export sectors based upon their sensitivity on economic and geographic distance. Their results showed that geographical distance significantly affectsthe furniture and footwear sectors in bilateral trade between EU countries.
There is a wide range of potential for implementation of the gravity model and many variations of the gravity equation have been used by researchers. Variables commonly used in the gravity model are GDP or GNP as a proxy to measure economic mass of importing and exporting countries (Montanari 2005). Furthermore, distance is usually used in this model to estimate transport costs between countries which are usually measured as the distance between capital cities of the countries. Policy variables including trade agreement, domestic trade policy,such as labelling and establishing a promotion centre,can also be included in the gravity model.
Revealed Comparative Advantage
Revealed comparative advantage (RCA) is used to calculateexport share and relative advantage of a commodity or a sector in a particular countrycompared to the world. When a country has RCA index greater than one (RCA>1), it is said that this country has a comparative advantage, otherwise, it has a revealed comparative disadvantage (Balasa 1979).A country is said to have a comparative advantage if this country relatively has abundance of factor production or endowment compared to other countries (Sun 2011). Many countries can getbenefitsfromtrade byproducing and export goods which is relatively more efficient than their competitors, and import goods in which the country is relatively less productive (Oktaviani & Novianti 2009).In other words, comparative advantage achieved when labor force in a country produce more goods compared to other countries.
Many studies have been conducted byusing RCA,for example, Haque et al.
and pricing strategies are the key success of Malaysian furniture industries.Moreover, Gusman et al (2012) measured competitiveness level of Spanish furniture industries and showed that technology, costreduction and financial performanceare determinants of Spanish furniture comparative
advantage.Furthermore, Han et al. (2009) conducted research on the global
competitiveness of the Chinese wooden furniture industry and showed that Chinese wooden furniture has move from comparative disadvantage to comparative advantage. Then, Song and Gazo (2013) used RCA to analyse competitiveness of the household and office furniture industry in the US finding that in the last decade the US furniture industry has had comparative disadvantage due to rapid expansion in developing countries. While many researchers have used RCA to analyse competitiveness of different kinds of products, such as Sinaga & Siregar (2010), identified significant factors affecting the competitiveness of Indonesian palm oil in the China market. Result of the study revealed that production, technology, and revitalization of crops program affects the competitiveness of Indonesian palm oil in the China market. There is still limited research using RCA to analyse furniture product export from Indonesia. Hence, this study fills a gap in the literature.
4 SPECIFICATION AND DATA products from Indonesia and there are rising concerns that implementation of the
EU‟s ecolabel may affect negatively on exports. In this study, the gravity model
was appliedto analyse the EU‟s ecolabel and other determinant factors, as this modelis most frequently used in analysing trade in recent years.The model adopted Newton‟s gravitation theory which explains that gravitation attraction between two objects is influenced by their masses over the square of their
distance. The Newton‟s gravity model can be written as:
Tinbergen (1962) was the first researcher to apply this model to analyse trade flows between countries.Later, other researchers followed his model. The
gravity model used in bilateral trade is a modified version from Newton‟s gravity
model. The model can be written as:
(2) model uses many variables, such as GDP from target countries (which represents the economic size of these countries),exchange rate(which is used as a proxy of price), and population of target countries (which is used to represent additional mass for bilateral trade). Moreover, there are four dummies variable (binary
variable), namely dummy for the EU‟s ecolabel, Indonesian trade promotion
centre (ITPC) and time dummies. The gravity model used has the following form:
( ) ( ) ( ) ( )
Hungary, Ireland, Greece and Finland,with the period of observation from 2000 to 2014.
EXPijt represents the export value (real US$) of Indonesian furniture to
importing country j in year t.Data was obtained from the WITS database. In this
study, furniture exportwas grouped into four categories based on the harmonises system (HS). The first category isall furniture in HS code 9403 (other furniture and parts thereof). Second category is sub-group from HS9403 which includeswooden furniture consisting ofcodesHS 940330 (wooden office furniture), HS 940340 (wooden kitchen furniture), HS 940350 (wooden bedroom furniture), HS 940360 (wooden furniture, excluding for offices, kitchens and bedrooms). Third category is metal furniture which consists of HS 940310 (metal office furniture) and HS 940320 (metal furniture excluding for offices, seats and medical, surgical, dental or veterinary furniture). Finally, the fourth category is plastic furniture, HS 940370 (furniture of plastic excludes medical, dental, surgical or veterinary and seats).
This studyanalysed four gravity models to explore the impact of the EU‟s
ecolabel and other determinantson export flow of all furniture in HS 9403, it also analysed impact of the furniture product base on the other three categories (metal, plastic and wood furniture).
GDPjtrepresents proxy for absorption capacity of importing countries. It represents economic size, purchasing power and demand for Indonesian furniture. Data for GDPs importing countries was obtained from the UNCOMTRADE database (US$ constant 2005). This variable is expected to be significant and positively related to trade.
DISTij represents bilateral distance between Indonesia and EU countries. Data was obtainedfrom the CEPII data base, measured in Km (Kilometres) between capital cities. This variable was used as a proxy of the resistance variable or transportation costsbetween countries and was expected to be negative related to trade.
POPjt represents population of importing countries and was used to represent
market size of countries.When population increases, the market expands and creates more trade. This variable is expected to have significant value and positive sign.Population data was extracted from the World Bank database.
RERij represents real exchange rate and was used as a proxy of trade variations among importing countries. Exchange rate data was obtained from the World Bank database. The real exchange rate was calculated from the average of annual national currency unit of EU countries per US$, divided by Indonesia‟s annual average currency unit per US$, then multiplied by the ratio of consumer price index (CPI) between the two countries.
ECOjtrepresentsthe EU‟s ecolabel dummy variable andwas used to show the
presence of ecolabel policy in importing countries.
ITPCjt representsthe Indonesian trade promotion centre (ITPC) that exists in
several EU countries. One of the objectives of ITPCs is to promote Indonesian products in the EU, for this reason this variable is expected to be positive.
This study applieda gravity model with panel data that includes 405 observations from 27 countries and 15 period of time. A panel data is used to cover trade variation between Indonesia and the EU during a period of fifteen years. Estimation using panel data has several advantages, such as it can measure effects that can be captured by time series and cross section data, and can control individual heterogeneity, reduce collinearity and provide more degrees of freedom (Baltagi 2005).
In this study, panel estimation will be undertaken by using ordinary least squares (OLS), fixed effect (FE) and random effect (RE) (Gujarati 2004). Pooled estimation is the simplest approach. It assumes there is only one slope coefficient and one intercept. This method assumes there are no time and individual effects. On the other hand, individual and time effect takes into account in fixed effect method. Fixed effectallows variation in the intercept for each time and individual by using intercept dummy variables and let the slope of the coefficient remain constant.Another approach used in panel data is the random effect method. In this method it is assumed that the intercept is a random variable and there is no correlation between individual errors. In this study the model was estimated by all three methods. Then, Hausman and LM test were conducted to select the most efficient method.
Specification and Data for Revealed Comparative Advantage (RCA)
In this study, revealed comparative advantage (RCA) wasused to analyse the competitiveness of Indonesian furniture in the EU market. RCA is widely used to determine the competitiveness of a product or commodity in the international market. The model of RCA applied in this model is that introduce by Balasa (1979) which is widely known as the Balassa index. The value obtained from the calculation using this method could be used as a benchmark to show competitiveness of Indonesian furniturecompared to the same product from other countries. If the value of RCAis greater than one (RCA> 1), then it can be interpreted that the country is specialised in that sector or Indonesian furniture has comparative advantage in the export destination countries. On the other hand, if the value of RCA is less than one it means that Indonesian furniture has a comparative disadvantage. However, many reseachershave tried to modify the
range of the index value (Zhang et al, 2008),such as when RCA≥2.5 it shows an
extremely strong comparative advantage; 1.25≤RCA<2.5(strong comparative
advantage); 0.8≤RCA<1.25 (moderate comparative advantage); RCA<0.8 weak comparative advantage and RCA<0 (comparative disadvantage). The Balassa index has the following form:
Xij=Exportsof commodity i by country j
Xiw = World exports of commodity i
Xw= Total world export.
Many researchers also use RCA index to show the export performance of a product. When RCA index is equal to one it means there is no increase in the competitiveness or export performance of the product in the international market (Batra and Khan, 2005).
To analyse competitiveness of Indonesian furniture this study used two kinds of RCA calculation.First, competitiveness of Indonesian furniture in the EU market was compared with four competitor countries, and secondly, competitiveness of Indonesia furniture with every member EU country was estimated.
5 RESULTS
Factors affecting the export flow of Indonesian furniture to the EU market
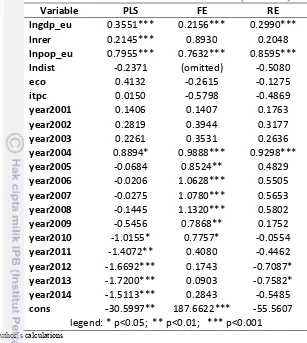
The estimation result of the impact of ecolabel and other determinant factors on export flow of Indonesian furniture to the EU market using equation (3) is presented in Table 1. The first column shows the pooled least squares (PLS) results, while fixedeffect (FE) and random effect (RE) results are presented in columns two and three, respectively.
Results from the three methods used to estimate the coefficient show that there are two variables shown to be consistent between these three methods, namely GDP and time dummy variable in 2004. In this case, Chow test and Hausman test were used to determine which method is better between FEand PLS, then FE and RE, respectively. Results of the Chow test are shown by the value of Prob>F in the FE estimation result using the STATA program. The value of Prob>F=0.000 when the value of (Prob>F) <Alpha 0.05 means that FE is better than PLS. In this case FE is the best choice. The result of the Hausman test is presented in Appendix 1. The Hausman test result revealed that the value of Prob>Chi2=0.000. When (Prob>Chi2) <Alpha 0.05 it means that the FE are more appropriate than RE. In this case FE was chosen as the best estimation.
The determinants of export flow of furniture products from Indonesia to the EU market, which have a significant value based on FE results are: economy size (GDP of importing countries), market size (population of importing countries), and time dummies. On the other hand, real exchange rate, ITPC and ecolabel are statistically insignificant.
Table 1. Estimates result for all furniture (HS 9403) furniture to the EU. Results show that when market size increases by one per cent then export of Indonesian furniture to the EU increase by 0.763 percent. This finding is consistent with the hypothesis for this variable.
The ITPC and ecolabel variable are statisticallyinsignificant, while time dummy variables show positive significant value from 2004 to 2010 meaning there are increases in furniture export from Indonesia to the EU market in this period of time, probably because the monetary crisis in America has decreased demand for furniture from Indonesia, and Indonesian furniture exporters arediverting to EU countries.
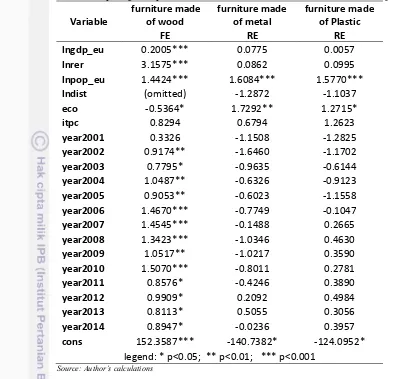
Table 2. Summary of gravity results for furniture made of wood, metal and plastic
cons 152.3587*** -140.7382* -124.0952* legend: * p<0.05; ** p<0.01; *** p<0.001
Source: Author’s calculations
Results of the gravity model revealed that GDP importing countrieshave a positive and significant value for furniture made of wood. An increase by one percent of GDP (economy size) of these countries will increase Indonesian furniture made of wood export by an average 0.2 per cent.
The real exchange rate variable had a statistically significant value with a positive sign for furniture made of wood meaning that one per cent depreciation in Indonesian currency will increase by an average three per cent of Indonesian furniture made of wood to the EU market.
Population in importing countries is positive and statistically significant for furniture made of wood, metal and plastic.Results show that when market size increasesby one percent export flow of furniture made of wood, metal and plastic will increase by an average 1.5 per cent.
increased export flow nearly three-fold. Figure 3 shows export performance of furniture made of wood, plastic and metal from Indonesia to the EU countries.
Source: WITS 2015
Figure 3. Export flow furniture made of wood, metal and plastic to the EU market.
The prediction result for the ITPC and distancecoefficient is insignificant, however, ITPC variable was expected to be significant and have a positive value. This is becausethe objective of ITPC in EU countries is to promote Indonesian products, including furniture. (TREDA 2008).While distance variable was expected to be significant and have a negative value, as this variable represents transportation cost between countries. This condition may occur as there are other factors which affect the ITPC and distance variable, or because of other unexplained variables not included in this model. There is a need for further study to investigate the factors that influence the variables of ITPC and distance.
Competitiveness of Indonesian furniture in the EU market
Analysing the competitiveness of furniture industry can be assessed from many perspectives. Because of there is increasing competition in international furniture market, it is crucial to consider the present status, challenges and competitiveness of the Indonesian furniture industry. This study appliesrevealed comparative advantage (RCA) to identify the competitiveness of Indonesian Furniture in the EU‟s market.
furniture export had fallen into a lower position, reaching a low of RCA value 3.40 in 2014. Thus, over almost nine years the performance of Indonesian furniture export decreasedsignificantly. This condition may occur as a result ofvarious factors, such as Indonesian furniture being uncompetitive in the EU market compared to furniture from competitor countries or because ofa barrier to access the EU market through implementation of the ecolabel policy in EU countries.
Table 3. Indonesia‟s RCA value for furniture (HS 9403) against selected countries
from2000-2014.
Source: Author‟s calculations
Table 3 summarises RCA for aggregate furniture (HS 9403)of selected countries from 2000 to 2014. Almost all countries have a trend of decreasing RCA, except for China. In regards to individual performance, Vietnam, Indonesia and Italy displayed an extremely strong comparative advantage, Malaysia and China showed strong comparative advantage and Germany showed moderate comparative advantage. Of all selected countries, China had an upward trend and experienced a transition from moderate comparative advantage in 2000 to strong comparative advantage in 2004.Although Indonesian furniture has an extremely strong comparative advantage, the trend shows that the comparative advantage is decreasing.To maintain its competitive position, the Indonesian furniture industry needs to cope with challenges in the international furniture market, such as increasing trade barriers, unfavourable macroeconomic conditions and a technology gap as compared with competitor countries. In recent times, more technical barriers and international certification standards have been applied in the international furniture market which require the Indonesian furniture industry to produce greener products, thereby potentially restricting expansion of Indonesia export.
Table 4 shows Indonesian comparative advantage in EU countries from 2000 to 2014 whereIndonesian furniture export has a very strong comparative advantage,especially in France, Ireland and Latvia between 2000 and 2009 when RCA value reached around 10. However,from 2010 comparative advantage for these countries decreased to an RCA value of approximately 8 in 2014. Indonesian furniture has less comparative advantage in Balkan countries, such as Bulgaria, Slovenia and Romania, with RCA value of around 2. Indonesian furniture export also experienced weak comparative advantage in Luxembourg where average RCA value reached only 0.5.
Year 2000 2001 2002 2003 2004 2005 2006 2007 2008 2009 2010 2011 2012 2013 2014 Average Rank Sign China RCA 0.95 1.04 1.11 1.09 1.28 1.40 1.49 1.56 1.71 1.89 2.08 2.21 2.85 2.71 2.32 1.71 5 +
Index RCA 1.10 1.07 0.98 1.17 1.10 1.06 1.05 1.10 1.10 1.10 1.06 1.29 0.95 0.86
Germany RCA 0.90 0.96 0.94 0.82 0.81 0.95 1.03 0.98 1.09 1.14 1.13 1.23 1.21 1.20 1.15 1.04 6 -Index RCA 1.07 0.98 0.87 0.99 1.18 1.07 0.96 1.11 1.04 1.00 1.08 0.98 0.99 0.96
Indonesia RCA 4.74 4.84 5.51 6.77 6.65 7.69 6.63 6.38 5.78 5.41 5.76 2.86 3.13 3.08 3.40 5.24 2 -Index RCA 1.02 1.14 1.23 0.98 1.16 0.86 0.96 0.91 0.94 1.06 0.50 1.09 0.98 1.10
Italy RCA 2.99 2.91 2.90 2.86 2.75 2.66 2.85 2.78 2.86 2.70 2.85 2.80 2.72 2.65 2.57 2.79 3 -Index RCA 0.97 1.00 0.99 0.96 0.97 1.07 0.98 1.03 0.94 1.05 0.98 0.97 0.98 0.97
Malaysia RCA 2.55 2.64 2.82 2.67 2.61 2.43 2.29 2.22 2.62 2.66 2.34 1.85 2.08 1.60 1.64 2.33 4 -Index RCA 1.03 1.07 0.95 0.98 0.93 0.94 0.97 1.18 1.02 0.88 0.79 1.13 0.77 1.03
Generally, Indonesian furniture comparative advantage increased from 2000 to 2008 and then decreased from 2009 to 2014. This condition may occurdue to several factors such as the implementation of ecolabel in EU countries, Indonesian furniture becoming less competitive in the EU market or because of other factors such as the 2011 EU monetary crisis which triggered reduced demand of Indonesian furniture in EU countries.
6 CONCLUSION
During the past two decades the Indonesian furniture industry experienced rapid growth making Indonesia one of the leading furniture exportersglobally. However, global trade in the furniture industry has increased competition among furniture exporter countries. Moreover, Indonesian furniture has been challenged by the implementation of policy, such as labelling in the destination countries.It is crucial to assess the competitiveness of the Indonesian furniture industry and factors affecting export flow. Hence, this study conducted a regression analysis using a gravity model to investigate the effect of ecolabel implementation in EU countries and other determinant factors on export flow of Indonesian furniture. Furthermore, RCA was used to investigate competitiveness of the Indonesian furniture industry in the EU furniture market.
The first result indicates that GDP of importing countries, real exchange rate, ecolabels and population, significantly influence export flow of Indonesian furniture products in the EU market. Ecolabels have trade impeding effect on Indonesian furniture made of wood, on the other hand, it increases exports of furniture made of metal and plastic. Moreover, the effect of distance variable and ITPC are inconclusiveand further study is needed to analyse the real impact of these variables. This is probably due to the industry specific factor might create problem to the prediction of the gravity model in this context.
The second result indicates that Indonesian furniture has extremely strong comparative advantagein the EU market, especially in the period of 2000 to 2005, However, from year 2007 onward the trend of Indonesian comparative advantagehas decreasedover time. This study shows that comparative advantage of Indonesian furniture is very strong, especially in France, Ireland and Latvia, and has less comparative advantage in Bulgaria, Slovenia and Romania. On the other hand, it experienced weak comparative advantage in Luxembourg.
Increasing export of furniture products from Indonesia to the EU market requires solid cooperation between Indonesian economic operators, such as government, industry and associations. They have to work together to increase capability of the Indonesian furniture.
Policy Recommendations
In the future, Indonesia as a furniture producing country will face more challenges to compete in the EU market. To be able to compete in this market policy makers shouldimplement as strategies to improve Indonesian furniture quality and The government of Indonesia needs to work with other stakeholders, such as furniture associations, producers, distributors and other parties to create a system to increase export of Indonesian furniture to the EU market. Specifically, it is recommended that policy makers consider introducing programs to support the furniture export industry, especially for SMEs, to improve quality of products. There is a need to assist in improving technical skills, managerial skills, financial control and marketing. With these skills, SMEs could produce higher quality products and establish cooperation with mass furniture companies to meet the requirements of importing countries and compete in the international market.
REFERENCES
Allison, C 2000, 'Study on different types of environmental labelling (ISO Type II and III labels): Proposal for an environmental labelling strategy', Report, DG Environment, European Commission.
Anaman, K & Al-Kharusi, LH 2003, „Analysis of trade flows between Brunei Darussalam and the European Union‟, ASEAN Economic Bulletin, vol. 20, no. 1, pp. 60-73.
Awuah, GB & Amal, M 2011, 'Impact of globalization: The ability of less developed countries' (LDCs') firms to cope with opportunities and challenges', European Business Review, vol. 23, no. 1, pp. 120-132.
Balassa, B 1979, „The changing pattern of comparative advantage in India and China', [ICRIER] Indian Council for Research on International Economic Relations,New Delhi, <www.icrier.org>
Bergstrand, JH 1985, „The gravity equation in international trade: some microeconomic foundations and empirical evidence‟, The Review of Economics and Statistics, Harvard University Press, vol 67, pp. -81.
Cheng, IH & Wall, HJ 2005, 'Controlling for Heterogeneity in Gravity Models of
Trade and Integration', Federal Reserve Bank of St. Louis Review, vol. 87,
no. 1, pp. 49-63.
Cordella, M 2014, 'The EU Ecolabels for Mattresses and Furniture: Status report
and expected market uptake', Europur & Euro-Moulders General
Assembly & Technical Conference, Vienna, 11 June 2014.
Eaton, J & Korton, S 1997, „Technology and bilateral trade‟, NBER working paper, Cambrige, National Bureau of Economic Research, No. 6253, pp. 1-53.
European Commission 2015, 'European Commission‟s Helpdesk for developing
countries', <http://exporthelp.europa.eu>, viewed 14 October 2015.
European [GIC] German Industry and Commerce Vietnam 2006, 'The Vietnamese furniture industry ', Hanoi <www.vietname.ahk.de>, viewed 12 October 2015 Export BY 2010, 'Malaysia aims to be among top five largest furniture exporters
in the world',
<http://212.98.163.5/en/?act=news&mode=view&page=1&id=17462>, viewed 10 October 2015.
Gable, GG, Smyth, RW, Lee, J-N & Han, J 2007, 'Administrative Placement of the Information Systems Academic Discipline: A Comparative SWOT Analysis of Queensland University of Technology and Korea University', Journal of Global Information Technology Management, vol. 10, no. 1, pp. 5-30.
Gujarati, DN 2004, „Basic econometrics, 4th edn, McGraw-Hill Companies, New York.
Guzman, GM, Gutierrez, JS & Ramirez RG 2012, „Measuring the competitiveness level in furniture SMEs of Spain‟, International Journal of Economics and Management Sciences, vol. 1, no. 11, pp. 9-19.
Han, X, Wen, Y & Kant, S 2009, 'The global competitiveness of the Chinese wooden furniture industry', Forest Policy and Economics, vol. 11, no. 8, pp. 561-569.
Haque, A, Sultana, S & Momen, A 2014, „Export performance of Malaysian furniture Industry: Rethinking Competitiveness‟, Middle East Journal ofBusiness, vol. 9, no. 1, pp. 33-40.
Husted, SL & Melvin, M 2001,‟International Economics‟, 5th edn, Addison Wesley, Boston.
Krugman, PR & Maurice, O 2005,‟ International economics: theory and policy‟, 7th edn, Addison Wesley, Boston.
Lalit Mohan, K 2013, 'Analysing competitiveness of clothing export sector of India and Bangladesh: dynamic revealed comparative advantage approach', Competitiveness Review, vol. 23, no. 2, pp. 131-157.
Lee, Y 2013, 'Application of a SWOT-FANP method', Technological and
Economic Development of Economy, vol. 19, no. 4, pp. 570-592. Lindert, P 1991,‟International Economics‟, 9 ed, Homewood, Irwin.
Lord, M, Oktaviani, R & Ruehe, E 2010,' Indonesia's Trade Access to the
European Union: Opportunities and Challenges, Economic Report,
European Communities.
Martínez-Zarzoso, I & Nowak-Lehmann, F 2003, „Augmented Gravity Model: An
Empirical Application to Mercosur-European Union Trade
Flows‟, Journal of Applied Economics, vol. 6, no. 2, pp. 291-316.
Martínez-Zarzoso, I & Nowak-Lehmann, F 2004,‟Economic and Geographical
Distance: Explaining Mercosur Sectoral Exports to the EU." Open Economies Review, vol. 15, no. 3, pp. 291-314
Matyas, L, Hornok, C & Pus, D 2012, ‟The formulation and estimation of random
effects panel data models of trade‟, MPRA paper 36789, University
Library of Munich, Munich.
Matyas, L, Konya, L, Harris MN 1997,‟Modelling export activity in a multicountry economic area: the APEC case‟, Monash Econometrics and Business Statistics Working Paper, January 1997.
Montanari, M 2005, „EU trade with Balkans: large room for growth‟, Eastern European Economics, vol.43, no. 1, pp. 59-81.
Nissinen, A, Parikka, AK & Rita, H 2009, 'Environmental criteria in the public purchases above the EU threshold values by three Nordic countries: 2003
and 2005', Ecological Economics, vol. 68, no. 6, pp. 183-184.
Oktaviani, R & Novianti, T 2009, „International trade theory and its application in Indonesia‟, IPB Press, Bogor.
Porter, M 1998,'Competitive Advantage of Nations',Free Press, New York. Rahman, M 2003,‟A panel data analysis of Bangladesh‟s trade: the gravity model
Rendra, A, Pelkmans, J, Schrefler, L & Busse, M 2014, 'The EU Furniture Market
Situation and A Possible Furniture ProductsInitiative', the European
Commission, Brussels.
Robb, D & Xie, B 2003, 'A Survey of Manufacturing Strategy and Technology in
the Chinese Furniture Industry', European Management Journal, vol. 21,
no. 4, pp. 484-496.
Salzman, J 1997, 'Informing the Green Consumer: The Debate Over the Use and Abuse of Environmental Labels', Journal of Industrial Ecology, vol. 1, no. 2, pp. 11-21.
Schwab, K 2009, 'The Global Competitiveness Report 2009-2010', World
Economic Forum, Geneva, Switzerland.
Sianturi, A & Subarudi 2008, „Strengthening the capacity to promote efficient
wood processing Technologies in Indonesia‟, Indonesian sawmill and
woodworking association (ISWA), no. 8, pp. 4-60.
Siregar, H & Sinaga, RH 2010, „The competitiveness of Indonesian palm-oil in the China market‟, Agrimedia Journal, vol. 11, no.2, pp. 57-67
Song, M & Gazo, R 2013, „Competitiveness of US household and office furniture industry‟, International Journal and Management Engineering (IJEME), vol. 3, no. 2, pp. 47-55.
Sun, N 2011, 'Transformation from Comparative Advantage to Competitive Advantage: A Way to Improve Regional Agricultural Competitiveness', vol. 3, no. 4, pp. 20-35
Thornton, J and Goglio, A 2002, „Regional bias and intra-regional trade in Southeast Asia‟, Applied Economics Letters, vol. 9, no. 4, pp. 8-205. Tinbergen, J 1962, 'Shaping the World Economy: Suggestions for an International
Economic Policy', New York
[TREDA] Trade Research & Development Agency 2008, 'Indonesian Furniture: Creativity in Woods', vol. 1, Ministry of Trade, Indonesia.
UN COMTRADE 2015, ‟United Nation Commodity Trade Statistics Database‟,
<http://www.trademap.org/>viewed, 20 October 2015.
World Bank 2015, „World Bank Economic Database‟, <http://www.worldbank.org>, viewed, 5 Oktober 2015
You, Q 2007,‟World furniture trade up 100 billion US Dollar in 2007‟, Furniture Market, vol.8 no.55, pp. 13-33.
Yu, R, Cai, J, Loke, M & Leung, P 2010, 'Assessing the comparative advantage of Hawaii‟s agricultural exports to the US mainland market', The Annuals of Regional Science, vol. 45, no. 2, pp. 473-485.
APPENDICES
Appendix 1. Hausman Test (HS 9403)
Coefficients
(b) (B) (b-B) Sqrt(diag(V_b-V_B))
fe re Difference S.E. lngdp_eu 0.2155763 0.2990135 -0.0834372 .
lnrer 0.8930199 0.2048013 0.6882186 0.7789382
lnpop_eu 0.7632032 0.8595581 -0.0963549 .
eco -0.2614566 -0.1275462 -0.1339104 .
itpc -0.5798299 -0.4868773 -0.0929526 .
year2001 0.1407095 0.1763014 -0.0355918 .
year2002 0.3944339 0.3177391 0.0766947 .
year2003 0.3531476 0.2636108 0.0895368 .
year2004 0.9887785 0.9298314 0.0589472 .
year2005 0.8523968 0.4828736 0.3695233 .
year2006 1.062831 0.5505068 0.5123239 .
year2007 1.077984 0.565344 0.5126402 .
year2008 1.13204 0.5801998 0.5518402 .
year2009 0.7868478 0.1752359 0.6116119 .
year2010 0.7757192 -0.0554541 0.8311732 .
year2011 0.4080226 -0.4462033 0.854226 .
year2012 0.1742885 -0.7086949 0.8829834 0.0141414
year2013 0.0903038 -0.7581839 0.8484877 .
year2014 0.2843247 -0.5485528 0.8328775 . b = consistent under Ho and Ha; obtained from xtreg
B = inconsistent under Ha, efficient under Ho; obtained from xtreg Test: Ho: difference in coefficients not systematic
chi2(20) = (b-B)'[(V_b-V_B)^(-1)](b-B)
= 71.71
Prob>chi2 = 0.0000
Appendix 2. Fixed Effect estimation using robust
Variable ols_robust fe_robust re_robust lngdp_eu 0.3551801*** 0.21557633*** 0.29901349***
lnrer 0.21448826*** 0.89301988 0.20480132
lnpop_eu 0.79546948*** 0.76319023*** 0.85955812**
lndist -0.23713306 (omitted) -0.50801693
eco 0.41324336 -0.26145661 -0.12754617
itpc 0.01499059 -0.57982992 -0.48687735
year2001 0.14062052 0.14070954 0.17630136
year2002 0.28192866 0.39443385 0.31773913
year2003 0.22614809 0.35314759 0.26361083
year2004 0.88941095 0.98877851 0.92983136
year2005 -0.06844555 0.85239683* 0.48287358
year2006 -0.02063707 1.0628307* 0.5505068
year2007 -0.02751129 1.0779842** 0.56534404*
year2008 -0.1445024 1.13204* 0.58019979
year2009 -0.54559257 0.78684776 0.17523587
year2010 -1.0155116* 0.77571915 -0.05545406
year2011 -1.4071693** 0.40802265 -0.44620333
year2012 -1.6692216** 0.17428854 -0.70869489
year2013 -1.7196067*** 0.09030378 -0.75818393*
year2014 -1.5112676** 0.28432469 -0.5485528
Appendix 3. Estimation result for furniture made of wood
Variable PLS FE RE
lngdp_eu 0.35917413*** 0.20051872*** 0.29004634***
lnrer 0.24957753*** 3.1575408*** 0.25073771*
lnpop_eu 0.77634596*** 1.442437*** 0.92436366***
lndist 4.6910945*** (omitted) 7.7037681*
eco 0.37227703 -0.53636729* -0.39166989
itpc -0.03896621 0.82937496 0.73467689*
year2001 0.53642471 0.33257549 0.59664565
year2002 0.72939399 0.91741523** 0.79129658*
year2003 0.66123791 0.77950518* 0.72450054*
year2004 1.1926189* 1.0487158** 1.2579552***
year2005 0.09078143 0.90529674** 0.76219857*
year2006 0.17853628 1.4669509*** 0.87882205*
year2007 0.28612304 1.4545237*** 1.0149512**
year2008 0.13811142 1.3422919*** 1.0273114**
year2009 -0.29492822 1.0517212** 0.58983872
year2010 -0.85464055 1.5070224*** 0.370838
year2011 -1.5365557** 0.85755275* -0.3100022
year2012 -1.4817836** 0.99094738* -0.25553956
year2013 -1.4335227** 0.81126873* -0.2074375
year2014 -1.1935242* 0.89474957* 0.03318517
cons -52.831259*** 152.35875*** -81.689652* legend: * p<0.05; ** p<0.01; *** p<0.001
Appendix 4. Estimation result for furniture made of metal
Variable ols fe re
lngdp_eu 0.24339669*** -0.08860876 0.0775499
lnrer 0.19442314* -4.1693579 0.08619059
lnpop_eu 1.2272009*** -22.165659*** 1.6084071***
lndist 8.3592396** (omitted) -1.2872772
eco 2.6791413*** 1.0960164 1.7291873**
itpc 0.60325476 1.3004466 0.67944517
year2001 -1.2015358 -0.60686973 -1.150825
year2002 -1.6867381 -1.5904737* -1.6460473
year2003 -1.0115048 -0.68088636 -0.96358223
year2004 -0.69697811 0.16984283 -0.6326306
year2005 -1.8401729 0.85954343 -0.60231039
year2006 -2.0523809 0.20861644 -0.77494684
year2007 -1.4877109 1.2173176 -0.14889998
year2008 -2.6860842* 0.86928331 -1.0346645
year2009 -2.6578735* 0.76739425 -1.0217124
year2010 -2.8397241* 0.44119951 -0.80116576
year2011 -2.4652775* 0.83672385 -0.42467473
year2012 -1.827988 1.396369 0.20927323
year2013 -1.5407934 2.1061295* 0.5055949
year2014 -2.0784866 1.8962112 -0.02369147
cons -96.96501*** 389.07537*** -140.73829* legend: * p<0.05; ** p<0.01; *** p<0.001
Appendix 5. Estimation result for furniture made of plastic
Variable ols fe re
lngdp_eu 0.20223071** 0.14630638* 0.00574168
lnrer 0.17300379 -2.6097789 0.09953392
lnpop_eu 1.2721283*** -16.731173*** 1.5770065***
lndist 6.258069* (omitted) -1.1037044
eco 1.3146674* 0.97005443 1.2715069*
itpc -0.1356912 -1.689633* 1.2623703
year2001 -1.2029011 -0.94993129 -1.2825892
year2002 -1.0861827 -1.1417293 -1.1702602
year2003 -0.53765505 -0.43135072 -0.61443773
year2004 -0.85018011 -0.38743326 -0.91230976
year2005 -0.22119583* -0.10283274 -0.11558737
year2006 -0.12017372 0.65693125 -0.10474105
year2007 0.15128068 0.36831375 0.26653622
year2008 0.31909504** 0.60193854 0.46304423
year2009 0.21670495* 0.49134861 0.35904603
year2010 0.13509427 0.37166725 0.27816292
year2011 0.24570837* 0.48433399 0.38908665
year2012 0.35531205** 0.58927115 0.49843355
year2013 0.16185384 0.42340854 0.30561767
year2014 0.25130747* 0.53461273 0.39577141
cons -79.601663** 290.67853*** -124.09523* legend: * p<0.05; ** p<0.01; *** p<0.001
BIOGRAPHY