Trop. For. Manage. J. XII (2) : 36-43 (2006)
MAPPING VEGETATION COVER IN MOUNTAINOUS AREA
WITH LINEAR MIXTURE MODELING OF IKONOS SATELLITE
IMAGE: A case study in Pangalengan, West Java, Indonesia
Pemetaan tutupan vegetasi di area pegunungan dengan pemodelan
campuran linier dari citra satelit IKONOS: Studi kasus di Pangalengan,
Jawa Barat
KETUT WIKANTIKA1)
ABSTRAK
Tujuan studi untuk mengidentifikasi tutupan vegetasi di area pegunungan menggunakan pemodelan campuran linier (linear mixture modeling). Studi mengkombinasikan data reflektansi spektral yang diukur dari fotometer tipe 2703 dengan citra satelit resolusi spasial sangat tinggi yaitu IKONOS. Ada empat tahapan yang dilakukan dalam menganalisis efek topografis (area pegunungan) dalam pengolahan citra dan masalah campuran piksel dalam mengestimasi fitur sayur mayur termasuk teh. Pertama, citra IKONOS dikoreksi dengan cara menormalisasi nilai kecerahan sehingga efek topografisnya dapat direduksi. Tahap kedua mencakup analisis karakteristik reflektansi spektral yang diperoleh dari survei lapangan dan hubungannya dengan citra satelit. Tahap ketiga mendefinisikan jumlah end-member yang digunakan dalam pemodelan campuran (mixture modeling). Akhirnya, fraksi citra teh dinilai dengan hasil klasifikasi metode tak terbimbing (unsupervised). Hasil studi mengindikasi pemodelan campuran dapat digunakan untuk mengidentifikasi teh dalam piksel campuran dengan lebih baik dibandingkan metode klasifikasi tradisional.
Kata kunci : pemetaan, tutupan vegetasi, area pegunungan, pemodelan campuran linier, citra IKONOS
INTRODUCTION
The linear mixture model is developed based on a system of inverting linear equations and is calibrated using spectral responses from pure ground classes, usually known as end-members (Theseira and Thomas, 2002). The model assumes that the signal received at the sensor is the linear sum of the reflectance measurements of the ground components weighted by their relative proportions. Linear mixture modeling has been applied by some researchers for tropical forest classification (Cross et al., 1991), detection
1)
of inland tropical waters (Novo and Shimabukuro, 1994), minerals, grasslands, arid environments and land cover mapping (Bryant, 1996; Jacobsen et al., 1998; McGwire et al., 2000; Stefanov et al., 2001; Foody and Cox, 1994; Adams et al., 1995; Atkinson et al.; 1997; Verhoeye and De Wulf, 2002) and agricultural landscape monitoring (Theseira and Thomas, 2002). Their studies predominantly used medium spatial resolution remotely sensed data.
This study combines spectral reflectance data measured with portable photometer type 2703 and very high spatial resolution IKONOS satellite image to evaluate the role of linear mixture model to identify vegetation cover (tea field) in part of Margamekar village, Pangalengan, West Java, Indonesia.
STUDY AREA
This study was examined in mountainous area of Margamekar village, in the southern part of Bandung, West Java, Indonesia, located between longitudes 107o 25’ and 107o 40’ E and latitudes 7o 5’ and 7o 20’ S, having areas of approximately 1176 hectares. The topography of the area is ranging from flat mountainous (38%), while the elevation varies from 1365 m to 1550 m above mean sea level (Data Monografi, 2001). Land cover types are dominated by tea plantation, vegetable and residential. Tea is one of major plantation product produced in this area throughout the year.
SATELLITE AND GEOGRAPHIC DATA
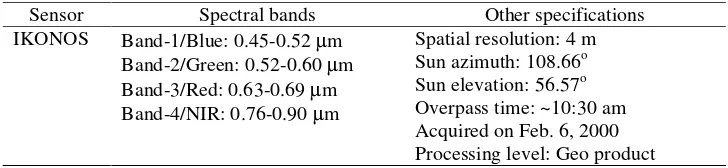
The IKONOS satellite image is main data used in the study (Table 1). Other supporting geographic data used are administrative boundary and digital elevation model (DEM). IKONOS image was recorded in February 2000 at the season when most of the area is being covered by mature cabbage and ready to be harvested.
Table 1. IKONOS data specifications
Sensor Spectral bands Other specifications
IKONOS Band-1/Blue: 0.45-0.52 µm
Band-2/Green: 0.52-0.60 µm Band-3/Red: 0.63-0.69 µm Band-4/NIR: 0.76-0.90 µm
METHODS
Pre processing image
Pre processing image focuses on geometric correction and topographic normalization. The IKONOS image was projected onto universal transverse mercator (UTM) with WGS 84 datum. To minimize the effect of illumination differences on the surface reflectance in mountainous areas, spectral bands were normalized using normalized brightness equation (Colby, 1991). This equation needs the information of sun azimuth and elevation at the time of image acquisition, DEM and original image.
Spectral reflectance measurement
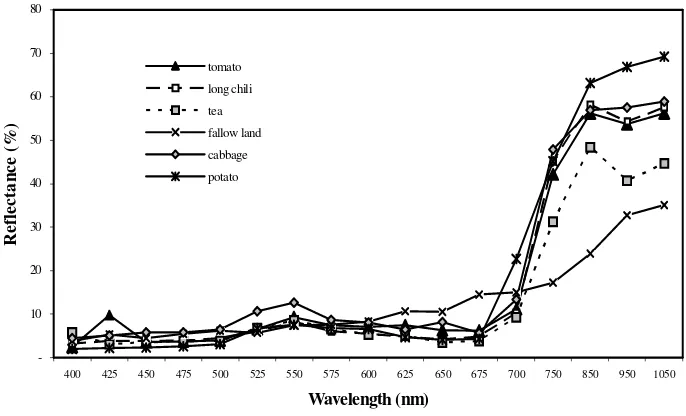
In this study, characteristics of spectral reflectance of land cover such as vegetables, tea plantation and fallow land were measured using portable photometer type 2703. The objective of this work is to support determination of pure pixel of tea field in the IKONOS image. Several measurements were conducted while each measurement collected twice observations and afterwards the average observation was calculated. Figure 1 shows characteristics of spectral reflectance profiles for tomato, long chili, tea plantation, fallow land, cabbage and potato. These spectral reflectance profiles correspond to the spectral signatures extracted from IKONOS image.
400 425 450 475 500 525 550 575 600 625 650 675 700 750 850 950 1050
End-members collection and its signature separability analysis
An end-member is the set of data values defining one component in a mixture. In remote sensing a spectral end-member is the spectral signature of a ground component such as green vegetation, soil or rock. The result of spectral reflectance measurement (see section 4.2) provides guidance to extract end-members from IKONOS image. The number of spectra taken from the image for each end-member class was assigned according to the total class proportions occurring within the ground data segments. Tea has a larger number of spectra extracted from the image than others in order to characterize that class. In this study, four end-members were extracted from the image, i.e. cabbage (30 signatures), tea (45), residential (28), and water (15). Each spectral signature is the mean of nine pixels. It means one signature equivalent to 12 m by 12m (1 pixel = 4 m x 4m).
As end-members are assumed to be spectrally distinctive, therefore to test whether collected end-members fulfil this assumption, one of a statistical measure of the distance between two signatures is applied that is Jeffries-Matusita (JM) distance. The JM distance is related to the pairwise probability of error, which is the probability that a pixel assigned to class i is actually class j (Andersen, 1998). The JM distance ranges between 0 and 1414. Almost all end-members are reasonably spectrally distinctive having JM distance measurements at a total signature separability value of 1414, except for residential and water (JM of 1413).
Implementation of linear mixture modeling
Linear mixture modeling may be presented as a linear combination of end-members, as follows;
2
Variations in topography have variations in illumination, which may influence land cover and land use patterns. In this study, the study area was corrected by dividing the original image with cosine of the incidence angle. However, three parts of mountain ridges over the study area provide different brightness value before and after correction.
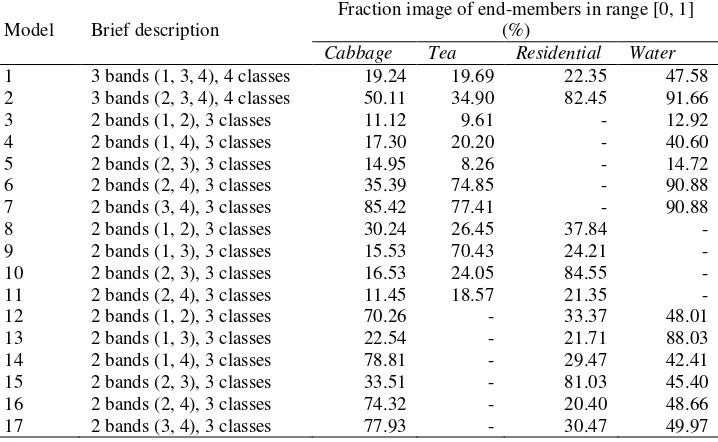
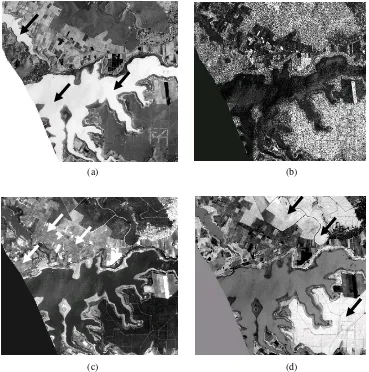
According to Table 2 models 2, 6, 7, 12, 14, 16 and 17 have better proportion image than other models. All fraction images of model 7 is more than 75%. In addition, model 7 has lower RMS error image compared to other RMS error images. Therefore linear mixture modeling with band 3 and 4 of IKONOS image with end-members of cabbage, tea and water is most appropriate model compared to use other combined bands and end-members. Figure 2 shows part of fraction images for cabbage, tea, water and error image, respectively. Generally, it can be differentiated clearly between each other. The error image obviously shows that the error is relatively homogeneously distributed.
Table 2. Analysis of fraction images in several models
Fraction image of end-members in range [0, 1] (%)
Model Brief description
Cabbage Tea Residential Water
Note: models with all end-members have fraction image less than 10% are not listed.
Fig 2. Fraction images: (a). Cabbage (b). Tea (c). Water. (d). Error image
(a) (b)
CONCLUSIONS
This study has demonstrated use of linear mixture modeling of IKONOS image to identify tea field in mountainous area in Pangalengan, West Java, Indonesia. The following conclusions can be drawn from the analysis carried out in this study.
Spectral characteristics as well as the growth rates are the dominant causes of uncertainty in interpreting the image data. Therefore other information such spectral reflectance of land cover supports interpreter to determine pure pixels of end-members, which are used in linear mixture modeling.
Linear mixture modeling approach to data interpretation is applicable to multispectral data of tea field identification in general. The accuracy of the spectral mixture modeling result has also been assessed using GPS point data. The validation showed that linear mixture modeling has classification accuracy of 88,5%. It should be concluded that linear mixture modeling approach has better classification accuracy than using traditional classification system, which only provides classification accuracy of 77.2%.
REFERENCES
Adams, J.B., Sabol, D.E., Kapos, V., Filho, R.A., Roberts, D.A., Smith, M.O., Gillespie, A.R., 1995. Classification of multispectral images based on fractions of end-members: application to land cover change in the Brazilian amazon. Remote Sens. Environ., 52, 137-154.
Andersen, G.L., 1998. Classification and estimation of forest and vegetation variables in optical high resolution satellites: a review of methodologies. Work of the Int. Inst. for Applied Systems Analysis, Austria, 1-20.
Atkinson, P.M., Cutler, M.E.J., Lewis, H., 1997. Mapping subpixel proportional land cover with AVHRR imagery. Int. J. Remote Sens., 18(4), 917-935.
Baban, S.M.J. Luke, C., 2000. Mapping agricultural land use using retrospective ground referenced data, satellite sensor imagery and GIS. Int. J. Remote Sens., 21(8), 1757-1762.
Bryant, R.G., 1996. Validated linear mixture modeling of Landsat TM data for mapping evaporite minerals on a playa surface: methods and applications. Int. J. Remote Sens., 17(2), 315-330.
Colby, D., 1991. Topographic normalization in mountainous terrain. Photo. Eng. and Remote Sens., 57(5), 531-537.
Cross, A.M., Settle, J.J., Drake, N.A., and Paivinen, R.T.M., 1991. Subpixel measurement of tropical forest cover using AVHRR data. Int. J. Remote Sens., 12(5), 1119-1129. Foody, G.M. and Cox, D.P., 1994. Subpixel land cover composition estimation using a
Jacobsen, A., Heidebrecht, K.B., and Nielsen, A.A., 1998. Monitoring grasslands using convex geometry and partial unmixing-a case study. 1st EARSEL Workshop on Imaging Spectroscopy, Switzerland, 309-316.
McGwire, K., Minor, T., and Fenstermaker, L., 2000. Hyperspectral mixture modeling for quantifying sparse vegetation cover in arid environments. Remote Sens. Environ., 72, 360-374.
Metternicht, G.I., Fermont, A., 1998. Estimation erosion surface features by linear mixture modeling. Remote Sens. Environ., 64, 254-265.
Novo, E.M. and Shimabukuro, Y.E., 1994. Spectral mixture analysis of inland tropical waters. Int. J. Remote Sens., 15(6), 1351-1356.
Stefanov, W.L., Ramsey, M.S., and Christensen, P.R., 2001. Monitoring urban land cover change: an expert system approach to land cover classification of semiarid to arid urban centers. Remote Sens. Environ., 77, 173-185.
Theseira, M.A. and Thomas, G., 2002. An evaluation of a multiple end-member spectral mixture model applied to an agricultural landscape in England. Cranfield University, The United Kingdom, 18 pp.
Verhoeye, J. and De Wulf, R., 2002. Land cover mapping at subpixel scales using linear optimization techniques. Remote Sens. Environ., 79, 96-104.