CHAPTER III
RESEARCH METHODOLOGY
This chapter presents the methodology and procedure, which are taken in this
study in order to find out the answer from research question. This chapter contains
research design, population and sample, research hypothesis, data collection,
trying out the instruments, and data analysis.
3.1 Research Design
A quantitative approach and descriptive method are used in this study
since the main purpose of this study is to find out whether there is any correlation
between students’ frequency in playing role-playing game and students’ reading comprehension of narrative text.
Quantitative approach is employed since this research defines the research
questions based on the trends in the field of research site. As described by
Creswell (2012, p. 13) quantitative approach is applied if the researchers want to
identify a research problem based on trends in the field or on the need to explain
why something happens. In addition, Creswell (2012) states that descriptive
method is used when the study is aimed to explain the overall tendency based on
the data collected. Based on the above- mentioned theories, this research employs
quantitative approach and descriptive method.
Correlation research design is used in this study in order to find out the
tendency of relation between students’ frequency in playing role-playing game and their reading comprehensio n in narrative text. Creswell (2012, p. 338) states
that correlation is a statistical test to determine the tendency or pattern between
two variables or two sets of data to vary consistently. The result of the correlation
between the two variables is categorized into form of the coefficient correlation.
As stated by Creswell (2012), researchers in correlation research design applies
Based on the title of this research “The Correlation of Playing Role-Playing Games and Students’ Reading Comprehension of Narrative text”. The research is stated as follows for two sets of data:
Figure 3.1 Illustration of Correlation cited from Sugiyono (2002, in Mayningsih,
2009, p.42)
The correlation of the two variables can be illustrated in the figure below.
X: the result of students’ frequency in playing role-playing game
Y: the result of students’ Reading comprehension test of narrative text
3.2 Population and Sample
3.2.1 Population
A population is a group of individuals who have the same characteristics
(Creswell, 2012, p. 142). Arikunto (2007) states that population is the whole
subject of the research. Population in this research is the third grade of one junior
High School in Bandung. This population is selected since the students in this
grade have studied the topic of narrative text in academic skill.
3.2.2 Sample
This study uses probability sampling with stratified sampling. Probability
sampling is used in order to select individuals from the population who are
representative of the population (Creswell, 2012, p. 142) and stratified sampling is
used to divide (stratify) the population based on the specific characteristics
(Creswell, 2012, p. 144).
Based on the theories above, the sample in this paper is chosen by the
specific characteristics. 30 students who have played role-playing games are
selected for the sample. The total of 30 participants are required since it is the
minimum requirement for the participant in correlation research. In line with
Creswell (2012) and Frankeal et al (2012) the number of 30 participants has to be
fulfilled in a correlation research.
3.3 Research Hypothesis
Hypothesis is the prediction toward the relationship between two variables
(Arikunto, 2007). There are two types of the hypothesis; hypothesis null and
hypothesis alternative (Weaver, 2005). Furthermore, Weaver states that
Alternative Hypothesis (Ha) prevails when there is relation between the
phenomena under investigation and hypothesis null (H0) prevails if there is no
relation between the phenomena under investigation.
Accordingly, the alternative hypothesis is accepted and hypothesis null is
rejected if there is correlation between students’ frequency in playing role-playing games with their reading comprehension of narrative text.
3.4 Data Collection
3.4.1 Research Instrument
Research instrument is a tool to help the researcher in collecting data
(Arikunto, 2007, p. 134). Creswell (2012, p. 151) describes an instrument as a tool
for measuring, observing, or documenting quantitative data. In addition, Fraenkel
et al (2012, p. 111) determine research instrument as the whole process of
preparing to collect the data. There are two types of instruments; non-test
instrument (Questioner, Check list, interview, scale, and survey) and test
instrument (Achievement test) (Arikunto, 2007, p. 167).
In order to collect the data from the participants, this study employs Likert
scale (non-test instrument) and achievement test (test instrument) as
Data-Collection Instrument. Rating scale is used to measure judgment of behavior and
achievement test is used to measure knowledge or skill in a given subject
(Fraenkel et al, 2012).
There are two instruments that are used in this paper: Likert scale and
Likert scale
For measuring the x variable (students’ frequency of playing role-playing game), this research applies attitude scale which is Likert scale. Fraenkel et al
(2012) describe likert scale as follow:
A self-reporting instrument in which an individual responds to a series of statements by indicating the extent of agreement. Each choice is given a numerical value, and the total score is presumed to indicate the attitude or belief in question.
In addition, Fraenkel et al (2012) state that attitude scales are often similar
to rating scales in form, with words and numbers placed on a continuum. Subjects
circle the word or number that best represents how they feel about the topics
included in the questions or statements in the scale. Usually, likert scale adapts
five numerical values to indicate the attitude of the participants (Fraenkel et al,
2012). Since the middle numerical value of the scale (3) represented undecided
classification, this research applies only four numerical values in order to classify
the answer of participants’ more precisely.
The function of Likert scale in this research is to classify the participants
based on their frequency in playing role-playing game. It is specifically counted in
how many hours per week they play it. The frequency score is then used for the x
variable score. The x score classification can be seen below:
Table 3.1 Classification of students’ frequency in playing Role-Playing games
Frequency range Classification Numerical value
1 – 3 hours per week Rarely 1
3 – 6 hours per week Once a while 2
9 – 12 hour per week Often 3
12 – 15 hours per week Extremely often 4
Reading comprehension test of narrative text
For measuring the y variable (students’ score in reading comprehension of narrative text), participants’ were given reading comprehension test, which contains 18 item questions of narrative text comprehension. The test is taken from
“Contextual Teaching and Learning: BSE (Buku Sekolah Elektronik) Sekolah Menengah Pertama, Kelas 9 (2008). It was chosen because the book is
standardized by Departemen Pendidikan Nasional and it is suitab le for the
participants which are third grade of junior high school (ninth grade).
The questions were selected by considering the features of reading
comprehension of narrative text; find the information related to the text. For
scoring the test, the right answer is given 1 (one) point while the wrong answer is
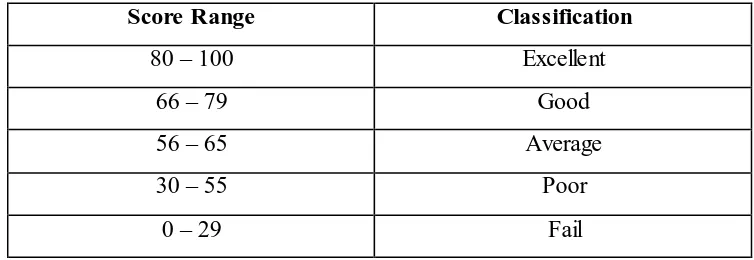
given 0 (nil) point. Subsequently, the total 100 points were given for the
participants if they answer all of the questions rightly. The total points of the right
answers are then calculated into Sformula below
participants’ reading comprehension (Arikunto, 2003 in Furqon, 2012, p. 21). It is shown in Table 3.1
Table 3.2 Classification of students’ achievement
3.4.2 Research Procedures
Here are the procedures in collecting the data for this research:
Preparing research instruments; Likert scale (attitude / rating scale) and reading Comprehension test of narrative text (achievement test)
Trying out the two research instruments to the participants for checking the validity, reliability, difficulty index (only for instrument 2), and discrimination
index (only for instrument 2) of the text.
Giving the real test (Likert scale and Reading comprehension test of narrative text) to the participants
Scoring the participants’ result on two instruments.
Classifying the participants’ scores on two administered instruments.
Calculating the correlation between the two test results using Pearson Product Moment formula (if the data is normally distributed) or Spearman formula (if
the data is not normally distributed) employing SPSS software.
Analyzing the result through the relevant theories and drawing a conclus ion of this research.
The procedure above had to be taken carefully step-by-step to prevent
errors during the research. Moreover, the explanation about the procedure is
clearly presented in the next parts.
3.4.3 Trying Out Research Instruments
An instrument can be defined as a tool for collecting data if it meets a
demand for minimum two criteria: validity and reliability (Arikunto, 2007, p. 167).
The instrument 1 was created by the researcher and instrument 2 was taken from
“Contextual Teaching and Learning: BSE (Buku Sekolah Elektronik) Sekolah
Menengah Pertama, Kelas 9” (2008). Both of the instruments are tried out for the validity and reliability. In addition, the discrimination power index and difficulty
level of the items in the instrument 2 were also measured. The explanation for
3.4.3.1 Instrument 1
3.4.3.1.1 Validity and Reliability
As stated before, an instrument can be defined as a tool for collecting data
if it meets a demand for minimum two criteria: validity and reliability (Arikunto,
2007, p. 167). However, the purpose of trying out non-test instrument (Questioner,
Check list, interview, scale, and survey) is not to find out the validity of the
instrument itself. Based on Arikunto (2012, p. 178), there are three purposes of
trying out non-test instrument:
1. To find out the participants’ understanding about the instrument.
2. To find out the precision of the instrument and the possibilities of
instrument weaknesses.
3. To find out the reliability of the instrument.
Since non-test instrument is created based on the variable, it is supposed to
have valid criteria (Arikunto, 2012, p. 178). In this research, the variable is
defined based on attitude variable, which means in how many hours per week
participants play role-playing video games. Another variables to find out the
participants’ interest were added. Interest instrument was used to measure the
participants’ interest towards something without an act while attitude instrument was following with act (Arikunto, 2012, p. 199). In addition, a statement that is
participants (15 minimum participants). Afterward, the participants were asked
the same question that they have answered in the instrument. This method is
3.4.3.2 Instrument 2
3.4.3.2.1 Validity
Arikunto (2007, p. 170) states that a test instrument can be categorized as
a valid instrument if it can measure what it is supposed to be measured. In order
to find out the validity of the test instrument, each test items in the test instrument
was firstly tried out and result was computed with Pearson Product Moment
correlation. The formula is:
Where:
n = the total participants
r = correlation coefficient (per item)
x = participant’s score of the item test
y = participant’s score of the whole item test xy = the result of score x multiply with score y
x2 = square of score x
y2 = square of score y
(Kranzler and Moursund, 1999, p. 56)
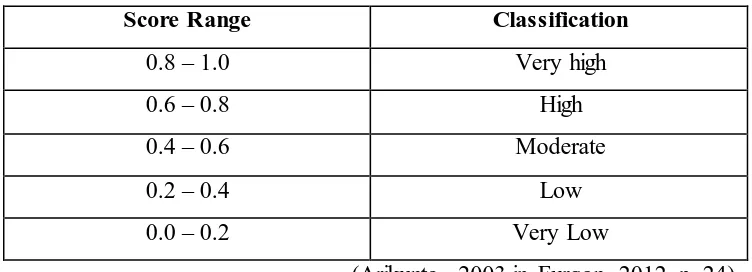
The result is then classified based on the r coefficient result (see table 3.2).
Table 3.2 r Coefficient Correlation (Validity)
Score Range Classification
0.8 – 1.0 Very high
0.6 – 0.8 High
0.4 – 0.6 Moderate
0.2 – 0.4 Low
0.0 – 0.2 Very Low
3.4.3.2.2 Reliability
Reliability is related with the consistency performance on the test
(Arikunto, 2007). It means that the data collected from the participants are
equivalent even it is taken in different time.
Based on Arikunto (2012, p. 168), There are three techniques that can be
chosen by the researcher to measure the reliability of test instrument; double test
double trial, single test double trial, or single test single trial.
Single test single trial method was applied in this paper for measuring
reliability of instrument 2. These are the stages to find out the reliability of the
instrument 2:
1. Try out the instrument to the participants
2. Give score for each participants
3. Categorize the score into 2 groups based on odd-even part, first-end part,
or random (odd-even is applied)
4. Give code x for first group and code y second group.
5. Calculate it with Pearson Product Moment correlation. The formula is:
Where:
n = the total participants
r = correlation coefficient (for the instrument)
x = participant’s score in first group
y = participant’s score in second group
xy = the result of score x multiply with score y
x2 = square of score x
y2 = square of score y
The result from Pearson formula is still a half of reliability of the test. To
find out the final score of the reliability of the test, the Spearman-Brown formula
is applied. The Formula is:
Where:
r11 : reliability coefficient
r1/21/2 : correlation coefficient for each half of the test item
r obtained (reliability score) was then compared with r critical that was
obtained from product moment r values (See appendix A.6). The result is
determined based on the following criteria.
If r obtained > r critical = valid
If r obtained < r critical = invalid
(Sugiyono, 2008 in Furqon, 2012, p. 26)
3.4.3.2.1 Difficulty Index
Difficulty index test is the test to measure the ability of the test instrument
to accommodate participants to answer the item of the instrument correctly
(Arikunto, 2012, p. 176). The formula to calculate the difficulty index is as
follow:
Where:
P = Facility/ index of difficulty (for each item)
B = the number of correct answer
J = the number of subject taking the test
(Arikunto, 2007, p. 176)
P = B/J
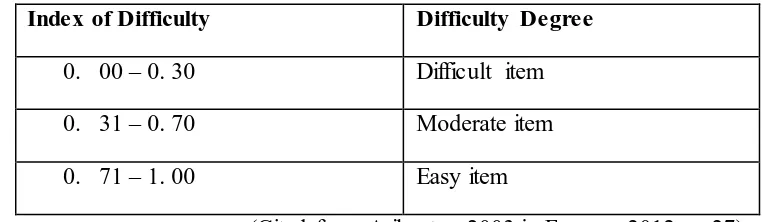
The finding result was then classified based on the degree of difficulties
for each items of the test. The classification is shown in the table 3.3 below.
Table 3.3 Criteria of Difficulty Index
Index of Difficulty Difficulty Degree
0. 00 – 0. 30 Difficult item
0. 31 – 0. 70 Moderate item
0. 71 – 1. 00 Easy item
(Cited from Arikunto, 2003 in Furqon, 2012, p. 27)
3.4.3.2.1 Discriminating Power Index
Discriminating power index test is the test to measure the quality of the
test instrument in discriminating between the skilled participants and less skilled
participants (Arikunto, 2012, p. 177). Moreover, to check the discrimination
power index, the participants must be in even number.
The formula to calculate the discrimination power index is as follow:
Where:
D = Discrimination power index (for each items)
BA = the number of participant in upper group answers correctly
JA = the number of participant in upper group
BB = the number of participant in lower group answers correctly
JB = the number of participant in lower group
(Arikunto, 2007, p. 177)
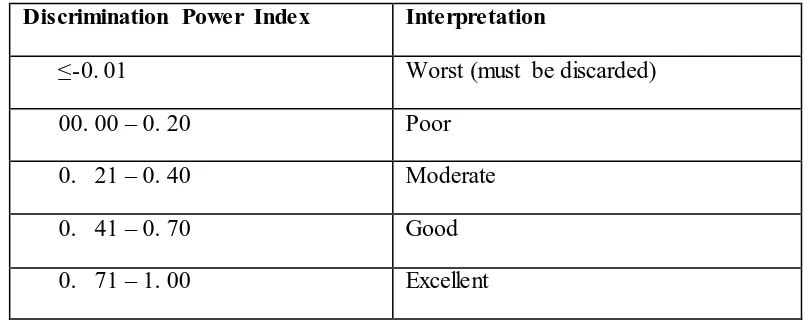
After finding the result of discrimination power index, the classification
should be applied as following criteria in the table below.
Table 3.4 Classification of Discrimination Power Index
Discrimination Power Index Interpretation
≤-0. 01 Worst (must be discarded)
00.00 – 0. 20 Poor
0. 21 – 0. 40 Moderate
0. 41 – 0. 70 Good
0. 71 – 1. 00 Excellent
(Cited from Arikunto, 2003 in Furqon, 2012, p. 24)
3.5 Data Analysis
The data were then analyzed through some steps. First, after the test was
implemented to participants, the analysis stated by scoring the result of the test.
Then, the process is finding the mean score of two variables. To find out the
mastery of two variables, calculating the mean of each variable is necessary. The
formula to compute the mean is as written below.
Where: MX = mean x (Frequency score in playing role-palying games)
∑X = the sum of x score
MY = mean y (Reading comprehension of narrative text score)
∑Y = the sum of y score
N = number of participant
(Cited from Kranzler and Moursund, 1999, p. 8)
Subsequently, the next step was checking whether the data are distributed
normally or not. In order to check it, this study utilized SPSS (Statistical Package
for Special Sciences) as it is one of the oldest and the most widely used statistical
software package. Pearson Product Moment correlation is used if the data are
distributed normally. The formula is
Where:
r = correlation coefficient
X = score of the first instrument
Y = score of the second instrument
XY = the result of score A multiple score B for each respondent
X2 = square of instrument 1
Y2 = square of instrument 1
(Cited from Kranzler and Moursund, 1999, p. 56)
If the data are not distributed normally, Spearman Brown Correlation
formula is applied. The formula is
rs= 1 - 6∑D2
n (n2 – 1)
Where:
D = the difference between each pair of ranks
D2 = the square of those differences
n = the number of pairs rankings
(Cited from Kranzler and Moursund, 1999, p. 131)
After obtaining the value r (degree of correlation), the result is interpreted
based on following criteria:
Table 3.5 Interpretation of Correlation Degree
Coefficient Interval
Interpretation
0. 20 – 0. 35 Slight relationship.
0. 66 – 0. 85 Strong (Good prediction can result from one variable to the other)
0. 86 and above Very strong relationship
(Cited from Creswelll, 2012, p. 347)
The next step was determining the correlation coefficient. The hypothesis
testing can be gained by seeing the significance value. If the significance value is
more than 0.05, then H0 is accepted and Ha is rejected. Contrariwise if the
significance value is less than 0.05, then H0 is rejected and Ha is accepted. The
significance value will appear after the calculation of correlation coefficient using
SPSS software.
The final steps was interpreting and discussing the findings that will be