AutoCAD® 2012
SHAWNA LOCKHART
2D Drawing • 3D Modeling
SDC
SDC
PUBLICATIONSwww.SDCpublications.com
Schroff Development Corporation
INTRODUCTION 59
2
Objectives
When you have com-pleted this tutorial, you will be able to
6. Use Dynamic View.
7. Draw ellipses.
BASIC CONSTRUCTION TECHNIQUES
Introduction
You usually create drawings by combining and modifying several different basic shapes called primitives, such as lines, circles, and arcs, to create more complex shapes. This tutorial will help you learn how to use the AutoCAD® software to draw some of the most common basic shapes. As you work through the tutorial, keep in mind that one of the advantages of using CAD over drawing on paper is that you are creating an accurate model of the drawing geometry. In Tutorial 3, you will learn to list information from the drawing database. Information extracted from the drawing is accurate only if you created the drawing accurately in the irst place.
Starting
Before you begin, launch the AutoCAD 2012 program.
If you need assistance, refer to Getting Started 1 and 2 of this guide.
Opening an Existing Drawing
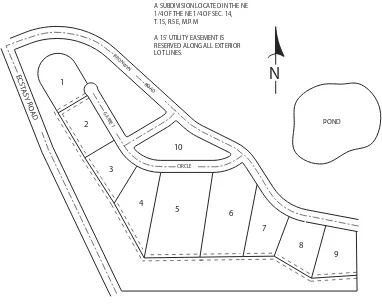
This tutorial shows you how to add arcs and circles to the subdivision drawing provided with the datailes that came with this guide. In Tuto-rial 3 you will inish the subdivision drawing so that the inal drawing will look like Figure 2.1.
Figure 2.1 A 15’ UTILITY EASEMENT IS
RESERVED ALONG ALL EXTERIOR LOT LINES. A SUBDIVISION LOCATED IN THE NE 1/4 OF THE NE 1/4 OF SEC. 14, T.1S, R.5E, M.P.M
To open an existing drawing, you use the Application icon, Open selec-tion or click the button that looks like an open folder from the Quick Access toolbar.
Click: Open button
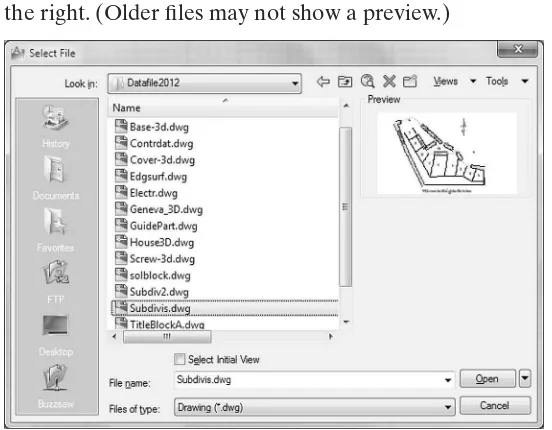
the location where your datailes have been stored. You should have already created a directory called c:\dataile2012, and copied all the datailes for this book into it. If you have not done so, you may want to review the Getting Started chapters. If the correct directory is not showing in the Look In box, use the Up One Level icon or expand the choices by clicking on the downward arrow for the Look In box. Use the scroll bars if necessary to scroll down the list of directories and open the appropriate one so the iles appear in the dialog box as in Figure 2.2. Scroll down the list of iles until you see the ile named subdivis. dwg. When you select a ile, a preview of the ile appears in the box to the right. (Older iles may not show a preview.)
Figure 2.2
Menu choices at the top right of the Select File dialog box let you select different views to be displayed in the ile list and other useful tools, such as a Find selection to search for iles.
Click: Tools, Find
Type: subdivis (in the Named area)
Click: Find Now button (from upper right of dialog box)
The Find dialog box displays the location for the ile named Subdivis. dwg, as shown in Figure 2.3. You can type in a portion of the name to match if you cannot remember the entire name or click the Date Modi-ied tab if you want to search by date and time the ile was created.
Tip: If you do not see a pre-view, pick Views from the dia-log box’s menu bar and make sure that Preview is checked.
Tip: Use the buttons at the left of the dialog box to show the
History (recently used iles), My
Documents folder contents, or Favorites you have added. To
add a favorite, ind the folder
SAVING AS A NEW FILE 61
Figure 2.3
Double-click: Subdivis.dwg (from the list at the bottom)
You return to the Select File dialog box.
Click: Open
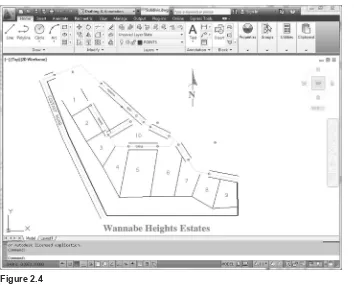
When you have opened the ile, it appears on your screen, as shown in Figure 2.4. Note that it opens with its own defaults for Grid, Snap, and other features. These settings are saved in the drawing ile. When you open a drawing, its own settings are used.
Figure 2.4
Saving as a New File
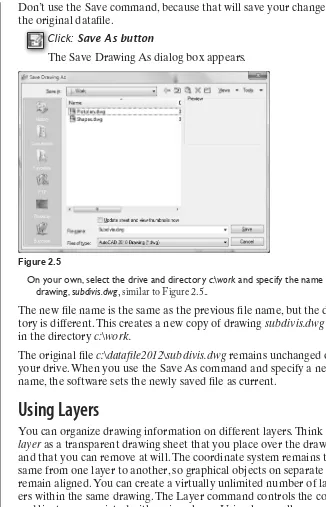
Don’t use the Save command, because that will save your changes into the original dataile.
Click: Save As button
The Save Drawing As dialog box appears.
Figure 2.5
On your own, select the drive and directory c:\work and specify the name for your drawing, subdivis.dwg, similar to Figure 2.5..
The new ile name is the same as the previous ile name, but the direc-tory is different. This creates a new copy of drawing subdivis.dwg saved in the directory c:\work.
The original ile c:\dataile2012\subdivis.dwg remains unchanged on your drive. When you use the Save As command and specify a new ile name, the software sets the newly saved ile as current.
Using Layers
You can organize drawing information on different layers. Think of a
layer as a transparent drawing sheet that you place over the drawing and that you can remove at will. The coordinate system remains the same from one layer to another, so graphical objects on separate layers remain aligned. You can create a virtually unlimited number of lay-ers within the same drawing. The Layer command controls the color and linetype associated with a given layer. Using layers allows you to overlay a base drawing with several different levels of detail (such as wiring or plumbing schematics over the base plan for a building). By using layers, you can also control which portions of a drawing are plotted, or remove dimensions or text from a drawing to make it easier to add or change objects. You can also lock layers, making them inac-cessible but still visible on the screen. You can’t change anything on a locked layer until you unlock it.
Current Layer
CONTROLLING LAYERS 63
If you do not create and use other layers, your drawing will be created on Layer 0. You used this layer when drawing the plot plan in Tutorial 1. Layer 0 is a special layer provided in the AutoCAD program. You cannot rename it or delete it from the list of layers. Layer 0 has special properties when used with the Block and Insert commands, which are covered in Tutorial 10.
Layer POINTS is the current layer in subdivis.dwg. There can be only one current layer at a time. The name of the current layer appears on the Layer toolbar.
Controlling Layers
The Layer Control feature on the Layers panel on the Home tab of the ribbon is an easy way to control the visibility of existing layers in your drawing. You will learn more about creating and using layers in this tutorial. For now, you will use layers that have already been created for you.
Click: on layer name POINTS from the Layers panel
The list of available layers pulls down, as shown in Figure 2.6. Notice the special layer 0 displayed near the top of the list.
Figure 2.6
Click: on the layer name CENTERLINE from the Layer Control list
It becomes the current layer shown on the toolbar. Any new objects will be created on this layer until you select a different current layer. The Layer Control now should look like Figure 2.7, showing the layer name CENTERLINE.
Figure 2.7
Use the Line command you learned in Tutorial 1 to draw a line off to the side of the subdivision drawing.
Note that it is green and has a centerline linetype (long dash, short dash, long dash). The line you drew is on Layer CENTERLINE.
Tip: On a black background, color 7 used for layer 0 appears as white; on a white back-ground it appears black.
Controlling Colors
Each layer has a color associated with it. Using different colors for dif-ferent layers helps you visually distinguish difdif-ferent information in the drawing. An object’s color also may control which pens are used during plotting.
There are two different ways of selecting the color for objects on your screen. The best way is usually to set the layer color and draw the objects on the appropriate layer. This method keeps your drawing organized. The other method is to use the Color Control feature on the Properties panel. To select the Color Control pull-down feature,
Click: ByLayer, from the Properties panel to pull down the Color
Control
Figure 2.8
Click to expand color choices
Note that the standard colors (yellow, red, green, blue, etc.) are shown. You can also choose Select Color to view the full color palette.
Click: Select Color
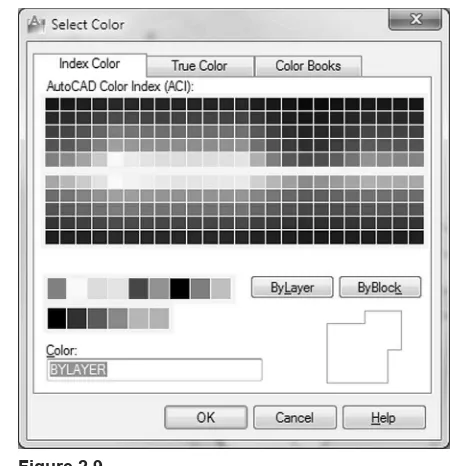
The Select Color dialog box shown in Figure 2.9 appears on your screen, giving you a full range of colors from which to choose.
Figure 2.9
The three tabs of the Select Color dialog box allow you to choose
LAYER VISIBILITY 65
among different methods to determine the color for your drawing entities. The True Color tab allows you to set color to either RGB, which stands for Red, Green, Blue, the primary colors of light, or HSL, which stands for the Hue, Saturation, and Luminance of the color. The Color Books tab lets you select from among different standard ink manufac-turer’s predeined colors so that you can match print colors very closely to the colors you choose on your screen. In this text you will use Index Color (AutoCAD Color Index) as the method for selecting color.
Make sure the Index Color tab is selected.
The default option for the Color (and also for the Linetype) command is BYLAYER. It’s the best selection because, when you draw a line, the color and linetype will be those of the current layer. Otherwise, the color in your drawing can become very confusing. You will click Cancel to exit the Select Color dialog box without making any changes. The colors for your new objects will continue to be determined by the layer on which they are created. Layers can have associated linetypes, as well as colors, as Layer CENTERLINE does.
Click: Cancel
Layer Visibility
One of the advantages of using layers in the drawing is that you can choose not to display selected layers. That way, if you want to create projection lines or even notes about the drawing, you can draw them on a layer that you will later turn off, so that it isn’t displayed or plot-ted. Or you may want to create a complex drawing with many layers, such as a building plan that contains the electrical plan on one layer and the mechanical plan on another, along with separate layers for the walls, windows, and so on. You can store all the information in a single drawing, and then plot different combinations of layers to create the electrical layout, irst-loor plan, and any other combination you want. Next, use the Layer Control to lock Layer POINTS, freeze Layer TEXT, and turn off Layer EXISTING_ROAD.
Click: on Layer CENTERLINE to show the list of layers
The list of layers pulls down. Refer to Figure 2.10 as you make the following selections.
Click: the On/Off icon, which looks like a lightbulb, to the left of
Layer EXISTING_ROAD
Click: any blank area of the screen away from the Layer list to
return to the drawing
Note that the blue roadway lines have been turned off so that they no longer appear. Invisible (off) layers are not printed or plotted, but objects on these layers are still part of the drawing.
Freezing Layers
Freezing a layer is similar to turning it off. You use the freeze option not only to make the layer disappear from the display, but also to cause it to be skipped when the drawing is regenerated. This feature can noticeably improve the speed with which the software regenerates a large drawing. You should not freeze the current layer because that would create a situation where you would be drawing objects that you couldn’t see on the screen. The icon for freezing and thawing layers looks like a snow-lake when frozen and a shining sun when thawed.
Click: to expand the Layer Control list
Click: the Freeze/Thaw icon to the left of Layer TEXT
Click: any blank area in the graphics window to return to the
drawing
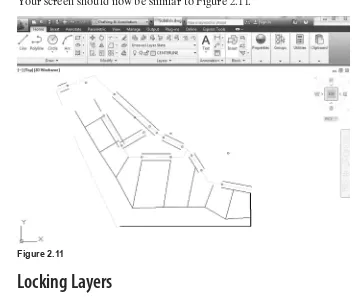
Layer TEXT is still on, but it is frozen and therefore invisible. A layer can both be turned off and frozen; the effect is similar. You should either freeze a layer or turn it off, but there is no point in doing both. Your screen should now be similar to Figure 2.11.
Figure 2.11
Locking Layers
You can see a locked layer on the screen, and you can add new objects to it. However, you can’t make changes to the new or old objects on that layer. This is useful when you need the layer for reference but do not want to change it. For example, you might want to move several items so that they line up with an object on the locked layer but prevent anything on the locked layer from moving. You will lock layer POINTS so that you cannot accidentally change the points already on the layer.
MAKING OBJECT’S LAYER CURRENT 67
Now, Layer CENTERLINE is the current layer. (If for some reason it is not the current layer, set it current at this time.) Layer TEXT is frozen and does not appear. Layer EXISTING_ROAD is turned off and does not appear. Layer POINTS is locked so that you can see and add to it, but not change it.
On your own, try erasing one of the circled points in the drawing.
A message appears, stating that the object is on a locked layer. The object won’t be erased.
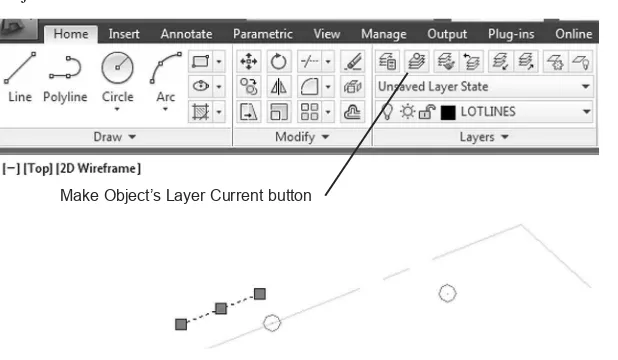
Making Object’s Layer Current
The Make Object’s Layer Current button is located above the Layer Control pull-down (Figure 2.11). This command lets you select an object and then click on the icon to make that object’s layer current.
Click: a black lot line (white if your background color is black),
representing a lot boundary
Note that the Layer Control now shows LOTLINES, the layer of the line you selected. This name is only temporary, for if you drew a new line, the layer name changes back to the current layer (CENTER-LINE). This is useful when you are unsure which layer a particular object is on.
Figure 2.12
Make Object’s Layer Current button
Next you will use the Make Object’s Layer Current button to set LOTLINES as the current layer.
Make sure a black lot line is still highlighted
Click: Make Object’s Layer Current icon
The current layer is changed to LOTLINES, and any new objects will be added to this layer. In the command prompt is the message: LOTLINES is now the current layer.
Now you will change the current layer back to CENTERLINE by using the Layer Previous button. If you are not sure which button to select, hover your mouse over the buttons to show the tooltips.
Click: Layer Previous button
Tip: You can resize the Layer
Properties Manager by drag -ging on its corners.
Tip: Locked layers appear transparent by default.
Using Layer
The Layer command lets you create new layers and control the color and linetype associated with a layer. You can also use Layer to control which layers are visible or plotted at any one time and to set the current layer. Remember, only one layer at a time can be current. New objects are created on the current layer. Use the Layer Properties Manager icon from the Layer panel to create new layers and set their properties. (Its command alias is LA.)
Click: Layer Properties Manager button
The Layer Properties Manager appears on the screen, showing the list of existing layers (Figure 2.13).
Figure 2.13
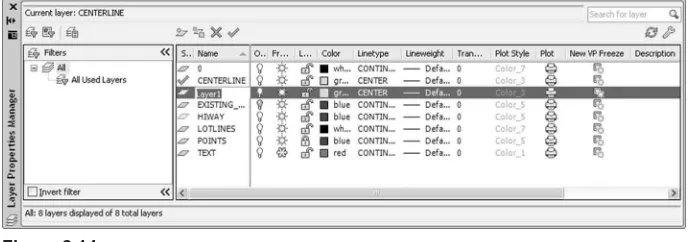
Notice that the layers you earlier turned off, locked, or froze are identi-ied with those icons. Next you will create a layer named EASEMENTS which you will use later in Tutorial 3. It will have a hidden linetype and the color cyan (a light blue shade)
Click: New Layer icon (located at the top middle of the dialog box)
A new layer appears with the default name Layer1, which should be highlighted as shown in Figure 2.14.
Figure 2.14
By default it has the same properties as the currently selected layer (CENTERLINE). You will change the layer name, color and linetype for the new layer next. Layer names can be as long as 255 characters. Layer names can contain almost any characters, except for restricted operating system characters like comma (,) and others like <>/”?:*|’=. Letters, numbers, spaces, and the characters dollar sign ($), period (.), number sign (#), underscore (_), and hyphen (-) are valid. While Layer1 is still highlighted,
Tip: You can right-click on a heading in the Layer Properties
Manager, and select Maximize
USING LAYER 69
Type: EASEMENTS [Enter]
Next, set the color for layer EASEMENTS. To the right of the layer names are the various layer controls mentioned previously. Each column title is labeled with the name of the function: On (light bulb), Freeze (sun), Lock/Unlock (lock), Color (small color box), Linetype, Lineweight, Plot Style, Plot, and Description. You can resize these col-umns to show more or less of the names by dragging the line between the name headings.
To change the color for layer EASEMENTS,
Click: on the Color column box corresponding to layer
EASEMENTS
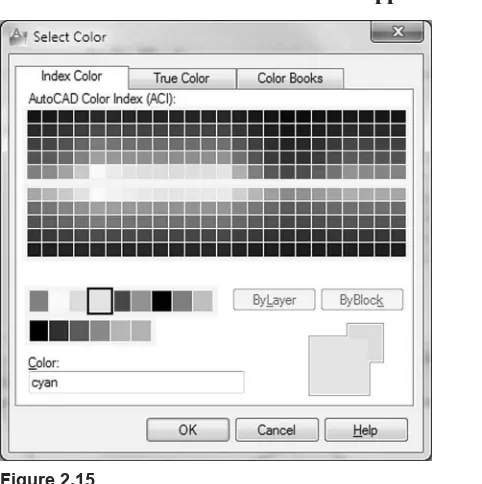
The Select Color dialog box containing color choices pops up on the screen as shown in Figure 2.15.
Make sure that the Index Color tab is uppermost.
Figure 2.15
Color in Layers
The Select Color dialog box allows you to specify the color for objects drawn on a layer. You will select the color cyan for the easement layer that you are creating. The color helps you visually distinguish linetypes and layers in drawings. You also use color to select the pen and pen width for your printer or plotter.
The Select Color dialog box has the choices BYLAYER and BY-BLOCK on the right side. As you are specifying the color for layer EASEMENTS only, you can’t select these choices, so they are shown grayed. Move the arrow cursor over the Standard Colors boxes, where cyan is the fourth color from the left.
Click: cyan from the Standard Colors boxes to the left of the
The name of the color that you have selected appears in the Color: box at the bottom of the screen. (If you select one of the standard colors, the name appears in the box; if you select one of the other 255 colors from the palette, the color number appears.)
Click: OK
Now the color for layer EASEMENTS is set to cyan. Check the listing of layer names and colors to verify that cyan has replaced green in the Color column to the right of the layer name EASEMENTS.
Linetype in Layers
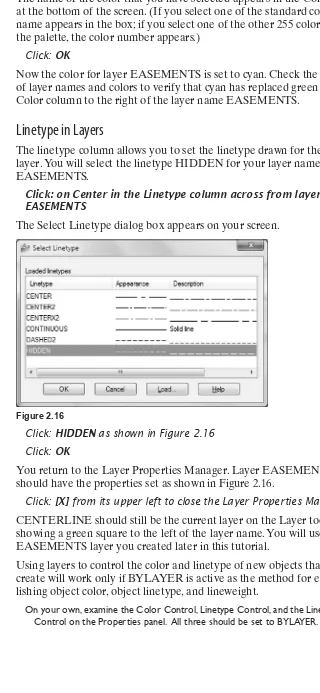
The linetype column allows you to set the linetype drawn for the layer. You will select the linetype HIDDEN for your layer named EASEMENTS.
Click: on Center in the Linetype column across from layer EASEMENTS
The Select Linetype dialog box appears on your screen.
Figure 2.16
Click: HIDDEN as shown in Figure 2.16
Click: OK
You return to the Layer Properties Manager. Layer EASEMENTS should have the properties set as shown in Figure 2.16.
Click: [X] from its upper left to close the Layer Properties Manager
CENTERLINE should still be the current layer on the Layer toolbar, showing a green square to the left of the layer name. You will use the EASEMENTS layer you created later in this tutorial.
Using layers to control the color and linetype of new objects that you create will work only if BYLAYER is active as the method for estab-lishing object color, object linetype, and lineweight.
USING OBJECT SNAP 71
Now that you know the basics of using and creating layers, you will begin creating the curved sections of the road centerline for the subdivi-sion. The straight-line sections that the curves are tangent to have been drawn to get you started.
Using Object Snap
The object snap feature accurately selects locations based on existing objects in your drawing. When you click points from the screen without using object snaps, the resolution of your screen makes it impossible for you to select points with the accuracy stored in the drawing database. You have learned how to click accurately by snapping to a grid point.
Object snap makes it possible for you to click points accurately on your drawing geometry by snapping to an object’s center, endpoint, mid-point, and so on. Whenever prompted to select a point or location, you can use an object snap to help make an accurate selection. Without this command, locating two objects with respect to each other in correct and useful geometric form is virtually impossible. Object snap is one of the most important CAD tools. Their are several different ways to access and use the Object Snaps.
Right-click: the Object Snap button on the Status bar
A menu of Object Snap modes and in Figure 2.17.
Figure 2.17
Object Snap can operate in two different ways. The irst is called over-ride mode. With this method, you select the object snap during a com-mand. The object snap acts as a modiier within the command string to
target the next point you select. You activate object snaps from within other commands by clicking the appropriate icon from the Object Snap toolbar. The object locations they select are indicated by small circles on the icons. When you activate an object snap in this manner, it is ac-tive for one click only. Remember, you can use this method only during a command that is prompting you to select points or objects.
A special feature called AutoSnap™ is active when Object Snap is in use. It displays a marker and description (SnapTip) when the cursor is placed near or on a snap point. This feature helps you to determine what location on the object will be selected.
The second method for using Object Snap is called running mode. With this method, you turn on the object snap and leave it on before you invoke any commands. When a running mode object snap is on, the marker box and SnapTip will appear during any future command when you are prompted for a point location, object selection, or other click. The SnapTip will tell you which object snap location is being targeted.
Click: Settings from the menu (see Figure 2.17)
The Drafting Settings dialog box you used to set the snap and grid appears on your screen. Notice it has three tabs: Snap and Grid, Polar Tracking, and Object Snap. Object Snap should be on top.
Click: Clear All (to unselect any current modes)
Click: Node
A check appears in the box when it is selected, as shown in Figure 2.18. Node snaps to objects drawn with the AutoCAD Point command. The symbol next to the Node setting represents the AutoSnap marker shape that will appear in the drawing.
Figure 2.18
Click: Options (from the lower left of the dialog box)
USING ARC 73
Figure 2.19
On your own, try using the slider to make the box smaller and then larger. Next, you may want to change the Marker color to a more noticeable color, such as
red. When you have inished,
Click: OK (to exit the Options dialog box)
Click: OK (to exit the Drafting Settings dialog box)
Click: Object Snap button to turn it on, if it is not already on
On your own, make sure that Ortho mode, Polar tracking, and Object snap tracking are off.
Object Snap is a very useful tool and you will use it frequently through-out the rest of this guide. It can be very important to turn it on and off as needed. Notice that the Object Snap button on the Status bar is highlighted, meaning it is active. You may click the Object Snap button to toggle the use of object snap on or off, similar to the Snap Mode and Grid buttons. Check your status bar to make sure that the Object Snap button is turned on. (It appears highlighted.)
Now you are ready to start creating arcs at accurate locations in the drawing. When you are prompted to select, look for the marker box on the crosshairs. When it’s there, you know that Snap to Node is being used to select the points that were set previously in the drawing.
Using Arc
Figure 2.20
Each Arc command option requires that you input point locations. The icons on the buttons help show you which points that option expects for input. You can deine those point locations by manually typing in the coordinate values or locating the points with the cursor and pressing the click button on your pointing device. For the exercises presented in this tutorial, follow the directions carefully so that your drawing will turn out correctly. Keep in mind that if you were designing the subdivi-sion, you might not use all the command options demonstrated in this tutorial. When you are using the AutoCAD software later for design, select the command options that are appropriate for the geometry in your drawing.
Arc 3 Points
The 3 Points option of the Arc command draws an arc through three points that you specify. The dots located on the icon represent the three points of deinition. This means that three point locations will be neces-sary for drawing that arc. Remember, to specify locations you can click them or type in absolute, relative, or polar coordinates. You will draw an arc using the 3 Points option. The Snap to Node running object snap will help you click the points drawn in the dataile.
Click: 3 Point button
Specify start point of arc or [Center]: select point 1, using the AutoSnap marker as shown in Figure 2.21
As can be seen in Figure 2.21, the AutoSnap marker for Node appears when the cursor is near a node point.
Figure 2.21
1
2
3
Now you will continue with selecting the points.
Specify second point of arc or [Center/End]: select point 2
The cursor enters drag mode, whereby you can see the arc move on the screen as you move the cursor. Many AutoCAD commands permit dynamic speciication, or dragging, of the image on the screen.
Move the cursor around the screen to see how it affects the way the arc would be drawn. Recall your use of this feature to draw circles in Tutorial 1.
Specify end point of arc: select point 3
USING ARC 75
Figure 2.22
4
Arc Start, Center, End
Next, you will draw an arc by specifying the start, center, and endpoints. Figure 2.22 shows the points used to create this arc.
Click: Start, Center, End button from the Arc flyout
Specify start point of arc or [Center]: select point 4 as the start point
Specify center point of arc: select point 5 to act as the arc’s center
Specify end point of arc or [Angle/chord Length]: select point 6 to end the arc
The arc is drawn counterclockwise from the start point. Notice that now Start, Center, End is the top button on the Arc lyout. When you are using a lyout, the last item you clicked appears as the top lyout button, so options you use frequently take only one click.
Figure 2.22 shows the point locations needed to draw a concave arc. If the start point were located where the endpoint is, a convex arc outside the centerlines would have been drawn. When you have added the arc correctly, your arc should look like that in the lower part of Figure 2.23.
On your own, try drawing another arc with the Arc Start, Center, End option, this
time clicking point 6 irst, then the center, and then point 4.
Note that this arc is drawn counterclockwise, resulting in a convex arc.
Undo this backward arc by typing U [Enter] at the command prompt.
Tip: You can type the option letters at the command prompt to select an arc creation meth-od. Pressing the right mouse button pops up a menu that allows you to pick the same op-tions for the Arc command that you selected previously. Press-ing the space bar or [Enter] key ro restart the arc command uses Arc in a more general way, where you must select the command options by typing in
Figure 2.23
New arc 7
8
Included angle 59 o12'30"
Arc Start, End, Angle
Arc Start, End, Angle draws an arc through the selected start and endpoints by using the included angle you specify. Next, draw an arc with the Start, End, Angle option, referring to Figure 2.23. This time you will use dynamic entry.
Click: to turn on Dynamic Input from the Status Bar
Click: Start, End, Angle button from the Arc flyout
Specify start point of arc or [Center]: select point 7
Specify end point of arc: select point 8
Specify included angle: 59d12’30” [Enter]
The arc is deined by the included angular value (often called the delta angle in survey drawings) from the start point to the end point. Positive angular values are measured counterclockwise. Negative angular values are measured clockwise. (Type d for the degree symbol when typing in surveyor angles. Use the single quote and double quote for minutes and seconds.)
Arc Start, Center, Length
Arc Start, Center, Length draws an arc speciied by the start and center points of the arc and the chord length. The chord length is the straight-line distance from the start point of the arc to the endpoint of the arc. You can enter negative values for the chord length to draw an arc in the opposite direction. Figure 2.24 shows a diagram describing the geom-etry of this type of arc.
Figure 2.24
Start point Center
USING ARC 77
You will draw the next arc by using Arc Start, Center, Length. Figure 2.25 shows the dynamic entry to use for the chord length.
Figure 2.25
9
10
Chord length = 169.4253
Click: Start, Center, Length button from the Arc flyout
Specify start point of arc or [Center]: select point 9
Specify center point of arc: select point 10
Specify length of chord: 169.4253 [Enter]
Your new arc should look like the one shown in Figure 2.26.
Figure 2.26
New arc 12
Arc Start, End, Radius
Draw the next arc using Start, End, Radius. The locations of the start and end points are at 11 and 12.
Click: Start, End, Radius button from the Arc flyout
Specify start point of arc or [Center]: select point 11
Specify end point of arc: select point 12
Specify radius of arc: 154.87 [Enter]
Your drawing should be similar to that in Figure 2.27.
Figure 2.27
New arc 14
13
Continuing an Arc
Arc Continue allows you to join an arc to a previously drawn arc or line. You will give it a try off to the side of the subdivision drawing and then erase or undo it, as it is not a part of the drawing. To draw an arc that is the continuation of an existing line,
Click: Line button
On your own, draw a line anywhere on your screen.
Click: Continue from the Draw panel, Arc flyout
The last point of the line becomes the irst point for the arc. The cursor is in drag mode, and an arc appears from the end of the line. You are prompted for an endpoint.
Specify end point of arc: select an endpoint
Next you will use Arc Start, Center, End to draw another arc. Then you will continue an arc from the endpoint of that arc.
Click: Start, Center, End from the Draw panel, Arc flyout
Specify start point of arc or [Center]: select a start point
Specify center point of arc: select a center point
Specify end point of arc or [Angle/chord Length]: select an endpoint
Figure 2.28
Last endpoint drawn. Continue makes this the start point for the new arc
Last arc drawn
Continue makes the last point the start of the new arc
Last line drawn Start Start
USING ARC 79
Click: Continue from the Draw panel, Arc flyout
Specify end point of arc: select an endpoint
Your drawings should look similar to those in Figure 2.28.
On your own, erase or undo the extra continued arcs and lines that you created.
Using Arc at the Command Line
To select the Arc command, you can also type the command alias, A, at the command prompt. When you start the Arc command this way, the default is the 3 Points option you used earlier. If you want to use another option, you can type the command option letter at the prompt. You will start the Arc command by typing its alias. You will then specify the start, end, and angle of the arc by typing the command option at the prompt. Refer to Figure 2.27 for the points, 13 and 14, to select.
Command: A [Enter]
The command Arc is echoed at the command prompt, followed by
Specify start point of arc or [Center]: click point 13
Specify second point of arc or [Center/End]: E [Enter]
Specify end point of arc: click point 14
Specify center point of arc or [Angle/Direction/Radius]: A [Enter]
Specify included angle: 30d54’04” [Enter]
Click: to turn Dynamic Input button off
The arc is added to your drawing. However, it may be hard to see because of the small size of the arc relative to the size of the screen and drawing.
Using Zoom
The Zoom commands change the size of the image on your display. The Zoom lyout is on the ribbon View tab, Navigate panel (Figure 2.29). To zoom in on an area of the drawing, you can select Zoom In from the Zoom lyout.
Click: Zoom In button
Your drawing is enlarged to twice its previous size on the screen (Figure 2.30).
Tip: After you draw an arc, restarting the command and then pressing the space bar or [Enter] also engages the Continue option. You can use this method to continue a line from the previously drawn arc or line.
Figure 2.30
Next you will zoom out, using the Zoom Out button from the lyout.
Click: Zoom Out button
Your drawing should return to its original size on the screen. The Zoom In and Zoom Out options use the Scale feature of the Zoom command to zoom to a scale of 2X (twice the previous size) and 0.5X (half the previous size).
Zooming Using Scale Factors
You can also use scale factors to zoom when you click the Scale option of the Zoom command. Scale factor 1.00 shows the drawing limits (where the grid is shown). Scale factor 0.5 shows the drawing limits half-size on the screen. Typing X after the scale factor makes the zoom scale relative to the previous view. For example, entering 2X causes the new view to be shown twice as big as the view established previously, as you saw when using Zoom In. A scale factor of 0.5X reduces the view to half the previous size, as you saw when using Zoom Out. Zoom Scale uses the current left corner or (0,0) coordinates as the base location for the zoom. Typing XP after the scale factor makes the new zoom scale relative to paper space. A scale factor of 0.5XP means that the object will be shown half-size when you are laying out your sheet of paper. You will learn more about paper space in Tutorial 5.
You will select the Zoom command by typing its alias at the command prompt.
Command: Z [Enter]
USING ZOOM 81
The view is enlarged to twice the previous size. Repeat the Zoom command.
Command: [Enter] (to restart the last command)
Specify corner of window, enter a scale factor (nX or nXP), or [All/Center/ Dynamic/Extents/Previous/Scale/Window/Object] <real time>: .5 [Enter]
The drawing limits appear on the screen at half their original size. The area shown on the screen is twice as big as the drawing limits. Now, restore the original view.
Command: [Enter] (to restart the last command)
Specify corner of window, enter a scale factor (nX or nXP), or [All/Center/ Dynamic/Extents/Previous/Scale/Window/Object] <real time>: 1 [Enter]
Zoom Window
To use Zoom Window, create a window around the area that you want to enlarge to ill the screen. This lets you quickly enlarge the exact portion of the drawing that you are interested in. You will select this command using the Zoom lyout. Note that the Zoom command has an apostrophe in front of it at the command prompt to show that the com-mand is transparent. This means that you can select it during execution of another command. You will zoom in on the area shown in Figure 2.31.
Click: Zoom Window icon
Specify irst corner: select point A
Specify opposite corner: select point B
Figure 2.31
A
B
Figure 2.32
Zoom Previous
To return an area to its previous size, you will click Zoom Previous from the Standard toolbar.
Click: Zoom Previous button
Your drawing is returned to its original size. Areas can be repeat-edly zoomed, that is, you can zoom in on a zoomed area; in fact, you can continue to zoom until the portion shown on the display is ten trillion times the size of the original.
Zoom Realtime
An easy way to zoom your drawing to the desired size is to use the Zoom Realtime feature on the Standard toolbar.
Click: Zoom Realtime button
Select an arbitrary point in the middle of your drawing and hold down the click button of your pointing device while dragging the cursor up and down. When you move the cursor upward, you zoom in closer to the drawing; when you move the cursor downward, you zoom out farther from the drawing.
Press ESC or ENTER to exit, or right-click to use the shortcut menu.
USING THE SCROLL WHEEL TO ZOOM 83
Zoom All
Zoom All returns the drawing to its original size by displaying the draw-ing limits, or displaydraw-ing the drawdraw-ing extents (all of the drawdraw-ing objects), whichever is larger. Select the Zoom All icon from the Zoom lyout.
Click: Zoom All button
The drawing should return to its original size, that is, as it was before you began the Zoom command. Experiment on your own with the other options of the Zoom command and read about them in the Help window.
Using the Scroll Wheel to Zoom
The scroll wheel on your mouse also provides Zoom functions. Try these out now.
Roll the scroll wheel forward
The view of the drawing is enlarged on your screen.
Roll the scroll wheel towards yourself.
The view zooms out and appears smaller.
Double-click the scroll wheel.
The drawing ills the screen.
Zoom Dynamic
Another way to zoom in and move around in a large drawing quickly is to use the Zoom Dynamic.
Click: Zoom Dynamic
The view box appears on your screen, as shown in Figure 2.33.
Figure 2.33
Move your mouse to position the view box.
The box shows an X in the center, indicating it is in position mode. As you move your mouse around, the view box moves with your mouse movements..
Position the view box at the location you desire and click the mouse.
Now an arrow appears at the right edge of the box and as you move your mouse, the size of the box is enlarged or reduced as shown in Figure 2.34.
Figure 2.34
Try reducing the box and then click the mouse button.
You return to the position mode, so that you can move the box around again.
When you are satisfied with the location of the box, right-click the mouse and select Enter.
The area enclosed in the box ills the graphics window,
Using Pan Realtime
The Pan command lets you position the drawing view on the screen without changing the zoom factor. Unlike the Move command, which moves the objects in your drawing to different locations on the coor-dinate system, the Pan command does not change the location of the objects on the coordinate system. Rather, your view of the coordinate system and the objects changes to a different location on the screen.
Press and hold the scroll wheel and move your mouse
Doing this, you can drag your drawing around on the screen. The draw-ing should move freely about the drawdraw-ing area until you let go of the scroll wheel, at which point it will stop.
You can also select to use the Pan command from the ribbon,
USING PAN REALTIME 85
Press and hold the left mouse button to position the drawing on the screen.
Press: [Esc] or [Enter] to exit the command
Double-click the scroll wheel to Zoom to the drawing extents.
Your drawing should now ill the drawing window.
Using Circle Options
In Tutorial 1 you learned to use the Circle command by specifying a center point and a radius value. You can also use the Circle command to draw circles by specifying any two points (Circle 2 Point), any three points (Circle 3 Point), or two tangent references and a radius (Circle Tan Tan Radius). You will use the Endpoint object snap mode to make circles that line up exactly with the ends of the existing lot lines.
Right-click: Object Snap button from the status bar
Click: Settings from context menu that appears
Click: to turn on Endpoint in the dialog box
Click: OK
The Endpoint and Node running mode object snaps are now turned on. When you see the AutoSnap marker appear on the endpoint of a line, the crosshairs will snap to the marker point. If you see the Node marker, move the crosshairs until the endpoint you want is highlighted.
Click: LOTLINES from the Layer Control to make it current
Circle 2-Point
You will draw a circle using Circle 2-Point. Points 1 and 2 will be end-points of the circle’s diameter, as shown in Figure 2.35.
Figure 2.35
1
Click: 2-Point button from the Circle flyout
Specify first end point of circle’s diameter: select point 1
Specify second endpoint of circle’s diameter: select point 2
The circle has been deined by the two selected endpoints deining its diameter. Your screen should look like Figure 2.36.
Figure 2.36 2
4
3 1
5
Circle 3-Point
To draw a circle using Circle 3-Point, specify any three points on the circle’s circumference. Refer to Figure 2.36 for the points to select.
Click: 3-Point from the Circle flyout, Home tab Draw panel
Specify irst point on circle: select point 3
Specify second point on circle: select point 4
Because you are in drag mode, you see the circle being created on your screen as you move the cursor.
Specify third point on circle: select point 5
The three points on its circumference have deined the circle. Your screen should look like Figure 2.37.
Figure 2.37
1
CIRCLE TANGENT, TANGENT, RADIUS 87
Next you will draw a circle tangent to two angled centerlines. First, you will change the current layer and zoom in on points 1 and 2, shown in Figure 2.37.
Click: CENTERLINE from the Layer Control list to make it current
Click: Zoom Window button
Specify irst corner: click point 1
Specify opposite corner: click point 2
The area should be enlarged on your screen, as shown in Figure 2.38.
Click: Object Snap button to turn it off
The Object Snap button should now appear unselected, meaning that all running mode object snaps are temporarily turned off. You should do so because sometimes object snaps can interfere with the selection of points and the operation of certain commands. You will use the Circle Tangent, Tangent, Radius option, which uses the Tangent object snap. This will not work well unless other object snaps are turned off.
Figure 2.38
Tangent line 1 Tangent line 2
Figure 2.39
Circle Tangent, Tangent, Radius
Circle Tangent, Tangent, Radius requires that you specify two objects to which the resulting circle will be tangent. Then give the radius of the resulting circle. This method is frequently used in laying out road centerlines. It involves selecting the two straight sections of the road centerline to which the curve is tangent and then specifying the radius.
Click: Tan, Tan, Radius from the Circle flyout on the Draw panel
Note that the AutoSnap marker appears any time the cursor is near a line. Refer to Figure 2.38 for the lines to select. You can select either line irst.
Specify point on object for irst tangent of circle: click tangent line 1
Specify point on object for second tangent of circle: click tangent line 2
Specify radius of circle <34.0000>: 267.3098 [Enter]
A circle with a radius of 267.3098 is drawn tangent to both original lines, as shown in Figure 2.39.
Tip: If you get the message, Circle does not exist, the radius
you speciied may be too small
or too large to be tangent to both lines.
Tip: The value shown as the default radius for the circle depends on the size of the last circle you drew.
You can also use Circle Tangent, Tangent, Radius to draw a circle tangent to two circles. You will try this by drawing two circles off to the side of the drawing and then adding a circle that is tangent to both of them.
On your own, draw two circles off to the side of your subdivision drawing.
Click: Tan, Tan, Radius from the Circle flyout
Specify point on object for irst tangent of circle: select one of the circles
you just drew
Specify point on object for second tangent of circle: select the other circle
Specify radius of circle <267.3098>: 150 [Enter]
A circle with a radius of 150 is drawn tangent to both circles.
Circle Tangent, Tangent, Tangent
The Circle Tangent, Tangent, Tangent command lets you quickly deine a circle that is tangent to three entities in the drawing.
Try it on your own by selecting the Tan, Tan, Tan button from the Circle lyout and then selecting three lot lines to draw a circle tangent to.
Now erase the extra circles on your own.
Using Ellipse
The command options for specifying an ellipse can be selected from the Ellipse lyout on the Home tab Draw panel.
Next, you will practice using the Ellipse command by drawing some ellipses off to the side of the drawing. You will erase them when you are through. To draw an ellipse by specifying three points,
Click: Axis, End button from the Ellipse flyout
Specify axis endpoint of ellipse or [Arc/Center]: select a point
Specify other endpoint of axis: select a point
Specify distance to other axis or [Rotation]: select a point
An ellipse is created on your screen, using the three points that you selected. The ellipse has a major axis (the longest distance between two points on the ellipse) and a minor axis (the shorter distance across the ellipse). The AutoCAD program determines which axis is major and which is minor by examining the distance between the irst pair of endpoints and comparing it to the distance speciied by the third point.
One way to describe an ellipse is to create a circle and then tip the circle away from your viewing direction by a rotation angle. This meth-od requires you to specify the angle of rotation instead of the endpoint of the second axis.
You will draw an ellipse using two endpoints and an angle of rotation. See Figure 2.40 to determine the location of the points.
USING ELLIPSE 89
Click: Axis, End button from the Ellipse flyout
Specify axis endpoint of ellipse or [Arc/Center]: select point 1
Specify other endpoint of axis: select point 2
This deined the distance between points 1 and 2 as the major axis (diameter) of the ellipse. This time at the command prompt, use the options to specify the rotation angle, as though tipping a circle.
Specify distance to other axis or [Rotation]: R [Enter]
Specify rotation around major axis: 35 [Enter]
On your own, erase the ellipses that you created.
The remaining construction methods for ellipses are similar to specify-ing the axes, but use radius values rather than diameter values. This way, when the center point of the ellipse is known, you can use it as a start-ing point. Refer to Figure 2.41 for the locations of the points in the next steps. This time type the command.
Command: ELLIPSE [Enter]
Specify axis endpoint of ellipse or [Arc/Center]: C [Enter]
The center of the ellipse is the intersection of the major and minor axes. You can enter a coordinate or use the cursor to select a point on the screen.
Specify center of ellipse: select point 1
Next, you provide the endpoint of the irst axis. The angle of the ellipse is determined by the angle from the center point to this endpoint.
Specify endpoint of axis: select point 2
Now specify the distance measured from the center of the ellipse to the endpoint of the second axis, measured perpendicular to the irst axis (or a rotation angle can be used).
Specify distance to other axis or [Rotation]: select point 3
The point that you selected determined whether the irst axis is a major or minor axis. The ellipse is drawn on your screen.
Next, draw an ellipse by specifying a center point, one axis point, and an angle of rotation. Refer to Figure 2.42.
Click: Center from the Ellipse flyout
Specify center of ellipse: click point 1
Specify endpoint of axis: click point 2
Specify distance to other axis or [Rotation]: R [Enter]
Specify rotation around major axis: 30 [Enter]
Before you go on, erase the ellipses you drew for when practice.
Use Zoom All to return to the original view.
Save your drawing at this time.
2
Tip: Notice that when you pick the Center button from the
Ellipse lyout, the “C” option is
automatically selected at the command prompt : Specify axis endpoint of ellipse or [Arc/ Center]: C
When you have successfully saved your drawing,
Click: Application button, Exit AutoCAD
You are now back at the Windows desktop.
You will inish the subdivision drawing in Tutorial 3.
chord length
EXERCISES 91
Exercises
Redraw the following shapes. If dimensions are given, create your drawing geometry exactly to the speci-ied dimensions. The letter M after an exercise number means that the dimensions are in millimeters (metric units). If no letter follows the exercise number, the dimensions are in inches. Do not include dimensions on the drawings. The Ø symbol means diameter; R indicates a radius.
Exercise 2.5 Plot Pl
Draw this circuit, using the techniques you have learned.
R .825 BOTH ENDS
3.17 ø 0.76
EXERCISES 93
Exercise 2.8 Gasket Exercise 2.9 Shape