ORIENTATION BASED BUILDING OUTLINE EXTRACTION IN AERIAL IMAGES
Andrea Kovacsa,band Tamas Sziranyib a
Pazmany Peter Catholic University, Prater 50/A, 1083, Budapest, Hungary bMTA SZTAKI, Kende 13-17, 1111, Budapest, Hungary
[email protected], [email protected]
Commission VII, WG VII/4
KEY WORDS:Orientation Estimation, Building Detection, Feature Extraction, Aerial Image Detection, Urban
ABSTRACT:
The goal of this paper is to extract automatically the building contours regardless of shape. By extracting these contours, detection results will be more accurate, giving useful information about urban area, which is important for many tasks, like map updating and disaster management. First, we extract local feature points from the image, based on a modification of Harris detector’s saliency function, which can represent urban area and building effectively. This point set is then used to define the main orientation of the buildings, which characterizes well an urban region and helps to define directions, where object contours have to be searched. Second, we applied shearlet approach to extract edges in the defined directions. This results in an edge map, which helps us to determine point subsets belonging to the same building. Convex hulls of the point subsets is used for contour initialization, then region based Chan-Vese Active Contour method is applied to extract the accurate building outlines.
1 INTRODUCTION
Automatic evaluation of aerial photographs is a very important research topic, as the manual analysis is very time consuming. Nowadays, there are many approaches for multispectral or syn-thetic aperture radar (SAR) images, but developing methods han-dling optical aerial or satellite images have also big importance (Zhong and Wang, 2007), (Dey et al., 2011). When working on optical photographs, the challenge is the large variety of features: images can be grayscale or containing poor color information, scanned in different seasons and in altering lighting conditions. In this case, pixel neighborhood processing techniques like multi-layer difference image or background modeling (Benedek and Szir´anyi, 2008) cannot be adopted efficiently since details are not comparable.
In our work, we concentrate on building detection, which is a very important task, as land area might be changing dynamically and a continuous periodic administration is necessary to have up-to-date information. This is very useful for urban development analysis, map updating and also helps in disaster management, vegetation monitoring and discovering illegal surface forming ac-tivities. The challenges of building detection partly come from the aforementioned diverse imaging circumstances, causing dif-ferent color, contrast and shadow conditions. On the other hand, the shape of different buildings is quite various, which needs so-phisticated techniques to have more accurate results.
There is a wide range of publications in remote sensing topic for urban area and building detection. However, we concentrate on novel approaches which will be used for comparison later. State-of-the-art building detection approaches can be divided into two main groups. The first group contains methods which only lo-calize buildings without any shape information (Sirmacek and Unsalan, 2009) and (Sirmac¸ek and ¨Unsalan, 2011). In these ap-proaches, only the location of the building is detected. In (Sir-macek and Unsalan, 2009) a SIFT salient point based approach is introduced for urban area and building detection (denoted by SIFT-graph in the experimental part). This method uses two tem-plates (a light and dark one) for detecting buildings. After ex-tracting feature points representing buildings, graph based
tech-niques are used to detect urban area. The given templates help to divide the point set into separate building subsets, then the lo-cation is defined. However, in many cases, the buildings cannot be represented by such templates, moreover sometimes it is hard to distinguish them from the background based on the given fea-tures. (Sirmac¸ek and ¨Unsalan, 2011) proposes a method to detect building positions in aerial and satellite images based on Gabor filters (marked as Gabor filters in the experimental part), where different local feature vectors are used to localize buildings with data and decision fusion techniques.
The other group contains approaches which use some shape tem-plates (e.g. rectangles) for detecting the buildings (Song et al., 2006), (Sirmac¸ek and ¨Unsalan, 2008) and (Benedek et al., 2012). In this case, beside the location, additional information is given about the size, orientation and shape. In (Song et al., 2006) a segment-merge technique is introduced (Segment-Merge), which represents a distinct trend. This method considers building detec-tion task as a region level problem and assumes that buildings are homogeneous areas (either regarding color or texture informa-tion), and based on this fact, they can be distinguished from the background. In the first step, the background is subtracted, then some shape and size constraints are created to define building ob-jects. However, the basic assumptions influences the success of the approach: sometimes buildings cannot be distinguished from the background effectively by using color and texture features, therefore the further steps will also fail.
(Sirmac¸ek and ¨Unsalan, 2008) (named as Features-Canny in the experimental part) combines roof color, shadow and edge infor-mation in a two-step process. First, a built-in candidate is de-fined based on color and shadow feature, then a rectangle tem-plate is fitted using a Canny edge map. This sequential method is very sensitive to the deficiencies of both steps: the inappro-priate shadow and color information results in false candidates, and accurate detection is not possible with a malfunctioning edge map.
neigh-boring building parts (marked later as bMBD). The method uses low-level (like gradient orientation, roof color, shadow, roof ho-mogeneity) features which are then integrated to have object-level features. After having object (building part) candidates, a config-uration energy is defined based on a data term (integrating the object-level features) and a prior term, handling the interactions of neighboring objects and penalizing the overlap between them. The optimization process is then performed by a bi-layer multiple birth and death optimization.
Although the second group provides some information about the shape, it is still just an approximation. Therefore, our aim is to construct a method, which can deal with the shape diversity. In the first step, we generate a feature point set, based on our modifi-cation of the Harris corner detector (Kov´acs and Szir´anyi, 2012), which is able to represent object contours effectively. Next, we calculate main directions in the surroundings of feature points to get orientation information, which characterizes the urban area as well. Then, an improved edge map is constructed by strengthen-ing the edges only in the calculated main directions with shearlet method (Easley et al., 2009). Based on the edge map, the feature point set is divided into subsets by a graph based connectivity detection (a similar was introduced in (Sirmacek and Unsalan, 2009)), where each subset represents a building candidate. Us-ing the convex hull of the point subset for initialization, Chan-Vese active contour method (Chan and Chan-Vese, 2001) detects the final boundary of the building. Evaluating the method on aerial images provided by the Hungarian Institute of Geodesy, Cartog-raphy and Remote Sensing, the initial results show that our pro-posed method is able to detect buildings more efficiently and it can be a rival for other state-of-the-art methods.
2 FEATURE POINT EXTRACTION
2.1 Original Harris detector
The detector was introduced in 1988 (Harris and Stephens, 1988) and based on the principle that at corner points intensity values change largely in multiple directions. By considering a local win-dow in the image and determining the average changes of image intensity result from shifting the window by a small amount in various directions, all the shifts will result in large change in case of a corner point. Thus corner can be detected by finding when the minimum change produced by any of shifts is large.
The method first computes the Harris matrix (M) for each pixel in the image, consisting the product of the first order derivatives smoothed by a Gaussian window. Then, instead of computing the eigenvalues ofM, anRcorner response is defined:
R= Det(M)−k∗Tr2(M), (1) withDetandTrdenoting the determinant and trace ofM andk
is a coefficient, usually around0.04.
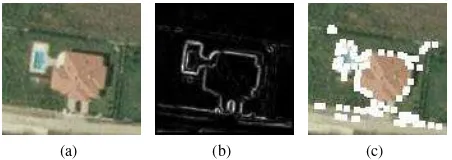
ThisRcharacteristic function is used to detect corners.Ris large and positive in corner regions, and negative in edge regions (Fig-ure 1(b)). By searching for local maxima ofR, the Harris key-points can be found ( see Figure 1(c)).
2.2 Modified Harris based feature map
When working on contour detection, contour points have to be emphasized with some techniques. In our previous work (Kov´acs and Szir´anyi, 2012), we introduced a modification of the origi-nal Harris method, which is able to emphasize edges and corners
(a) (b) (c)
Figure 1: Operation of the Harris detector: (a) shows the original image; (b) is theRcharacteristic function; (c): Keypoints chosen as local maxima ofR.
(a) (b) (c)
Figure 2: Operation of the modified Harris detector: (a) shows the original image; (b) is the proposedRlogmaxfunction; (c): Key-points chosen as local maxima ofRlogmax.
equally, therefore can be applied efficiently for generating a fea-ture map for active contour approaches. The proposed modifica-tion looks as follows:
Rlogmax= max(0,log[max(λ1, λ2)]), (2) whereλ1andλ2denote the eigenvalues ofM. When emphasiz-ing corners and edges, they both have one large component, thus
max(λ1, λ2)function separates the flat and non-flat regions ac-curately. To produce a steady feature map, the dynamics of the characteristic function should be compressed into a balanced dis-tribution by keeping the necessary strength of the main attractors. The natural logarithmic (log) function satisfies this condition: it has a balanced output for both corner and edge saliency. The target set of theRlogmaxis the positive domain (when it is used as a feature map), thus the outermaxfunction is responsible for replacing negative values of smallλ(points in flat regions) with zeros.
By calculating the local maxima of the proposedRlogmax func-tion, the modified feature point set is defined, see Figure 2.
2.3 Urban area detection
(a) (b)
Figure 3: Urban area detection with spatial voting: (a) shows the original image; (b) is the detected urban area.
point (xi, yifor theithpoint), and the vote is decreasing around it in accordance with the spatial distance:
V(x, y) = After calculatingV for every pixel in the image, Otsu thresh-olding (Otsu, 1979) was applied to distinguish urban area from background.
Testing the method for modified Harris feature points for many different aerial images, the results showed that urban area is well represented by this point set. A typical result can be seen in Fig-ure 3, where a grayscale image was used with limited color infor-mation and some cloud shadows generating false contours in the left size of the image, which makes the detection harder. How-ever, the generated point set is mostly situated in the urban area and the spatial voting can detect the area quite accurately.
3 ORIENTATION BASED BUILDING DETECTION
Our tests have shown that the proposed Harris point set is able to represent urban area, therefore features of the points can also be used to extract information of the urban area to improve building detection. Our idea was to extract the main direction in the small neighborhood of the feature points which can characterizes the urban area. Edges in the defined direction are strengthened with the shearlet method (Yi et al., 2009). Building candidates are determined then based on the improved edge map and the feature point subset. The accurate building contours are generated with Chan-Vese active contour method (Chan and Vese, 2001).
3.1 Orientation estimation
A small urban area has buildings with connected orientation. In most cases, houses are oriented according to some bigger struc-ture (e. g. the road network), therefore main orientation of the area can be defined. As the proposed modified Harris point set represents the area, our idea was to calculate the main direction of the buildings of the area based on this point set. (Benedek et al., 2012) used a low level feature, called local gradient orienta-tion density, where the surroundings of a pixel was investigated whether it has perpendicular edges or not. Now we use a similar feature to calculate the main direction of a feature point’s neigh-borhood. Let us denote the gradient vector by∇giwithk∇gik magnitude andϕ∇i orientation for theithpoint. By defining the
n×nneighborhood of the point withWn(i)(wherendepends on the resolution), the weighted density ofϕ∇
i is as follows:
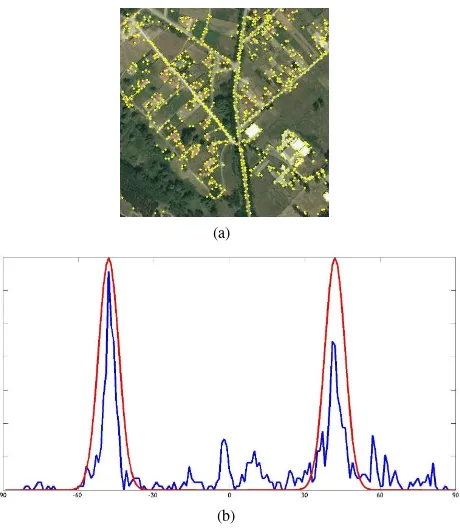
Figure 4: Orientation estimation for an image: (a) shows the feature points in yellow; (b) shows theλi(ϕ)orientation density function of the points in blue, calculated for15×15 neighbor-hood. ϕ ∈ [−90,+90] is the horizontal axis, the number of points is the vertical axis. Theη2(.)two-component Gaussian mixture is in red, detected peaks areθ=−47andθortho= +53.
withNi = Pr∈Wn(i)k∇grkandk(.)kernel function withh bandwidth parameter.
We define a main orientation for(ith)feature point as:
ϕi= argmax ϕ∈[−90,+90]
{λi}. (5)
After calculating the direction for all theKfeature points, we define the density functionϑof their orientation:
ϑ(ϕ) = 1
We expect that the density functionϑwill have two main peaks (because of the perpendicular edges of buildings), see Figure 4. This can be measured by correlatingϑto a bimodal density func-tion:
α(m) =
Z
ϑ(ϕ)η2(ϕ, m, dϑ)dϕ, (8) whereη2(.)is a two-component mixture of Gaussian, withmand
m+ 90mean values anddϑis standard deviation for both com-ponents. The valueθof the maximal correlation can be obtained as:
θ= argmax
m∈[−90,+90]
{α(m)}. (9)
And the corresponding orthogonal direction (the other peak of
α(m)):
θortho=
θ−90, ifθ≥0
Thus, we expect building edges to be in the calculated main ori-entation and we try to enhance edges in the given directions. We tested the orientation estimation approach for different datasets and different window size (n×nneighborhood). The results show that with larger sizen= 15, the density function is smoother (see Figure 4(b)), while with smaller size (n = 5) rougher and blurred, but the main characteristics and the main peaks were ob-vious in both cases, therefore we only showed the result of15×15
neighborhood in Figure 4.
3.2 Edge detection with shearlet transform
Now, the main orientations have been defined. The next step is to enhance edges in these directions to extract useful edge infor-mation from the image that can be later combined efficiently with the feature point set. There are different approaches which uses directional information like Canny edge detection (Canny, 1986) using the gradient orientation; or (Perona, 1998) which is based on anisotropic diffusion, but cannot handle the situation of multi-ple orientations (like corners). Other single orientation methods exist, like (Mester, 2000) and (Bigun et al., 1991), but the main problem with these methods is that they calculate orientation in pixel-level and lose the scaling nature of orientation, therefore they cannot be used for edge detection. In our case we need to enhance edges constructed by joint pixels, thus we searched for such edge detection method which can handle orientation as well. Moreover, as searching for building contours, the algorithm must handle corner points as well. Shearlet transform (Yi et al., 2009) has been lately introduced for efficient edge detection, as unlike wavelets, shearlets are theoretically optimal in representing im-ages with edges and, in particular, have the ability to fully capture directional and other geometrical features.
For an imageu, the shearlet transform is a mapping:
u→SHψu(a, s, x), (11)
providing a directional scale-space decomposition ofuwitha >
0is the scale,sis the orientation andxis the location:
SHψu(a, s, x) =
Z
u(y)ψas(x−y)dy=u∗ψas(x), (12)
whereψasare well localized waveforms at various scales and ori-entations. As we are working with a discrete transform, a discrete set of possible orientations is used, for examples = 1, . . . ,16. In our case, the main orientation of the imageθis calculated (see Section 3.1), therefore our aim is to strengthen the components in the given direction on different scales as we only want to de-tect edges in the main orientation. The first step is define thes
subband which includesθandθortho:
˜
s =
si: (i−1)
2π
s < θ≤i
2π s
,
˜
sortho=
sj: (j−1)
2π
s < θortho≤j
2π s
. (13)
After this, theSHψu(a,s, x˜ )andSHψu(a,s˜ortho, x)subbands have to be strengthened. For this reason, the weak edges (values) have been eliminated with a hard threshold and only the strong coefficients are amplified.
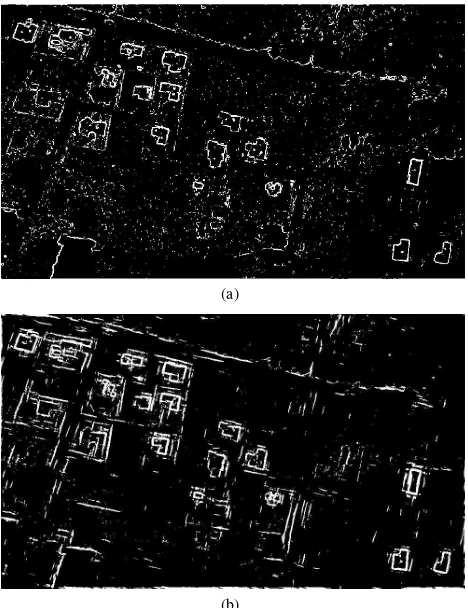
Finally, the shearlet transform is applied backward (see Eq.12) to get the reconstructed image, which will have strengthened edges in the main directions. The strengthened edges can be easily detected with Otsu thresholding, results can be seen in Figure 5. While the pure Canny method detects the edges sometimes with discontinuities, the shearlet based edge strengthening helps to eliminate these problems.
(a)
(b)
Figure 5: Comparing the edge maps foru∗
channel : (a) shows the result of the pure Canny edge detection; (b) is the result of the shearlet based edge strengthening.
As building colours may vary largely and the shadow effect have to be reduced to eliminate false contours when detecting build-ings, we used two color channels in the edge strengthening step: for red buildings we used theu∗
component of CIEL∗
u∗
v ad-vised in (Muller and Zaum, 2005); for grey buildings we applied theCbcomponent ofYCbCrspace, which was found to separate grey coloured objects and their shadows the most effectively in (Tsai, 2006). First, we extracted the red building outlines based on theu∗
edge map, after that the remaining buildings were de-tected in theCb-based map.
3.3 Building contour detection
After defining the main orientation for the extended Harris point set for the urban region, the shearlet based edge strengthening ap-proach enhanced the edges in the main directions, resulting in an edge mapS. In the next step we will compound the feature point set and edge map with a graph based representation, which was introduced in our previous work (Kovacs and Szir´anyi, 2010); based on the generated edge map, connected feature point sub-graphs are determined, indicating building candidates. The E
edge network ofG= (V, E)graph is constructed by connecting
vi= (xi, yi)andvj= (xj, yj), theithandjthvertices of theV feature point set, if they satisfy the following conditions:
1. S(xi,yi)= 1, 2. S(xj,yj)= 1,
3. ∃a finite path betweenviandvjinS.
there might be some singular points and some smaller subgraphs (points and edges connecting them) indicating noise. To discard them, we select subgraphs having points over a given threshold.
To detect the accurate contour of the buildings, we use Chan-Vese active contour algorithm (Chan and Vese, 2001) and initialize the contour for a building candidate as the convex hull of the vertices of the subgraph.
Main directional edge emphasis may also enhance road and vege-tation contours, moreover some feature points can also be located on these edges. Therefore after the contour extraction step the results have to be supervised to filter out misdetections. When detecting false objects, like road parts or land section borders, the edges in the detected area are unidirectional, unlike buildings, which have either orthogonal or multidirectional contours. Thus, the directional distribution of edges is evaluated in the extracted area (see the technique in Section 3.1) and unidirectional hits are eliminated. Here, we use again the correlation to a bimodal den-sity function (Eq. 8) then measure and threshold theαvalue to select multidirectional hits.
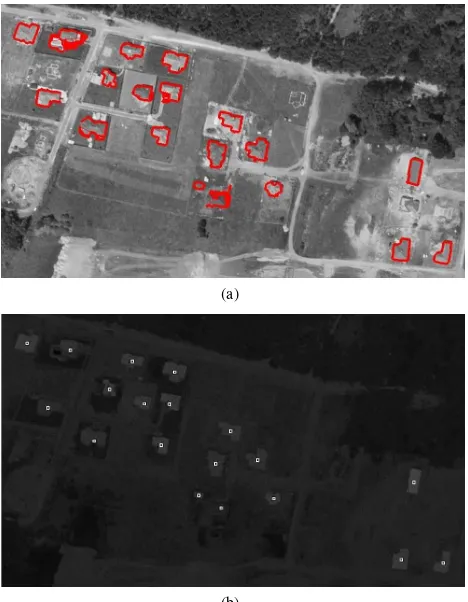
Figure 6 shows the result of the building detection with the de-tected and filtered contours. Based on the contours, we can es-timate the location of the buildings which will be useful in the further work for evaluation and comparison.
4 EXPERIMENTS
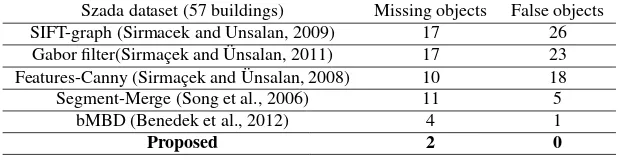
We have evaluated our proposed method for the Szada dataset provided by the Hungarian Institute of Geodesy, Cartography and Remote Sensing. This dataset was also used in (Benedek et al., 2012) for evaluation and for comparison with different methods ((Sirmacek and Unsalan, 2009), (Sirmac¸ek and ¨Unsalan, 2011), (Song et al., 2006) and (Sirmac¸ek and ¨Unsalan, 2008)), therefore quantitative test results are available. In Table 1 the quantitative results for Szada dataset is shown. The name of the compared methods is abbreviated as marked in the introduction part. The complete dataset contains 57 buildings out of which our method is able to detect 55 buildings (meaning 2 misdetections) with 0 false positive object. In this case we used the location of the buildings (see Figure 6(b)) for evaluation. By comparing this with the other approaches, one can see that our method is able to outperform the others.
For qualitative evaluation we used the detected outlines (see Fig-ure 6(a)). A part of this image was cut and enlarged to compare our method qualitatively with (Benedek et al., 2012). Figure 7 shows the detailed differences. However, rectangular templates provide a very close estimation for the shape of the buildings, the fine details are lost. Unlike shape templates, active contour based techniques do not apply any restrictions for the shape and able to detect the varying contour parts more accurately.
Although active contours are able to cope with the altering shapes, sometimes they suffer from the lack of contrast difference be-tween the building and the background and have difficulties when detecting contours (like missing a part of the building outline, see the building in the bottom-middle of Figure 6(a)). Moreover, sometimes buildings are oriented variously and the edge strength-ening step misses their edges, which may result in misdetections.
5 CONCLUSION AND FUTURE WORK
In this paper, we have introduced a novel orientation based method for building detection in aerial images. The proposed method
(a)
(b)
Figure 6: Result of the building detection: (a) shows the detected contours; (b) is the estimated locations of the detected buildings.
(a) (b) (c)
Figure 7: Qualitative comparison of MPP-based and proposed method: (a) is the original image part; (b) shows the result of MPP-based method; (c) is the result of the proposed approach.
first calculates a feature point set based on the modification of the well-known Harris corner detector. In the first step, we have proven the detector’s ability to characterize urban area by testing the point set with a voting matrix technique for urban area detec-tion. The orientation feature of the point set is then used to define main direction of the urban area, to make an edge strengthen-ing in the given directions. Shearlet transform have been applied for the orientation based edge enhancing, as it is able to handle orientation information, even in multidirectional cases (like cor-ners). The improved edge information is combined with the fea-ture point set and a graph based technqiue was introduced to get feature point subgraphs as building candidates. Finally, Chan-Vese nonparametric active contour approach was applied to ex-tract the building contours. The proposed method have been com-pared with other state-of-the-art algorithms quantitatively and qual-itatively. The results showed that our approach can detect build-ings more effectively than the others, either for pure localization and contour extraction.
Szada dataset (57 buildings) Missing objects False objects SIFT-graph (Sirmacek and Unsalan, 2009) 17 26 Gabor filter(Sirmac¸ek and ¨Unsalan, 2011) 17 23 Features-Canny (Sirmac¸ek and ¨Unsalan, 2008) 10 18 Segment-Merge (Song et al., 2006) 11 5
bMBD (Benedek et al., 2012) 4 1
Proposed 2 0
Table 1: Quantitative results for Szada dataset
Moreover, there are still some open questions, which have to be answered in the near future. If the resolution of the aerial im-age is smaller, with larger scanned urban area, the orientation of the buildings may varying, which have to be handled, for exam-ple by correlating the orientation distribution function with multi-ple bimodal Gaussian functions. Furthermore, the active contour method might suffer from difficulties when building contours are hided by other structures like trees. In this case some prior con-straints (like edge parts running in the defined main orientations) can be introduced.
ACKNOWLEDGMENT
This work was supported by the Hungarian Scientific Research Fund (OTKA) under grant number 76159.
REFERENCES
Benedek, C. and Szir´anyi, T., 2008. Bayesian foreground and shadow detection in uncertain frame rate surveillance videos. IEEE Trans. Image Processing 17(4), pp. 608–621.
Benedek, C., Descombes, X. and Zerubia, J., 2012. Building development monitoring in multitemporal remotely sensed image pairs with stochastic birth-death dynamics. IEEE Trans. Pattern Analysis and Machine Intelligence 34(1), pp. 33–50.
Bigun, J., Granlund, G. H. and Wiklund, J., 1991. Multidimen-sional orientation estimation with applications to texture analysis and optical flow. IEEE Trans. Pattern Analysis and Machine In-telligence 13(8), pp. 775–790.
Canny, J., 1986. A computational approach to edge detection. IEEE Trans. Pattern Analysis and Machine Intelligence 8(6), pp. 679–698.
Chan, T. F. and Vese, L. A., 2001. Active contours without edges. IEEE Trans. Image Processing 10(2), pp. 266–277.
Dey, V., Zhang, Y. and Zhong, M., 2011. Building detection from pan-sharpened geoeye-1 satellite imagery using context based multi-level image segmentation. In: International Symposium on Image and Data Fusion (ISIDF), pp. 1–4.
Easley, G. R., Labate, D. and Colonna, F., 2009. Shearlet-based total variation diffusion for denoising. IEEE Trans. Image Pro-cessing 18(2), pp. 260–268.
Harris, C. and Stephens, M., 1988. A combined corner and edge detector. In: Proceedings of the 4th Alvey VisionConference, pp. 147–151.
Kovacs, A. and Szir´anyi, T., 2010. New saliency point detection and evaluation methods for finding structural differences in re-mote sensing images of long time-span samples. In: Advanced Concepts for Intelligent Vision Systems, Springer - Lecture Notes on Computer Sciences, Sydney, Australia.
Kov´acs, A. and Szir´anyi, T., 2012. Harris function based active contour external force for image segmentation. Pattern Recogni-tion Letters 33(9), pp. 1180–1187.
Mester, R., 2000. Orientation estimation: Conventional tech-niques and a new non-differential approach. In: Proc. 10th Euro-pean Signal Processing Conference.
Muller, S. and Zaum, D., 2005. Robust building detection in aerial images. In: CMRT, Vienna, Austria, pp. 143–148.
Otsu, N., 1979. A threshold selection method from gray-level histograms. IEEE Trans. Systems, Man and Cybernetics 9(1), pp. 62–66.
Perona, P., 1998. Orientation diffusion. IEEE Trans. Image Pro-cessing 7(3), pp. 457–467.
Sirmac¸ek, B. and ¨Unsalan, C., 2008. Building detection from aerial imagery using invariant color features and shadow infor-mation. In: Int. Symp. on Computer and Information Sciences (ISCIS).
Sirmac¸ek, B. and ¨Unsalan, C., 2010. Using local features to mea-sure land development in urban regions. Pattern Recognition Let-ters 31, pp. 1155–1159.
Sirmac¸ek, B. and ¨Unsalan, C., 2011. A probabilistic framework to detect buildings in aerial and satellite images. IEEE Trans. Geoscience and Remote Sensing 49(1), pp. 211–221.
Sirmacek, B. and Unsalan, C., 2009. Urban-area and building de-tection using sift keypoints and graph theory. IEEE Trans. Geo-science and Remote Sensing 47(4), pp. 1156–1167.
Song, Z., Pan, C. and Yang, Q., 2006. A region-based approach to building detection in densely build-up high resolution satellite image. In: IEEE International Conference on Image Processing, pp. 3225–3228.
Tsai, V., 2006. A comparative study on shadow compensation of color aerial images in invariant color models. IEEE Trans. Geoscience and Remote Sensing 44(6), pp. 1661–1671.
Yi, S., Labate, D., Easley, G. R. and Krim, H., 2009. A shear-let approach to edge analysis and detection. IEEE Trans. Image Processing 18(5), pp. 929–941.