LAMPIRAN
Lampiran 1.
Uji Normalitas , Variansi ANOVA dan uji lanjutan Duncan Intensitas Warna
Tests of Normalitykosentrasi WPI Kolmogorov-Smirnova Shapiro-Wilk Statistic df Sig. Statistic Df Sig.
nilai L 10% .262 3 . .956 3 .598 15% .253 3 . .964 3 .637 20% .178 3 . .999 3 .952 Nilai a 10% .204 3 . .993 3 .843 15% .243 3 . .972 3 .679 20% .175 3 . 1.000 3 1.000 nilai b on1 10% .331 3 . .865 3 .281 15% .201 3 . .994 3 .856 20% .369 3 . .788 3 .087
a. Lilliefors Significance Correction
ANOVA Sum of
Squares Df Mean Square F Sig.
nilai L Between Groups 38.861 2 19.431 20.457 .002
Within Groups 5.699 6 .950
Total 44.560 8
Nilai a Between Groups .019 2 .010 1.829 .240
Within Groups .032 6 .005
Total .051 8
nilai b Between Groups 4.032 2 2.016 7.771 .022
Within Groups 1.557 6 .259 Total 5.589 8 nilai L Duncana kosentrasi WPI N
Subset for alpha = 0.05
1 2
10% 3 64.85000
15% 3 68.52667
20% 3 69.73667
Sig. 1.000 .179
Means for groups in homogeneous subsets are displayed.
Nilai a
Duncan
akosentrasi
WPI
N
Subset for
alpha = 0.05
1
15%
3
4.43333
20%
3
4.48000
10%
3
4.54667
Sig.
.116
Means for groups in homogeneous
subsets are displayed.
a. Uses Harmonic Mean Sample Size =
3.000.
nilai b
Duncan
akosentrasi
WPI
N
Subset for alpha =
0.05
1
2
15%
3
12.26000
20%
3
12.33667
10%
3
13.71667
Sig.
.860
1.000
Means for groups in homogeneous subsets are
displayed.
a. Uses Harmonic Mean Sample Size = 3.000.
Lampiran 2.
Uji Normalitas, Analisa varians ANOVA dan ujia lanjutan Duncan Total Padatan
Tests of Normality
konsentrasi WPI Kolmogorov-Smirnova Shapiro-Wilk Statistic df Sig. Statistic Df Sig.
total padatan Kontrol .260 3 . .958 3 .605
WPI 10% .253 3 . .964 3 .637
WPPI 15% .232 3 . .980 3 .726
wpi 20% .175 3 . 1.000 3 1.000
a. Lilliefors Significance Correction
ANOVA
Total padatan
Sum of Squares
df
Mean Square
F
Sig.
Between Groups
2.874
3
.958
202.739.000
Within Groups
.038
8
.005
Total
2.912
11
Total padatan Duncana kosentrasi wpi NSubset for alpha = 0.05
1 2 3 kontrol 3 1.4867 wpi 10% 3 2.2567 wpi 20% 3 2.6467 wpi 15% 3 2.7200 Sig. 1.000 1.000 .228
Means for groups in homogeneous subsets are displayed. a. Uses Harmonic Mean Sample Size = 3.000.
Correlations
total padatan
konsentrasi WPI total padatan Pearson Correlation 1 .928**
Sig. (2-tailed) .000
N 12 12
konsentrasi WPI Pearson Correlation .928** 1
Sig. (2-tailed) .000
N 12 12
**. Correlation is significant at the 0.01 level (2-tailed).
Lampiran 3.
Uji Normalitas, Analisa varians ANOVA dan korelasi Pearson Aktivitas Air (aw)
Tests of Normality
bkosentrasi
wpi
Kolmogorov-Smirnov
aShapiro-Wilk
Statistic
Df
Sig.
Statistic
Df
Sig.
water
activity
wpi 10%
.253
3
.
.964
3
.637
wpi 15%
.292
3
.
.923
3
.463
wpi 20%
.253
3
.
.964
3
.637
a. Lilliefors Significance Correction
b. There are no valid cases for water aktivity when kosentrasi wpi = 4.000. Statistics cannot
be computed for this level.
ANOVA water activity
Sum of
Squares Df Mean Square F Sig.
Between Groups .000 2 .000 3.020 .124 Within Groups .000 6 .000 Total .000 8 Correlations kosentrasi wpi water aktivity kosentrasi wpi Pearson Correlation 1 -.702*
Sig. (2-tailed) .035
N 12 9
water activity Pearson Correlation -.702* 1
Sig. (2-tailed) .035
N 9 9
*. Correlation is significant at the 0.05 level (2-tailed).
Lampiran 4
. Uji Normalitas, Analisa Varians ANOVA dan Korelasi Pearson Protein kasar
Tests of Normalitykosentrasi wpi Kolmogorov-Smirnova Shapiro-Wilk Statistic df Sig. Statistic Df Sig. crude protein dim ensi on1 wpi 10% .218 3 . .987 3 .785 wpi 15% .288 3 . .929 3 .485 wpi 20% .234 3 . .978 3 .719 kontrol .292 3 . .923 3 .463
a. Lilliefors Significance Correction
ANOVA crude protein
Sum of
Squares df Mean Square F Sig.
Between Groups 8083.418 3 2694.473 1926.722 .000
Within Groups 11.188 8 1.398
Total 8094.606 11
Correlations
kosentrasi wpi crude protein kosentrasi wpi Pearson Correlation 1 -.670*
Sig. (2-tailed) .017
N 12 12
crude protein Pearson Correlation -.670* 1
Sig. (2-tailed) .017
Correlations
kosentrasi wpi crude protein kosentrasi wpi Pearson Correlation 1 -.670*
Sig. (2-tailed) .017
N 12 12
crude protein Pearson Correlation -.670* 1
Sig. (2-tailed) .017
N 12 12
*. Correlation is significant at the 0.05 level (2-tailed).
Lampiran
5
. Uji Normalitas, Analisa Variansi ANOVA dan Korelasi Pearson kelarutan
Tests of Normalitykosentrasi WPI Kolmogorov-Smirnova Shapiro-Wilk Statistic df Sig. Statistic Df Sig. nilai kelarutan dim
ensi on1
WPI 10% .314 3 . .893 3 .363
WPI 15% .253 3 . .964 3 .637
WPI 20% .222 3 . .985 3 .767
a. Lilliefors Significance Correction
ANOVA nilai kelarutan
Sum of
Squares df Mean Square F Sig.
Between Groups 1.211 2 .605 .648 .556
Within Groups 5.608 6 .935
Total 6.819 8
Correlations
kosentrasi
WPI nilai kelarutan
kosentrasi WPI Pearson Correlation 1 -.274
Sig. (2-tailed) .476
N 9 9
nilai kelarutan Pearson Correlation -.274 1
Sig. (2-tailed) .476
N 9 9
Lampiran 6.
Uji Normalitas, variansi ANOVA dan korelasi Pearson Kandungan Air
Tests of Normalitykosentrasi wpi Kolmogorov-Smirnova Shapiro-Wilk Statistic df Sig. Statistic Df Sig.
moisture bubuk wpi 10% .219 3 . .987 3 .780
wpi 15% .210 3 . .991 3 .819
wpi 20% .361 3 . .807 3 .132
ANOVA moisture bubuk
Sum of
Squares df Mean Square F Sig.
Between Groups 1.390 2 .695 4.574 .062 Within Groups .912 6 .152 Total 2.302 8 Correlations kosentrasi wpi moisture bubuk
kosentrasi wpi Pearson Correlation 1 -.234
Sig. (2-tailed) .544
N 9 9
moisture bubuk Pearson Correlation -.234 1
Sig. (2-tailed) .544
N 9 9
Lampiran 7.
Uji Normalitas, variansi ANOVA dan Korelasi Pearson Aktivitas antioksidan
Tests of Normalitykosentrasi wpi Kolmogorov-Smirnova Shapiro-Wilk Statistic df Sig. Statistic df Sig. antioksidan bubuk dim
ensi on1
wpi 10% .275 3 . .943 3 .541
wpi 15% .331 3 . .865 3 .281
wpi 20% .342 3 . .845 3 .227
a. Lilliefors Significance Correction
ANOVA antioksidan bubuk
Sum of
Squares df Mean Square F Sig.
Between Groups 204.542 2 102.271 55.276 .000 Within Groups 11.101 6 1.850 Total 215.643 8 Correlations kosentrasi wpi antioksidan bubuk
kosentrasi wpi Pearson Correlation 1 .973**
Sig. (2-tailed) .000
N 9 9
antioksidan bubuk Pearson Correlation .973** 1
Sig. (2-tailed) .000
N 9 9
Lampiran 8.
Uji variansi ANOVA dan Korelasi Konsentrasi WPI terhadap parameter uji serbuk
ANOVASum of
Squares df Mean Square F Sig.
moisture bubuk Between Groups 1.390 2 .695 4.574 .062
Within Groups .912 6 .152
Total 2.302 8
water activity Between Groups .000 2 .000 3.020 .124
Within Groups .000 6 .000
Total .000 8
antioksidan bubuk Between Groups 204.542 2 102.271 55.276 .000
Within Groups 11.101 6 1.850
Total 215.643 8
kelarutan bubuk Between Groups 1.211 2 .605 .648 .556
Within Groups 5.608 6 .935
Total 6.819 8
Total padatan Between Groups .372 2 .186 89.080 .000
Within Groups .013 6 .002
Total .385 8
crude protein Between Groups 187.022 2 93.511 55.408 .000
Within Groups 10.126 6 1.688 Total 197.148 8 Correlations kosentrasi wpi moisture bubuk water activity antioksidan bubuk
kosentrasi wpi Pearson Correlation 1 -.234 -.702* .973**
Sig. (2-tailed) .544 .035 .000
N 9 9 9 9
water activity Pearson Correlation -.702* .012 1 -.619
Sig. (2-tailed) .035 .975 .075
N 9 9 9 9
antioksidan bubuk Pearson Correlation .973** -.270 -.619 1
Sig. (2-tailed) .000 .482 .075
N 9 9 9 9
Total padatan Pearson Correlation .770* -.580 -.440 .804**
Sig. (2-tailed) .015 .102 .236 .009
N 9 9 9 9
crude protein Pearson Correlation .962** -.049 -.761* .922**
Sig. (2-tailed) .000 .901 .017 .000
N 9 9 9 9
*. Correlation is significant at the 0.05 level (2-tailed). **. Correlation is significant at the 0.01 level (2-tailed).
Lampiran 9.
Kromatogram HPLC
kurkumin
Konsentrasi 10%
Konsentrasi 15%
Lampiran 10.
Analisa
Uji tahap pertama Friedman dan wilcoxon sensori Ranking
Friedman Test
Ranks Mean Rank 20% WPI 1.34 15% WPI 1.97 10% WPI 2.69 Test Statisticsa N 35 Chi-square 31.600 df 2 Asymp. Sig. .000 a. Friedman TestTest Statisticsc
15% WPI - 20% WPI 10% WPI - 20% WPI 10% WPI - 15% WPI 15% WPI - 10% WPI
Z -2.809a -4.986a -3.104a -3.104b
Asymp. Sig. (2-tailed) .005 .000 .002 .002
a. Based on negative ranks. b. Based on positive ranks. c. Wilcoxon Signed Ranks Test
Test Statisticsc
20% WPI - 10% WPI 20% WPI - 15% WPI
Z -4.986b -2.809b
Asymp. Sig. (2-tailed) .000 .005
b. Based on positive ranks. c. Wilcoxon Signed Ranks Test
Lampiran 11.
Analisa uji tahap kedua Friedman dan Wilcoxon sensori Rating
Friedman Test Ranks Mean Rank Rating 10% 1.97 Rating kontrol 1.03 Test Statisticsa N 35 Chi-square 31.114 df 1 Asymp. Sig. .000 a. Friedman Test
Wilcoxon Signed Ranks Test
Ranks
N Mean Rank Sum of Ranks Rating 10% - Rating control Negative Ranks 1a 18.00 18.00 Positive Ranks 34b 18.00 612.00 Ties 0c Total 35
a. Rating 10% < Rating control b. Rating 10% > Rating control c. Rating 10% = Rating control
Test Statisticsb
Rating 10% - Rating kontrol
Z -5.578a
Asymp. Sig. (2-tailed) .000
a. Based on negative ranks. b. Wilcoxon Signed Ranks Test
Lampiran 12. Daftar Nama panelis
no Nama 1 catherine 2 Arya 3 Nia 4 Martinus 5 Nasbi 6 Bosco 7 Rehmel 8 Nonik 9 Wynda 10 Yoan 11 Anastasia 12 Claudia 13 Monica 14 Gloria 15 Deshinta 16 Maria 17 Jovan no Nama 18 edwin tanadi 19 Yosephine dIana 20 sarah puji Astuti 21 Nikko 22 Aurelia 23 mayer 24 Windu 25 dhanang 26 Junet 27 Christin 28 Tiwi 29 Jonathan 30 Eggy 31 Nella 32 Catarina 33 Mey 34 Heri 35 Arwen
Lampiran 13. Lembar Kerja dan Lembar Penilaian Uji Penerimaan Rasa
WORKSHEET UJI RATING HEDONIC
Tgl Uji : Jenis sample :
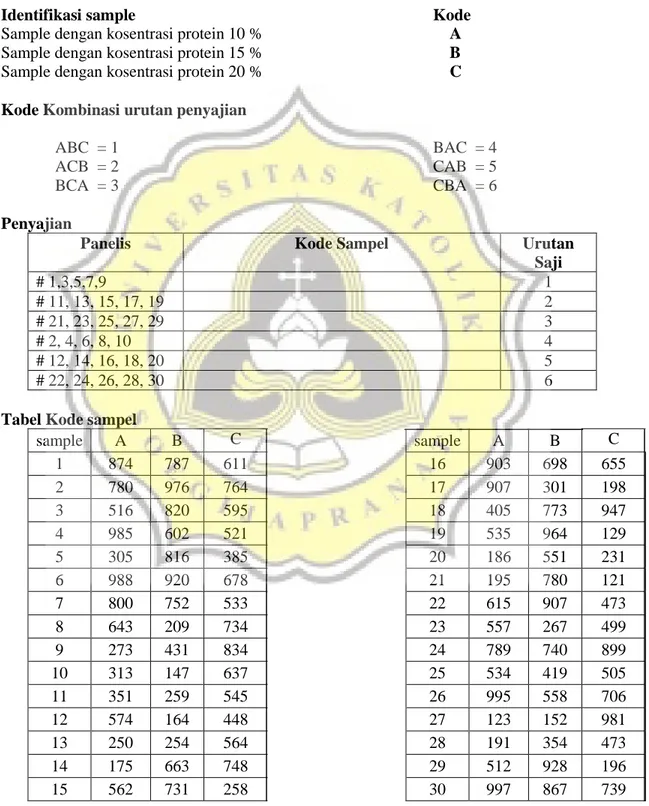
Identifikasi sample Kode
Sample dengan kosentrasi protein 10 % A Sample dengan kosentrasi protein 15 % B Sample dengan kosentrasi protein 20 % C Kode Kombinasi urutan penyajian
ABC = 1 ACB = 2 BCA = 3 BAC = 4 CAB = 5 CBA = 6 Penyajian
Panelis Kode Sampel Urutan
Saji # 1,3,5,7,9 1 # 11, 13, 15, 17, 19 2 # 21, 23, 25, 27, 29 3 # 2, 4, 6, 8, 10 4 # 12, 14, 16, 18, 20 5 # 22, 24, 26, 28, 30 6
Tabel Kode sampel
sample A B C 1 874 787 611 2 780 976 764 3 516 820 595 4 985 602 521 5 305 816 385 6 988 920 678 7 800 752 533 8 643 209 734 9 273 431 834 10 313 147 637 11 351 259 545 12 574 164 448 13 250 254 564 14 175 663 748 15 562 731 258 sample A B C 16 903 698 655 17 907 301 198 18 405 773 947 19 535 964 129 20 186 551 231 21 195 780 121 22 615 907 473 23 557 267 499 24 789 740 899 25 534 419 505 26 995 558 706 27 123 152 981 28 191 354 473 29 512 928 196 30 997 867 739
UJI HEDONIK RATING
Tanggal Uji : Jenis Sample : Identitas sample Sample control = A Sample terpilih = BKode Urutan penyajian
Untuk urutan penyajian karena hanya ada 2 sample maka tidak ada aturan khusus
Penyajian
Panelis Kode Sampel B Urutan
Saji
#1,2,3,4,5,6 . . .30 -
Tabel Kode sample sample Kontrol 1 606 2 831 3 654 4 565 5 732 6 790 7 722 8 380 9 740 10 989 11 395 12 641 13 378 14 908 15 655 sample Kontrol 16 140 17 481 18 340 19 637 20 931 21 387 22 398 23 335 24 741 25 403 26 358 27 942 28 254 29 311 30 353
Score sheet UJI 1 TRACEHOLD Kode Uji : Tanggal : Nama : Jenis Sample : Instruksi :
Dihadapan anda telah tersedia 3 sample, cicipi sample secara berurutan dari kiri ke kanan. Anda harus memberikan penilaian terhadap ketiga sample tersebut dengan mengurutkan berdasarkan tingkat kepahitanya. Lakukan kumur dengan air mineral yang tersedia setiap akan menguji sampel dan seterusnya sampai dengan sampel terakhir. Nyatakan penilaian anda pada kolom yang tersedia dengan menuliskan angka disamping no sample sesuai urutan penilain anda. Sample dengan urutan terbawah menurut penilaian anda, akan digunakan pada uji 2.
Atribut : Rasa pahit
No sample Urutan sample
……… ………
………….. . ………
Score sheet
UJI 2 HEDONIK RATING
Kode Uji : Tanggal :
Nama :
Jenis Sample :
Instruksi :
Dihadapan anda telah tersedia 2 sample, salah satunya adalah sample pilihan anda pada uji sebelumnya dan sample pembanding. Lakukan penilaian pada kedua sample tersebut dengan memberikan tanda (√) pada tingkat kesukaaan menurut penilaian anda untuk masing-masing sample secara terpisah, dan kemudian anda bandingkan diantara kedua sample tersebut, manakah sample yang paling anda sukai berdasarkan antribut rasa dengan memberikan tanda (√) pada sample yang paling anda suka.
Atribut : Rasa pahit
Uji lanjutan Kode Sample
Tingkat Kesukaan tiap sampel Tidak
suka
Kurang suka
Suka Suka sekali Sangat suka