Perusahaan Gas Negara
Bloomberg: PGAS.IJ | Reuters: PGAS.JK
Samuel Equity Research 31 January 2017
www.samuel.co.id
Energy holding for future prospect
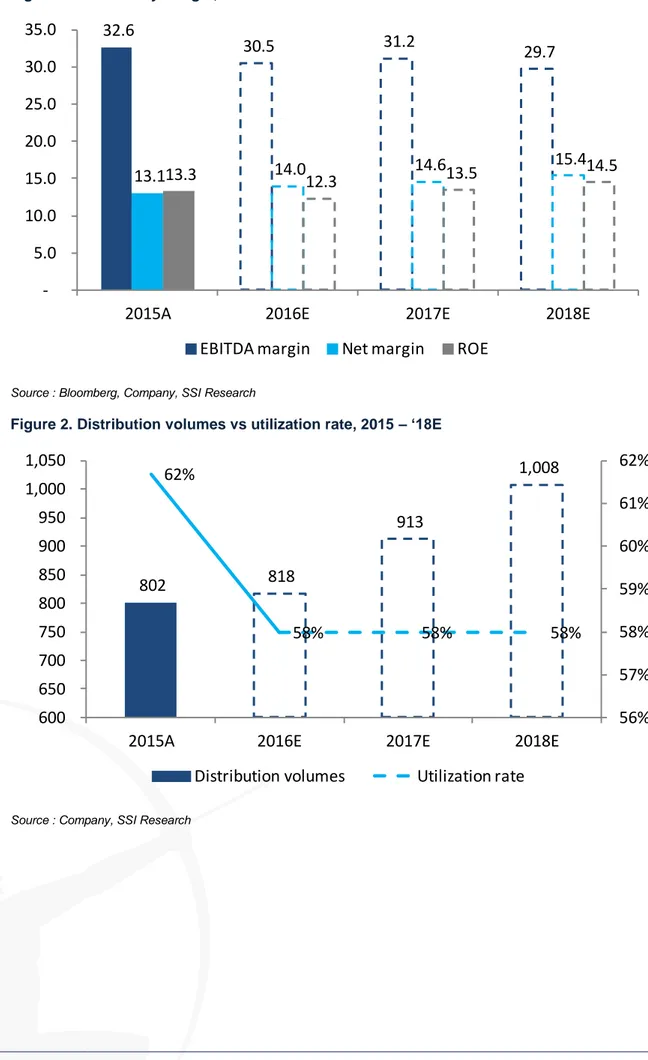
Laba bersih diperkirakan tumbuh 21% y-y. Pembentukan energy holding disinyalir akan terealisasi. Mempertahankan BUY untuk PGAS, dengan TP Rp 3,375/lembar saham, 17E’PE: 12.1x, dan PBV: 1.6x). Laba bersih kami estimasi tumbuh 21% y-y di 2017, dengan … Kami estimasikan laba bersih PGAS 2017 tumbuh 21% y-y menjadi US$487 juta, merefleksikan ekspektasi marjin gas distribusi perseroan sebesar US$3.1/mmbtu. Saat ini, kami belum memasukkan prospek Pertagas dalam valuasi kami, menunggu kejelasan skema pembentukan holding energi ini. … estimasi kenaikan volume distribusi 12% y-y. Ekonom kami memperkirakan, kenaikan harga beberapa komoditas utama akan mampu mendorong pertumbuhan ekonomi (SSI GDP17F: 5.2%), sehingga Perseroan yang 97% pelanggan utamanya adalah kalangan industri, kami estimasi mampu mencetak 12% y-y pertumbuhan volume distribusi.
Ekspektasi realisasinya pembentukan holding energi. Direktur Utama PT Pertamina (Persero) Dwi Soetjipto, menyatakan pembentukan energy
holding tinggal menunggu terbitnya peraturan pemerintah (PP). Sosialisasi
internal antara Pertamina dan perseroan sejak Desember 2016 memberikan sinyal kelanjutan dari realisasi energy holding.
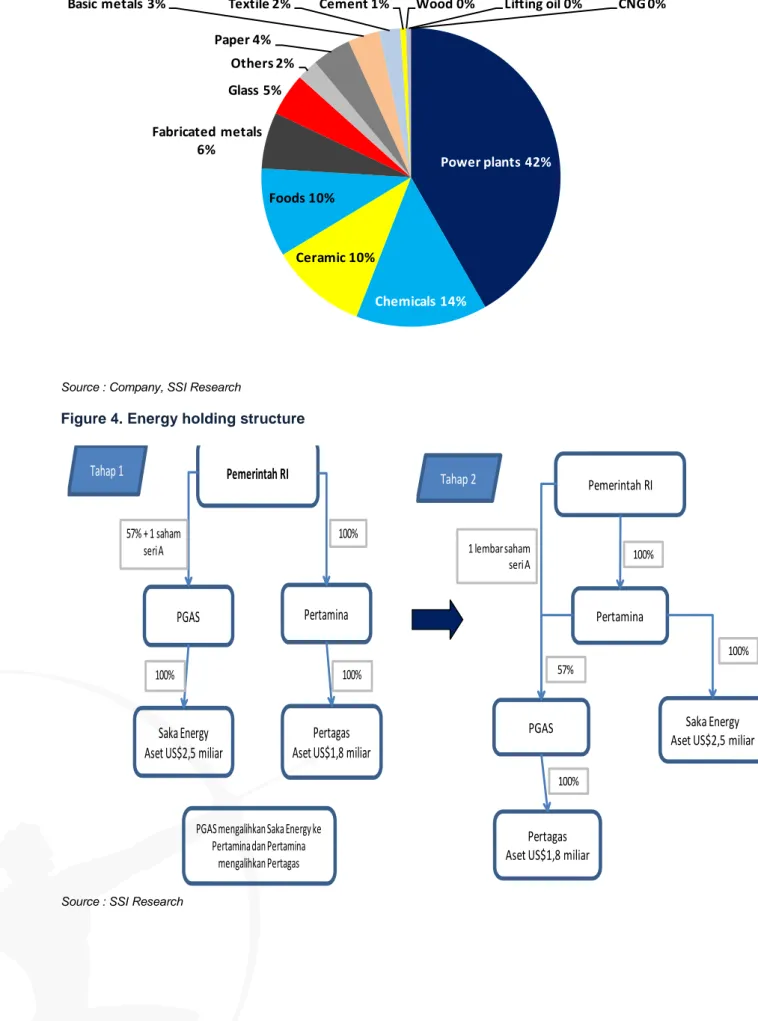
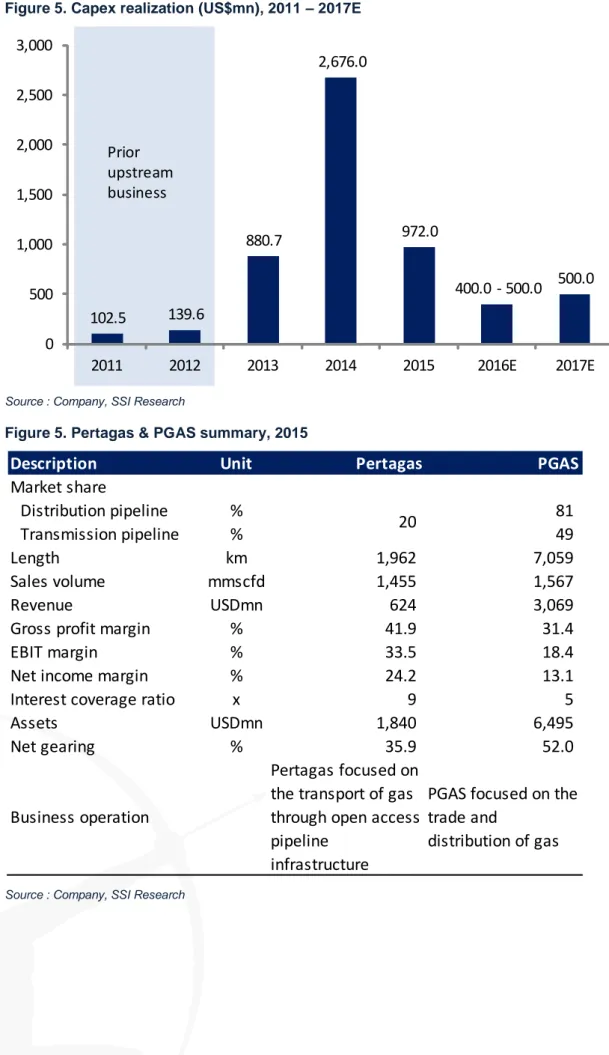
Pertukaran Saka – Pertagas meminimalisir dana akuisisi PGAS. Di 2015, Saka Energi memiliki asset sebelum eliminasi sebesar US$2,5 miliar sedangkan Pertagas US$1,8 miliar, sehingga transaksi ini memungkinkan PGAS untuk seminim mungkin mengeluarkan dana dalam akuisisi Pertagas. Belanja modal terfokus untuk pengembangan infrastruktur gas. Di 2017, perseroan mengalokasikan US$500 juta belanja modal dengan 50% dari anggaran untuk ekspansi hulu, sehingga apabila aset hulu dialihkan ke Pertamina, perseroan memiliki ruang dana lebih besar untuk memenuhi target pembangunan 1.685km pipa gas bumi hingga 2019.
Mempertahankan BUY dengan TP Rp 3.375: Kami mempertahankan rekomendasi BUY dengan target price (TP) di Rp 3.375, merefleksikan P/E ‘17 12x dan potensi upside 17%. Resiko dari rekomendasi kami adalah lebih buruknya volume distribusi dan berlarutnya pembentukan energy holding.
Target Price Rp 3,375 Last Price Rp 2,880 Potential Upside 17.2% JCI Index 5,400 Share Issued (m n) 24,242 Market Cap. (Rp bn) 64,967 52-Weeks High/Low 3,520/ 2,170 Avg Daily Vol (m n) 51.97
Free Float 43%
Nom inal Value 100
EPS 2017 Rp 281
Relative to JCI Chart
Com pany Background
Shareholder Structure
Republik Indonesia 57.0%
Capital group 14.3%
Public 28.8%
Buy (Maintain)
PT Perusahaan Gas Negara Tbk beroperasi di bidang distribusi dan transmisi gas alam untuk pengguna industri, komersial dan rumah tangga. Belakangan, perusahaan juga masuk ke bisnis hulu migas dengan mengakuisisi beberapa blok migas.
-80% -60% -40% -20% 0% 20%
Jan-15 Jun-15 Nov-15 Apr-16 Sep-16
PGAS JCI
Y/E Dec (US$ mn) 15A 16E 17E 18E
Revenue 3,069 2,885 3,339 3,785 EBIT 565 565 668 778 EBITDA 1,002 880 1,041 1,126 Net Profit 401 404 487 582 EPS (Rp/share) 232 233 281 336 Book value per share 1,744 1,892 2,088 2,317 DPS (Rp/share) 154.4 88.4 82.6 99.7 Dividend Yield (%) 5.4 3.1 2.9 3.5 EV/EBITDA (x) 7.5 8.5 7.2 6.7 P/E Ratio (x) 12.4 12.3 10.2 8.6 P/BV Ratio (x) 1.7 1.5 1.4 1.2 Net Gearing (%) 52.0 44.0 24.5 3.9 Forecast and Valuation (at closing price Rp2,880 per share)
Arandi Ariantara +62 21 2854 8148
www.samuel.co.id Page 2 of 6
Figure 1. Profitability margin, 2015 – ‘18E
Source : Bloomberg, Company, SSI Research
Figure 2. Distribution volumes vs utilization rate, 2015 – ‘18E
Source : Company, SSI Research
32.6
30.5
31.2
29.7
13.1
13.3
14.0
12.3
14.6
13.5
15.4
14.5
-5.0
10.0
15.0
20.0
25.0
30.0
35.0
2015A
2016E
2017E
2018E
EBITDA margin
Net margin
ROE
802
818
913
1,008
62%
58%
58%
58%
56%
57%
58%
59%
60%
61%
62%
600
650
700
750
800
850
900
950
1,000
1,050
2015A
2016E
2017E
2018E
www.samuel.co.id Page 3 of 6
Figure 3. 9M16 Gas Distribution Customers
Source : Company, SSI Research
Figure 4. Energy holding structure
Source : SSI Research
Power plants 42% Chemicals 14% Ceramic 10% Foods 10% Fabricated metals 6% Glass 5% Others 2% Paper 4%
Basic metals 3% Textile 2% Cement 1% Wood 0% Lifting oil 0% CNG 0%
Tahap 1
Pemerintah RI
PGAS
Pertamina
Saka Energy
Aset US$2,5 miliar
Pertagas
Aset US$1,8 miliar
57% + 1 sahamseriA
100%
100% 100%
PGAS mengalihkan SakaEnergy ke Pertamina dan Pertamina
mengalihkan Pertagas
Tahap 2 Pemerintah RI
Pertamina
PGAS Saka Energy
Aset US$2,5 miliar
Pertagas Aset US$1,8 miliar 1 lembar saham
seri A 100%
57%
100%
www.samuel.co.id Page 4 of 6
Figure 5. Capex realization (US$mn), 2011 – 2017E
Source : Company, SSI Research
Figure 5. Pertagas & PGAS summary, 2015
Source : Company, SSI Research
102.5
139.6
880.7
2,676.0
972.0
400.0 - 500.0
500.0
0
500
1,000
1,500
2,000
2,500
3,000
2011
2012
2013
2014
2015
2016E
2017E
Prior
upstream
business
Description
Unit
Pertagas
PGAS
Market share
Distribution pipeline
%
81
Transmission pipeline
%
49
Length
km
1,962
7,059
Sales volume
mmscfd
1,455
1,567
Revenue
USDmn
624
3,069
Gross profit margin
%
41.9
31.4
EBIT margin
%
33.5
18.4
Net income margin
%
24.2
13.1
Interest coverage ratio
x
9
5
Assets
USDmn
1,840
6,495
Net gearing
%
35.9
52.0
Business operation
Pertagas focused on
the transport of gas
through open access
pipeline
infrastructure
PGAS focused on the
trade and
distribution of gas
20
www.samuel.co.id Page 5 of 6
Key Financials
Profit and Loss Cash Flow
(US$ mn) 15A 16E 17E 18E Yr-end Dec (US$ mn) 15A 16E 17E 18E Gas Distribution Revenue 2,613 2,536 2,886 3,255 EBIT 565 565 668 778 Other Revenue 456 348 454 530 Depreciation & amort. 436 316 373 348
Total Operating Revenue 3,069 2,885 3,339 3,785 Others (101) (2) 5 (59) Operating Expenses 2,503 2,320 2,672 3,007 Working capital (78) 19 (38) (24)
Operating profit 565 565 668 778 Operating cash flow 528 738 822 905
Operating margin (%) 18.4 19.6 20.0 20.6 Net - Capital expenditure (751) (469) (116) 12
EBITDA 1,002 880 1,041 1,126 Investing cash flow (222) 270 706 918
EBITDA margin (%) 32.6 30.5 31.2 29.7 Net -Borrowings 856 (69) (51) (32) Other income (expenses)(559) (361) (413) (377) Other financing (629) (141) (148) (187) Pre-tax profit 443 520 627 749 Financing cash flow 227 (210) (199) (219)
Income tax - net (40) (114) (138) (165) Net - Cash flow 5 60 507 699 Net profit 401 404 487 582 Cash at beginning 1,131 1,136 1,196 1,703 Net profit margin (%) 13.1 14.0 14.6 15.4 Cash at ending 1,136 1,196 1,703 2,401
Balance Sheet Key Ratios
Yr-end Dec (US$ mn) 15A 16E 17E 18E Yr-end Dec 15A 16E 17E 18E
Cash & ST Investment 1,136 1,196 1,703 2,401 ROE (%) 13.6 12.8 14.1 15.3 Receivables 287 271 314 355 ROA (%) 6.6 6.1 7.1 8.1 Inventories 43 65 75 82 Revenue growth (%) (5.7) (6.0) 15.8 13.3 Others 65 65 65 65 EBITDA growth (%) 2.3 (12.1) 18.2 8.2
Total current assets 1,530 1,596 2,156 2,903 EPS growth (% ) (39.5) 0.7 20.6 19.4
Net fixed assets 3,565 3,720 3,469 3,116 Interest coverage (x) 4.7 4.9 6.0 7.0 Other assets 1,400 1,390 1,384 1,378 Debt to equity (%) 89.7 80.6 71.6 63.7
Total assets 6,495 6,706 7,009 7,397 Net gearing (% ) 52.1 44.1 24.5 3.9
Payables 117 108 125 136
Debt 2,709 2,639 2,588 2,556 Major Assumptions
Other long term liabilities 646 680 678 691 Yr-end Dec 15A 16E 17E 18E
Total liabilities 3,472 3,427 3,391 3,383 Distribution Vol. (mmscfd) 802 818 913 1,008
Minority interest 2 2 2 2 Rate margin (USD/mmbtu) 3.4 3.1 3.1 3.3
Total equity 3,020 3,276 3,615 4,011
Distribution capacity
www.samuel.co.id Page 6 of 6
Research Team
Andy Ferdinand, CFA Head Of Equity Research, Strategy,
Banking, Consumer andy.ferdinand@samuel.co.id +6221 2854 8148
Rangga Cipta Economist rangga.cipta@samuel.co.id +6221 2854 8396
Muhamad Makky Dandytra, CFTe Technical Analyst makky.dandytra@samuel.co.id +6221 2854 8382 Akhmad Nurcahyadi, CSA Auto, Aviation, Cigarette, Construction
Healthcare, Heavy Equipment, Property akhmad.nurcahyadi@samuel.co.id +6221 2854 8144 Arandi Ariantara Cement, Telecommunication, Utility arandi.ariantara@samuel.co.id +6221 2854 8392 Marlene Tanumihardja Poultry, Retail, Small Caps marlene@samuel.co.id +6221 2854 8387 Sharlita Lutfiah Malik Mining, Plantation sharlita.malik@samuel.co.id +6221 2854 8339 Adde Chandra Kurniawan Research Associate adde.kurniawan@samuel.co.id +6221 2854 8338
Private Wealth Management
Evelyn Satyono Head of PWM / Institutional Sales evelyn.satyono@samuel.co.id +6221 2854 8380 Muhamad Alfatih CSA, CTA, CFTe Senior Technical Portfolio Advisor m.alfatih@samuel.co.id +6221 2854 8129 Ronny Ardianto Institutional Equity Sales ronny.ardianto@samuel.co.id +6221 2854 8399 Clarice Wijana Institutional Equity Sales clarice.wijana@samuel.co.id +6221 2854 8395 Fachruly Fiater Institutional Equity Sales fachruly.fiater@samuel.co.id +6221 2854 8325
Equity Sales Team
Kelvin Long Head of Equities kelvin.long@samuel.co.id +6221 2854 8150
Yulianah Institutional Equity Sales yulianah@samuel.co.id +6221 2854 8146
Lucia Irawati Retail Equity Sales lucia.irawati@samuel.co.id +6221 2854 8173
Online Trading Sales Team
Nugroho Nuswantoro Head of Marketing Online Trading nugroho.nuswantoro@samuel.co.id +6221 2854 8372
Wahyu Widodo Marketing wahyu.widodo@samuel.co.id +6221 2854 8371