JEJAK
Journal of Economics and Policy
http://journal.unnes.ac.id/nju/index.php/jejak
The Analysis of Human Resources Development in Central Java
Province 2009-2013
Yulia Pangastuti1
1Semarang State University, Indonesia
Permalink/DOI: http://dx.doi.org/10.15294/jejak.v8i2.6173
Received: Juli 2015; Accepted: Agustus 2015; Published: September 2015
Abstract
This study aims to analyze: (1) the influence of governmentexpenditureon education to HDI in Central Javafrom 2009 to 2013; (2)the influence of government expenditure on health to HDI in Central Java from 2009 to 2013; (3) theinfluence of population density to HDI inCentral Java from 2009 to 2013. Secondary data, from the Central Statistics Agency and Financial Bureau Secretaries of Central Java province in 2009-2013 were used. This study implemented panel data with Fixed Effect Model (FEM)method of Generalized Least Square (GLS). The results show that the governmment expenditure on education and health has positive and significant effect to HDI in Central Java. However, population density doesn’t significantlyaffect the HDI in Central Java.
Keywords: Government Education Expenditure, Government HealthExpenditure, Human Resource Development,
Population Density.
How to Cite: Pangastuti, Y. (2016). The Analysis of Human Resources Development in Central Java Province
2009-2013. JEJAK: Jurnal Ekonomi Dan Kebijakan, 8(2), 229-239. doi:http://dx.doi.org/10.15294/jejak.v8i2.6173
© 2015 Semarang State University. All rights reserved
Corresponding author :
Address: Kampus Unnes Sekaran, Semarang 50229 E-mail: [email protected]
230 Yulia Pangastuti, The Analysis of Human Resources Development in Central Java Province 2009-2013
INTRODUCTION
The potential of economics development of a country is heavily influenced by quantity and quality of resources from the physical resources and human resources (Todaro, 2006: 54). Economics development always becomes main attention to improve the standard of public welfare in a country, especially in developed country (Mahadiki and Santoso, 2013). Salim (2011:1) emphasized that the current development does not really prioritize on human development. Furthermore Iheoma (2012: 1) states that fundamental focus of economics development is Human Resources Development (HRD). This human resources development is in proxy from values of Human Development Index (HDI). Unites Nations Development Program (UNDP) tries to
compare status of economical social
development through HDI. HDI in Indonesia is in the amount of 0.68 which includes into medium human development category (UNDP, 2014). According to BPS (2014), Indonesia was
ranked 108th of 187 countries in the world.
Law number 23, 2014 and law number 33, 2004 state that regional autonomy and fiscal decentralization are new strategies for entering total reformation era in facing globalization and free trade (Keswara in Winarno, 2008:38). Therefore, every region is expected to optimize its potential to improve human resources who are qualified in order to compete and also
contribute in improving the economy
nationwide.
Central Java province has smallest gross domestic products contribution of 8.25% as well as second-bottom in the rate of regional domestic products of 5,81% (BPS, 2014). Based
on endogenous development, there is
integration technological innovation in
creating human capital as the main resources of productivity motorize mover of economic growth (Roomer 1990:25). The efforts to improve the human capital can support the enhancement of productivity and economic growth.
Human capital is the indicator which contributes in improving human resources development in one region. Human resources development refers to the ability of human efficiency to process raw materials to be goods or services. The effective education and health care service system can exploit the efficiency ability in human resources development (Ihoema, 2012: 2).
As stated in graphic 1 below, the highest
average of HDI is on 2009 – 2013 which was
occupied by Surakarta city at 78.24, while the lowest was occupied by Brebes city at 68.74. The phenomena of HDI value in Central Java province was increased by 74.05, but it was
decreased being ranked 4th in Java – Bali Island
because displaced by Bali Island (BPS, 2014). Therefore the HDI rank in Central Java province
in nationwide was 16th. The development of HDI
value in Central Java Province has increased but the rate has not increased as expected. Based on the Medium Term Development Plan (MTDP) on 2008-2013, the achievement of HDI in Central Java Province has not reached the target yet that has been set (Bappeda, 2009).
Source: Central Bureau of Statistics in 2014, processed data
Graphic 1. HDI value of Districts/Cities of Central Java Province
Public expenditures in developed countries have an active role in reducing regional disparities, creating infrastructure, economic growth, education, and research and development (Bhatia 2002 in Muritala 2011: 2) . The percentage of government expenditures in education of Central Java Province occupies the smallest percentage in Java – Bali and on 2009-2013. It was decreased by 1.8% (Directorate General of Fiscal Balance, 2009-2013). Education should absorb most of the public expenditures because it is public service which has spillover positive effect (Uche, 2013).
Health expenditures have a positive impact on human development because they
can affect the productivity of labor to be higher so that it can affect economic growth (Razmi, 2012: 11). In 2009-2013 there was an increase in the allocation of health expenditures by 9.8% in Bali Province and Jakarta by 3.5%. While the percentage was significantly decreased. The greatest was in Java-Bali. It occurred in Central Java province by 3% (Directorate General of Fiscal Balance, 2009-2013).
This fluctuation in the proportion of
government education and health
expenditures reflect the consistency of the government in exploring income sources in improving public services distribution.
60 65 70 75 80
KotaSurakarta KotaSemarangKotaSalatiga KotaMagelangSemarang Temanggung KotaPekalonganKotaTegal Klaten Sukoharjo KaranganyarPati KudusJepara Demak BanyumasPurworejo Rembang Magelang PurbalinggaCilacap Wonogiri PekalonganKebumen GroboganSragen BoyolaliTegal Blora WonosoboKendal Batang BanjarnegaraPemalang Brebes
HDI Value of DIstricts/Cities of Central Java Province 2009-2013
2013
2012 2011
232 Yulia Pangastuti, The Analysis of Human Resources Development in Central Java Province 2009-2013
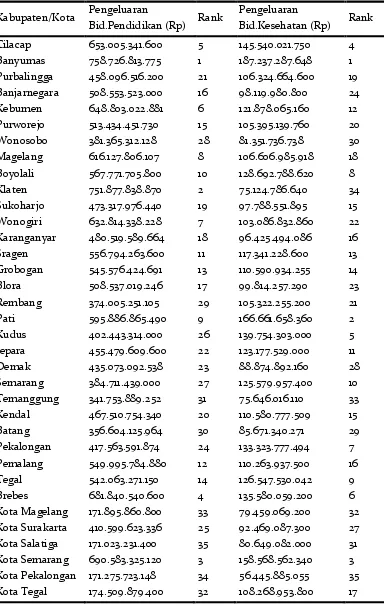
Tabel 1. Rata-rata Pengeluaran Pemerintah bidang pendidikan& kesehatan di Kabupaten/ Kota Provinsi Jawa Tengah
Kabupaten/Kota Pengeluaran
Bid.Pendidikan (Rp) Rank
Pengeluaran
Bid.Kesehatan (Rp) Rank
Cilacap 653.005.341.600 5 145.540.021.750 4
Banyumas 758.726.813.775 1 187.237.287.648 1
Purbalingga 458.096.516.200 21 106.324.664.600 19
Banjarnegara 508.553.523.000 16 98.119.980.800 24
Kebumen 648.803.022.881 6 121.878.065.160 12
Purworejo 513.434.451.730 15 105.395.139.760 20
Wonosobo 381.365.312.128 28 81.351.736.738 30
Magelang 616.127.806.107 8 106.606.985.918 18
Boyolali 567.771.705.800 10 128.692.788.620 8
Klaten 751.877.838.870 2 75.124.786.640 34
Sukoharjo 473.317.976.440 19 97.788.551.895 15
Wonogiri 632.814.338.228 7 103.086.832.860 22
Karanganyar 480.519.589.664 18 96.425.494.086 16
Sragen 556.794.263.600 11 117.341.228.600 13
Grobogan 545.576.424.691 13 110.590.934.255 14
Blora 508.537.019.246 17 99.814.257.290 23
Rembang 374.005.251.105 29 105.322.255.200 21
Pati 595.886.865.490 9 166.661.658.360 2
Kudus 402.443.314.000 26 139.754.303.000 5
Jepara 455.479.609.600 22 123.177.529.000 11
Demak 435.073.092.538 23 88.874.892.160 28
Semarang 384.711.439.000 27 125.579.957.400 10
Temanggung 341.753.889.252 31 75.646.016.110 33
Kendal 467.510.754.340 20 110.580.777.509 15
Batang 356.604.125.964 30 85.671.340.271 29
Pekalongan 417.563.591.874 24 133.323.777.494 7
Pemalang 549.995.784.880 12 110.263.937.500 16
Tegal 542.063.271.150 14 126.547.530.042 9
Brebes 681.840.540.600 4 135.580.059.200 6
Kota Magelang 171.895.860.800 33 79.459.069.200 32
Kota Surakarta 410.599.623.336 25 92.469.087.300 27
Kota Salatiga 171.023.231.400 35 80.649.082.000 31
Kota Semarang 690.583.325.120 3 158.568.562.340 3
Kota Pekalongan 171.275.723.148 34 56.445.885.055 35
Kota Tegal 174.509.879.400 32 108.268.953.800 17
Sumber : Biro Keuangan Provinsi Jawa Tengah tahun 2009-2013, data diolah.
Public services depend on innovation to develop the better ways to fulfill needs,
decentralization and regional autonomy are the instrument in realizing the priorities
development achievements, especially
priorities relate to the development of human resources in each region.
Accordingly, the phenomenon of high gaps on government education and health expenditures among the district/cities of Central Java province are shown in the following Table 1. The different allocation of
government education and health
expenditures reflect the government's efforts to explore potential source of local revenue
Increasing population density and urbanization encourage specialization and human investment so can fast accumulate new knowledge that can increase per capita income along with population growth. Becker (2007: 148). Keskinen (2008: 107) state that quality of population density depends on socio-economic, infrastructure, politics which have great impact on development.
According to BPS (2013) population density in Central Java province in 2013 is 1014 per inhabitants/km2. It is potential which is supported by government’s efforts of realization expenditure allocation utilization on education and health in Central Java Province.
Based on the background above, the research questions are:
1) How does government education
expenditure influence HDI in Central Java province in 2009 to 2013;
2) How does government health
expenditure influence HDI in Central Java Province in 2009-2013; and
3) How does population density influence
HDI in Central Java province in 2009-2013.
RESEARCH METHODS
This study uses panel data which is the combination of data cross section of 35 districts/cities and time series in 2009-2013 which are from the Central Statistics Agency (BPS) and the Region Secretary Financial Bureau of Central Java Province. While the variables and operational definitions of variables are as follows:
Human Development Index (HDI) is an indicator of all of human development achievements which are founded on three dimensions; health, education and decent living with the unit (scale 1-100).
Government education expenditures are the government budget allocation which is arranged in APBD in education sector in certain time (Rupiah).
Government health expenditures are the government's budget allocation arranged in APBD in health sector in certain time (Rupiah).
Population density government budget allocation is arranged in APBD the health sector in certain time (per km2).
Data Analysis Method
According to Gujarati (2012: 237), panel data is a combination of individual data (cross section) and time series data. Based on advantages of panel data, it has implications which should not be necessarily tested by classics assumption like multi-colinearity,
heterocedasticity, autocorrelation, and
234 Yulia Pangastuti, The Analysis of Human Resources Development in Central Java Province 2009-2013
common effect, fixed effect and random effect.
Common effect is estimating panel data technique that does not address to the dimension between individuals and between time. Fixed effect is estimating panel data technique that uses dummy variable to see any intercept differences. Random effect is a technique of estimating the disturbance variable that consists of combination disturbance variable between time series and cross section individually.
Based on the theoretical framework of this research, the dependent variable of this research is HDI. While the independent
variable is government education
expenditures (LogPNGLPEN), government health expenditure (LogPNGLKES), and population density (KP). Then the equation of this study is as follows:
HDIit = β0 + β1LogPNGLPENDit +
β2LogPNGLKESit + β3KPit + μit…...(1)
Explanation:
HDI= human development index (scale 1-100)
LogPNGLPEND= government education
expenditures (USD)
LogPNGLKES= government health
expenditures (Rp)
KP = population density (per km2) Β = regression coefficients;
i = district / city i (i = 1,2,3, ... 35); t = year-to-t (2009-2013);
μit = residual value outside models.
After estimating three models panel data estimation, the next step is determine the best model among the common effect, fixed effect and random effect with two stages; they are Chow test and Hausman test.
RESULTS AND DISCUSSION
Regression Result Analysis
In this study, there are three models of panel data estimation models, they are common effect, fixed effect model and random effect model. The results of three panel data estimation models in table 2. After estimating three models which are selected then doing two phases of statistics phases. Based on chow test results, F of cross section at 287.899814 with p-value at F cross-section
of 0.0000, significant at α = 5%. Thus, the
decision of best model to use is FEM. Hausman test result is random cross-section of 11.951433 with p-value of 0.0076, significant at α = 5%. Thus, the decision of best model to use is the FEM.
Determining the best models beside based on statistical testing of chow test, hausman test is also based on non-statistical considerations on one of the considerations of Judge observation (Gujarati 2012: 255). Cross-section units of this study are 35 districts/cities of Central Java Province. In other words, the cross-sectional units taking of this study have not drawn randomly, then the appropriate panel data model to use is FEM. After determining the best model regression function then measuring the accuracy of regression function of of its goodness of fit.
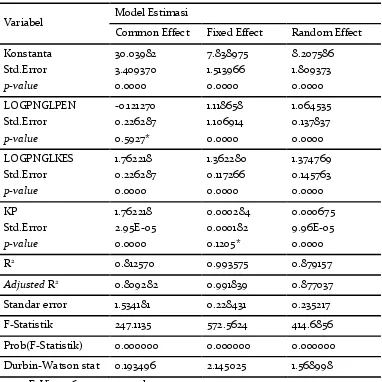
The value of adjusted R2 of FEM on
Table 2 is 0.991839. It means that 99% of HDI variables in Central Java Province are explained by the variation of the variable models of government education expenditure
(logPNGLPEND), government health
expenditure (logPNGLKES), and population density (KP). While the rest 1% is explained by other variables outside the model.
Table 2. Panel Data Estimation Results
Variabel Model Estimasi
Common Effect Fixed Effect Random Effect
Konstanta
Adjusted R2 0.809282 0.991839 0.877037
Standar error 1.534181 0.228431 0.235217
F-Statistik 247.1135 572.5624 414.6856
Prob(F-Statistik) 0.000000 0.000000 0.000000
Durbin-Watson stat 0.193496 2.145025 1.568998
Source: E-Views 6.0 output result Note: *) not significant at α = 5%.
The F statistical test is a statistical test to find out the effect of simultaneous independent variable on the dependent variable. According to the table 2 in the fixed effect model, it is obtained that Fstatistic of 572.5624 and Ftable (numerator df 2; denumerator 172) by 3.05, so Fstatistic > Ftable (572.5624 > 3.05) with a p-value 0.00000. Thus, the effect of government education expenditures, government health
expenditures, and population density
simultaneously affect the HDI in Central Java province in 2009-2013. T statistical test is a statistical test to find out the partial effects of the dependent variable. Based on statistical
test government education expenditure, it has tcount > ttable (10.46313> 1,653) with a p-value
of 0.0000, then government health
236 Yulia Pangastuti, The Analysis of Human Resources Development in Central Java Province 2009-2013
Based on the results of estimation, this study uses the best model; FEM with Generalized Least Square method (GLS). The equations in the FEM model are as follows:
HDIit= 0 - 1 logPNGLPENDit + 2
logPNGLKESit +3KPit + uit
HDIit= 7.838975 + 1.118658 logPNGLPENDit +
1.362280logPNGLKESit +0.000284 KPit + uit
Std error (1.513966) (0.106914) (0.116074) (0.000182)
Prob (0.0000) (0.0000) (0.0000) (0.1205)
The constant value of 7.838975 shows that if government education and health expenditures and population density are assumed to be constant or zero, then the HDI value will increase by 7.83.
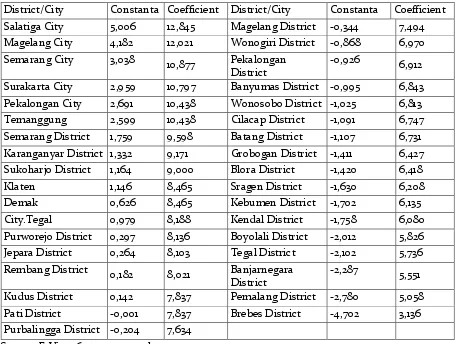
The estimation results of FEM can show the uniqueness of the heterogeneity value of intercept in the districts/cities in Central Java Province. Individual effects are gained from constant values of districts/cities and added with the constant values of FEM.
Based on Table 3, the coefficient is impactful
if the independent variable is zero or constant towards human resource development is Brebes district, Pemalang District, and District Banjarnegara. While coefficient values which affect if the independent variable is zero or constant to the human resource development is Salatiga, Magelang city, and Semarang city. Difference coefficient
may be caused by local government’s in the
improvement of human resource
development in Central Java Province.
Table 3. Districts/Cities Individual Effects
District/City Constanta Coefficient District/City Constanta Coefficient
Salatiga City 5,006 12,845 Magelang District -0,344 7,494
Magelang City 4,182 12,021 Wonogiri District -0,868 6,970
Semarang City 3,038 10,877 Pekalongan
District
-0,926 6,912
Surakarta City 2,959 10,797 Banyumas District -0,995 6,843
Pekalongan City 2,691 10,438 Wonosobo District -1,025 6,813
Temanggung 2,599 10,438 Cilacap District -1,091 6,747
Semarang District 1,759 9,598 Batang District -1,107 6,731
Karanganyar District 1,332 9,171 Grobogan District -1,411 6,427
Sukoharjo District 1,164 9,000 Blora District -1,420 6,418
Klaten 1,146 8,465 Sragen District -1,630 6,208
Demak 0,626 8,465 Kebumen District -1,702 6,135
City.Tegal 0,979 8,188 Kendal District -1,758 6,080
Purworejo District 0,297 8,136 Boyolali District -2,012 5,826
Jepara District 0,264 8,103 Tegal District -2,102 5,736
Rembang District 0,182 8,021 Banjarnegara
District
-2,287 5,551
Kudus District 0,142 7,837 Pemalang District -2,780 5,058
Pati District -0,001 7,837 Brebes District -4,702 3,136
Purbalingga District -0,204 7,634
Discussion
The coefficient of government
education expenditure regression of 1.118658 shows the amount of positive influence on HDI in districts/cities of Central Java Province. It means that if government education is increased by 1%, HDI will rise by 1.11 with ceteris paribus assumption. The result of this study is in line with Sasana’s research (2012: 11) which explains that the local government has a positive and significant relationship towards HDI in the districts/cities of Central Java Province.
Based on the phenomenon of
government education expenditure shows that not all of local authorities improve the allocation of education annually. Whereas Uche (2013: 63) states that the government should be consistent in increasing the budget allocation, because it is very important for the national economy. Additionally, Guisan (2009: 122) emphasizes that improving the quality of education should be based on the level of the population in each region,so the population is offset by an increase in the quality of education. Availability of adequate educational infrastructure that can provide ease of public access to get the right to improve the standard of living through education. In addition, the indicators of educational attainment of each work unit area is expected to be in sync with the level of need in the districts/cities of Central Java Province.
The regression coefficient of
government health expenditures of 1.362280 shows how big the positive influence is
towards HDI significantly in the
districts/cities of Central Java Province. It means that if the government health expenditures increased by 1%, the HDI will rise by 1.36 assuming ceteris paribus. The health expenditures have positive and significant effects on HDI in Indonesia
Government efforts related to equity of health expenditures are expected to reduce inequality in human resource development in Central Java Province. Programs which aim to increase quality access of health services is public health insurance and regional health insurance can provide ease of health nursing costs for poor and disadvantaged people. Health insurance programs are expected on targets and equitable by doing direct shooting towards the targets who are proper to get health insurance in districts /cities in Central Java Province.
The regression coefficient of population density of 0.000284 with p-value of 0,1205 means that population density has not fully influenced the value of the HDI in the districts/cities of Central Java Province. According to Keskinen (2008: 117), population density will bring great challenges on environmental degradation issues, food
insecurity and improvement of local
discrepancy. High population usually relies on natural resources that impact on the environmental condition and development in that region.
Targets equalization and programs based on distribution of population are very important in reducing the inequality of human resource development. Government’s efforts in the grand design for controlling the quantity of population are needed the road
map for equalization to be more
238 Yulia Pangastuti, The Analysis of Human Resources Development in Central Java Province 2009-2013
CONCLUSION
Government education expenditures have positive impacts and significant of 1.118658 toward HDI in districts/cities in Central Java Province. It is assumed that if government education expenditures increase by 1%, HDI value will rise by 1.11 in districts/cities in Central Java Province.
Government health expenditures have
positive impacts and significant of 1.36228 toward HDI in districts/cities in Central Java Province. It is assumed that if government expenditures in health sector increase by 1%, HDI value will rise by 1.36 in districts/cities in Central Java Province. Then, population density does not significantly affect towards HDI in districts/cities in Central Java Province.
REFERENCES
.Undang-undang Nomor 23 Tahun 2014 tentang Pemerintahan Daerah.
Undang-undang Nomor 33Tahun 2004 tentangPerimbangan Keuangan Pusat dan Daerah.
Undang-undang Nomor 36 Tahun 2009 tentang Kesehatan.
Ajija, Shochrul R, dkk. 2011. Cara Cerdas Menguasai Eviews. Jakarta: Salemba Empat.
Astri,dkk. 2013. “Pengaruh Pengeluaran Pemerintah Daerah Pada Sektor Pendidikan dan Kesehatan Terhadap Indeks Pembangunan Manusia di Indonesia”. Jurnal Pendidikan Ekonomi dan Bisnis .Vol.1 No. 1.ISSN : 2302-2663
Badan Perencanaan Pembangunan Daerah. 2009. Rencana pembangunan jangka Menengah Daerah Provinsi Jawa Tengah tahun 2008-2013. Provinsi Jawa Tengah.
Becker, Gary S. 2007. “Population and Economic Growth”.The American Economic Review, Vol. 89, No. 2, Papers and Proceedings of the One Hundred Eleventh Annual Meeting of the American Economic Association.(May, 1999), pp. 145-149. BPS Jawa Tengah. 2013.Indikator Kesejateraan Rakyat
Provinsi Jawa Tengah Tahun 2009-2013. BPS.Jawa Tengah
BPS. 2014. Indeks Pembangunan Manusia 2013. BPS. Jakarta.
Biro Keuangan Sekretaris Daerah Provinsi Jawa Tengah.Alokasi Pengeluaran Pemerintah Bidang Pendidikan & Kesehatan di Kabupaten/Kota Provinsi Jawa Tengah 2009-2013.
Direktorat Jenderal Perimbangan Keuangan. Kementerian Keuangan Republik Indonesia. 2014. APBD Kabupaten/Kota Provinsi Indonesia. Kementerian Keuangan Republik Indonesia Guisan.2009.“Education, Health & Economic
Development: a Survey of Quantitative Economics Studies:2001-2009”. Management Regional and Sectoral Economies Studies. Vol 9-1
Gujarati, D.N. dan D.C. Porter. 2012. Dasar-Dasar Ekonometrika, Edisi 5 Buku 1. Jakarta: Salemba Empat.
Gupta Sanjeev,dkk. 1998.“Public Spending and Human Development”. Financial and Development.Vol. 35. No. 3
Iheoma, Chukwunonso Gerald. 2012.Social Spending and Human Development in Selected West African Countris. MPRA Paper No. 42139
Keskinen, Marko. 2008.“Population, Natural Resources & Development In The Mekong: Does High Population Density Hinder Development?”.Water & Development Publications - Helsinki University of Technology.Modern Myths of the Mekong - Part III: Development. ISBN 978-951-22-9102-1. Mahardiki, Doni. Santoso, Rokhedi Priyo. 2013. Analisis
Perubahan Ketimpangan Pendapatan dan Pertumbuhan Ekonomi Antar Propinsi di Indonesia 2006-2011. JEJAK Journal of Economic and Policy Vol 6 No 2 pp 179-193.
Muritala, Taiwo, Abayomi Taiwo.2011.“Government Expenditure and Economic Development: Empirical Evidence From Nigeria”. MPRA Paper.No. 37293.
Mulgan, Geoff,. David, Albury. 2004. “Innovation In The Public Sector.” Paper Stimulate Discussion. Razmi, Muhammmad Javad. 2012. Investigating the effect
of government health expenditure on HDI in Iran. Journal of Knowledge Management, Economics & Information Technology.
Romer, Paul M.,Rivera A,Luis.1990.“Economic
Integration And Endogenous Growth”.Working Papers No.3528. National Bureau Of Economic Research
Sasana, Hadi. 2012.“Pengaruh Belanja Pemerintah Daerah dan Pendapatan Perkapita Terhadap Indeks Pembangunan Manusia (Studi Kasus di Kabupaten/Kota Provinsi Jawa Tengah”. Media Ekonomi dan Manajemen.Vol 25. No.1
di Provinsi Jawa Timur”.PSK LPPM Universitas Airlangga.
Todaro, P Michael.,Smith C Stephen. 2006. Pembangunan Ekonomi di Dunia Ketiga Edisi kesembilan jilid 1. Erlangga. Jakarta.
Uche, Ejiogu,.dkk.2013. “Causal Relationship Between Nigeria Government Budget Allocation to The Education Sector and Economic Growth”. Discourse Journal of Educational Research. Vol.1(8): 54-64. ISSN: 2346-7045
UNDP, 2014. Human Development Report 2014 Sustaining Human Progress: Reducing Vulnerabilities and Building Resilience. United Nations Development Programme.
Widarjono, Agus. 2007. Ekonometrika Teori dan Aplikasi. Yogyakarta: Ekonosia.