Based on ”upper echelons theory”, this paper investigates the relation between top management team composition and BPD performance. For top management team characteristics, we employ age, level of education, background of education, gender, and functional background, while for measured the BPD performance we employ return on asset (ROA), return on equity (ROE), capital adequacy ratio (CAR), net interest margin (NIM), loan to deposit ratio (LDR), non-performing loan (NPL) and operation expenses to operation income (BOPO). The results show that all characteristics have positive significant influences on BPD performance.
© 2016 IRJBS, All rights reserved.
Keywords:
Top Management Team, BPD Performance, Upper Echelons Theory
Corresponding author: [email protected]
Joy Elly Tulung
*, Dendi Ramdani
** *Universitas Sam Ratulangi, Manado**Office of Chief Economist, Bank Mandiri
A R T I C L E I N F O A B S T R A C T
The Influence of Top Management Team
Characteristics on BPD Performance
Vol. 8 | No. 3 ISSN: 2089-6271 | e-ISSN: 2338-4565
INTRODUCTION
There are so many issues in the business sector in Indonesia that are interesting to investigate, among them are the top management team (TMT), which is consisting of several interesting sub-topics, such as the relationship between TMT and the owner, with the government; military involvement; and the composition of TMT that may cover age, gender, background, education, and so on.
It is interesting to discuss management in Indonesia; many problems have not been answered scientifically. This also covers the
“upper echelons theory” published in several major journals all over the world. The topic is mainly discussed in United States and Europe. It has been 28 years since the first publication, but only few of Indonesian researchers conducted a research on the issue. There have been some publications, but none of them has been published in the major journal.
Therefore, we choose the topic with the question of whether the variety of characteristics in top management team may influence the company performance, especially in banking, and more specifically in Bank Pembangunan Daerah (BPD) in Indonesia.
Business Elites in Indonesia
Indonesia adopts a two-tier system, which separates a board of directors from a board of commissioners. On one hand, the board of directors (hereafter is called top management team) is in charge of operating the company (executive), and on the other hand, the board of commissioners is in charge of monitoring the board of directors in organizing the company. Indonesia has several companies that each of them has different basic characteristics in how each appoints the board of commissioners and board of directors. In a private company, there has been a tendency to appoint the family members of the company owner and several professional people, as well as the employees that are considered brilliant and are appropriate to be included in the top management team. Meanwhile, in the State-Owned Enterprises, the appointment of the board of directors and the board of commissioners is directed and appointed by the government, which is represented by the minister of State-Owned Enterprise. Thus, the minister can appoint the professionals from outside the company or officials from the company.
Regional Development Bank (BPD)
We choose BPD because there has been very little attention from both of international academicians and Indonesia academicians given to this type of
bank. More research on banking conducted in Indonesia were mainly about other issues in other type ofbanks, such as private banks and State-Owned Enterprise banks. If any, it only focuses on one or several BPDs in a province. The issue on the top management team is interesting seen from political views. It has been a public secret that to enter the top management team in BPD, the applicant must have a close connection with the local government, in this case the local government in a province that holds the biggest share in BPD of each province. There may be several BPDs that appoint professional to improve the performance, but this is only one case from a million of cases. There are 26 BPDs in 26 provinces in Indonesia – based on the previous division of provinces before several provinces were expanded. At the end of 2011, the assets of all BPDs in Indonesia reached 305 trillion rupiahs, or in the fourth place in Indonesia after Bank Mandiri (493 trillion), BRI (456 trillion), and BCA (378 trillion) (www. infobanknews.com).
LITERATURE REVIEW
Definition of Top Management Team (TMT) TMT is defined as those who are in the upper tier in an organization (Hambrick& Mason, 1984). The potential members of TMT are CEO or chief executive, president of the commissioner, director of finance, director of the operational, and so on. These individuals are the major executives in an organization, and each of them provides instructions and directives on making important decisions. Hambrick, et al. 1996) also add that TMT is every executive at the level of directors. Amason (1996) states that TMT is upper executives involved in the decision making process for the company. In this case they are the CEO. This definition is supported by West and Anderson (1996), West and Schwenk (1996), and Amason and Sapienza (1997).
The Age of Top Management Team
self-control. They are more mature in thought and in the way of perceiving something. These are the factors of why people at this age sit in the board of the directors. Their mature ways of thinking and their wisdom will help them in the process of decision making. At demographic level, the team diversity refers to some variables such as age that is commonly used to measure the diversity of particular teams. The indicator of diversity is used to measure further the difference in aspects of cognitive, information and value, in which a young manager may have different information, experience, and perspective compared to a senior manager in making a decision in a company concerning the strategic issues. Some researchers find that individuals’ values, attitudes, and behaviors tend to vary depending on age (e.g. Hambrick & Mason, 1984, Francesco & Gold, 1998); that executives of various ages who work together differ in their attitudes and values (Wooldridge &Wester, 1991). Pegels and Yang (2000: 697) state that a senior manager tends to avoid any risk (Vroom &Pahl, 1971), while young manager tends to run after risky things, and takes innovative strategy. Hambrick and Mason (1984) speculate that firms with younger executive’s experience greater growth and variability in performance and their age affects their strategic decisions.
H1: average age in the top management team has effect towards the performance in BPD.
Level of Education
Dahlin et al. (2005) found that the diversity in education on TMT influences positively the range and the depth of the information used; meanwhile, this may influence the information combination negatively. Nevertheless, the ratio of “cognitive bias” (Herrmann &Datta, 2005; Hambrick & Mason, 1984) also explain that in the previous sub section on the influence of functional background of the educational background, it may become the supplement. Bray et al. (1997) states that education in a university should support the students’ career, assuming that higher education has higher chance
in getting job. The level of education also reflects the cognitive ability of the people and their skill. Moreover, higher education is related to the higher capacity for processing the information and to the ability to distinguish various situations (Schroder
et al. 1967). Bantel and Jackson (1989) find that top management team influences the knowledge of manage the firm and make a good decision. Although educational background in business is not obligatory for those people who enter the business world, it is better if the team members have educational background in business and economy. Having that background, the members of the team have at least better ability to manage the business and to make any decision related to the business compared to those who do not have educational background in business. As a result, this ability gives better value for the company.
H2: level of education at top management team will influence the performance of BPD.
Background of Education
H3: education background at top management team will influence the performance of BPD
Gender
Glunk et al. (2001) found that the gender distribution to be highly comparable among the three countries: female executives are clearly under-represented in the top 30 companies of the Great Britain, Denmark and the Netherlands. Furthermore, according to Jarzabkowski and Searle (2001), the diversity indicated by these measures tends to break down. This means that the longer a team is together, the more familiar the members are with each other and the less that these demographic measures indicate true diversity. For example, in the early stages of team formation, the gender differences are remarkable or significant to the ways of how a team member behaves. Over time, those features of the person become familiar and cease to be remarkable.
H4: proportion of female at top management team will influence the performance of BPD
Functional Background
According to Ponnu, (2008) TMT should comprise the professional people with their own expertise in the field of law, accounting taxation, finance, and so on. Having expert members lead to a better perspective towards the risk evaluation, competitive advantage, and understanding on the challenges that need to be encountered in business. Diverse background and experience that are suitable for the needs of the company are significant for the composition of the board as a whole. This is caused by the changing demands of the company from time to time. The board should monitor the expertise and experience of the members according to the criteria of membership that have been established to assess every stage of the company cycle of whether the board has the equipment to carry out its function effectively. However, without having a qualified expertise, a person can contribute to the company by making distinctive decision, showing independent
perspective, and acting with no fear.
H5: functional background at top management team will influence the performance of BPD
METHODS
In this researchdeductive method use as the methodological approach. A deductive approach needs a conceptual development and previous theoretical structure, and is examined by using the empirical observation (Gill and Johnson, 2002). Sample of 26 BPDs data in Indonesia were used and taken from 2010 until 2014. They were obtained from the annual report provided by each website of each BPD. From those 26 BPD, there are 203 members of TMT. The members consist of the board of commissioners and the board of directors. In measuring the performance of BPD, Capital Adequacy Ratio (CAR), Return on Asset (ROA), and Return on Equity (ROE), Net Interest Margin (NIM), Operating Expense to Operating Income (BOPO) Non-Performing Loan (NPL), and Loan to Deposit Ratio (LDR) were employed.
Unit of Analysis
The unit of analysis was all the BPDs in Indonesia. All variables were calculated at the team level which has 203 members of TMT.
BPD Performance Ratio of Solvability
Solvability of a company shows the company’s ability to fulfill its financial obligation both in short and long terms if the company is liquidated. A solvable company means that the company has an adequate assets or properties to pay all its debts. Conversely, a company that has inadequate properties to pay the debts is called an insolvable company.
Capital Adequacy Ratio (CAR)
Cook, thus making it named Cook Ratio. A bank is considered in good condition if the CAR value is above 8%. Since then, CAR is widely employed in banking business. However, the measurement of CAR value at that time is different with what we have nowadays – there have been some revisions, those are on Basel I in 1996 and the last revision on Basel II in 2004. The measurement used now is the last, that is BASEL II. Capital Adequacy Ratio (CAR) was employed in this research as the dependent variable to measure the performance of the TMT in BPD because it is one of several indicators of healthy bank issued by the Bank of Indonesia. A bank with a low CAR value will be warned by Bank of Indonesia and within certain periods it will get some sanction if it cannot make any improvement. The sanction is in the form of liquidation from the Bank of Indonesia. Bank of Indonesia has regulated that the tolerated value for CAR is 8% for BPD.
Formula:
Tier 1 Capital + Tier 2 Capital
CAR = x 100% Risk Weighted assets
Ratio of Assets Quality of the Bank
Assets quality is also called Earning Assets. The meaning of asset quality means total assets in rupiah and foreign exchange owned by the bank in the purpose of earning certain amount of income.
Non Performing Loan (NPL)
Non Performing Loan (NPL) is called bad credit. It is defined as a loan that is difficult to pay as the result of intentional factor and or external factor beyond the control of the debtor (Siamat, 2001:174). The ratio shows the ability of the bank management in managing the bad credits given by the bank. It means that the higher is the ratio, the worse is the quality of the credit of the bank. It may lead to higher amount of bad credit and thus increasing the possibility the greater loss due to bad credits. The ratio shows the quality of
credit asset, meaning that when the collectability of the total credit is poor, doubted, and bad, then the bank is facing an bad credit. The higher is the ratio, the higher is the amount of uncollected loan. It leads to the decrease of the bank income.
Formula:
Nonperforming loan
NPL = x 100% Total loans
Ratio of Liquidity
Ratio of Liquidity means the ratio to measure the ability of a bank in fulfilling short term liability when it is due. In other words, the bank should have the ability to pay the disbursement of the depositors as well as being able to suffice the demands on credits. Bank is said to be liquid when it can pay all the debts especially short term debts (savings, check transfers, and deposits) as well as being able to pay and suffice all demands of credits. The less liquid bank may cause the people distrust the bank and thus lead them to draw their savings and decrease the bank’s performance.
Loan to Deposit Ratio (LDR)
shows a liquid bank with overcapacity. (Almilia & Herdiningtyas, 2005)
Formula:
Total loans
LDR = x 100% Deposit
Ratio of Profitability
According to Kasmir (2007), the ratio of profitability is called business profitability. This ratio is used to measure the efficiency of a business and the profitability achieved by the relevant bank. The profits gained from the activities are the representation of a company’s performance in operating its business. In other words, the ratio of profitability is not only aimed at knowing the ability of a bank in earning some profits in a certain period, but also to measure the level of the management effectiveness in running the business.
Return On Asset (ROA)
Focus of the previous research which measures the performance of the company was on Return on Assets (ROA) and Return on Equity (ROE) (Habelian & Finkelstein, 1993; Michel & Hambrick, 1992). ROA is chosen because it shows the ability of the bank performance and it also measures the effectiveness of the company in getting the income from the asset management. The higher the ROA, the better performance of the bank.
Formula:
Net Income
ROA = x 100% Total Assets
Return On Equity (ROE)
ROE is employed because it is a ratio between net income and equity (Bodie et al., 2002). In other words, if the ROE value of a company is high, there will be more profits and may have positive influence towards the stock price. ROE has been
commonly used to measure the performance of the company’s financial condition (Certo et al., 2006).
Formula:
Net Income
LDR = x 100% Total Equity
Net Interest Margin (NIM)
NIM refers to the different measurement between the interest income earned by the bank or other financial agencies and the interest value paid to the debtors (for example, deposits). It is relative towards the amount of the assets (productive interest). It is similar with the gross margin of the non-financial companies. It is usually stated as the percentage of the source of loan gained by the financial agencies in certain period and other assets that is reduced by the paid interest upon the loan and is divided by the average amount upon the fixed assets of the income earned in the mentioned period (average productive assets). The interest of gross margin is similar to the concept of distributing net interest. However, the distribution of net interest is the average difference of the nominal between the loan and the loan interest rate. It is without any compensation in relation to the fact that the productive assets and the loan fund can be a difference tool and is different in volume. Net interest margin can be higher (or sometimes lower) compared to the distribution of net interest.
Formula:
Net Interest Income
NIM = x 100% Total Assets
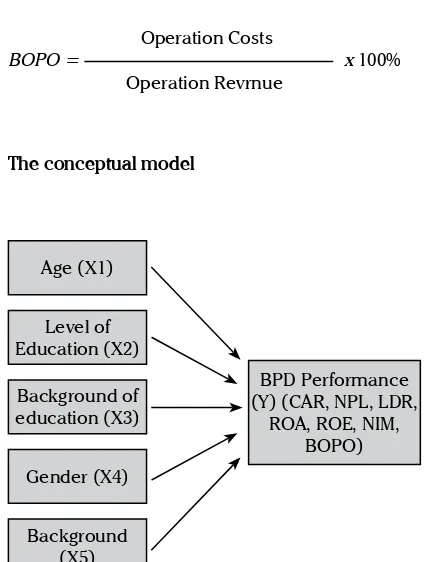
Operating Expenses to Operating Income Ratio (BOPO)
quantitative evaluation of the bank which can be measured by using the ratio of operational cost towards the operational income. According to Dendawijaya (2005), the ratio of operational cost is used to measure the efficiency level of a bank and the ability of the bank in running the activities. The Ratio of Operational Cost towards the Operational Income (BOPO) is called the efficiency ratio and this ratio is used to measure the management of the bank in controlling the operational cost towards the operational income.
Formula:
Operation Costs
BOPO = x 100%
Operation Revrnue
The conceptual model
BPD Performance (Y) (CAR, NPL, LDR,
ROA, ROE, NIM, BOPO) Age (X1)
Level of Education (X2)
Background of education (X3)
Gender (X4)
Background (X5)
Y=β0 + β1 X1 + β2 X2 + ... + βn Xn + e
Y = Dependent variables (CAR, NPL, LDR, ROA, ROE, NIM and BOPO)
X1= Age
X2= Level of Education X3= Background of Education X4 = Gender
X5=Background
βi = Regression coefficient e = Random Error
The Conceptual Model Related by Literature Review
We follow Maclean et al. (2005 : 4) who studied the relationship between business elites and corporate governance in France and the UK. They developed a conceptual model with a pyramid, and underlying ideologies, assumption and values on which rules and practice draw are positioned closer to the base of the pyramid, in the middle ground were business system, structure and relationship and the top were rules, relegation and practices.
Van Veen and Elbertsen (2008) in their article their studied the relationship between governance regime and nationality diversity in corporate boards in Germany, UK and the Netherland. Their concentrate on structural features of governance regimes that might affect the accessibility of boards for foreigners. And then specifically look at corporate governance codes, ownership differences, the legal framework and some business elite traditions.
RESULTS AND DISCUSSIONS Descriptive Statistics
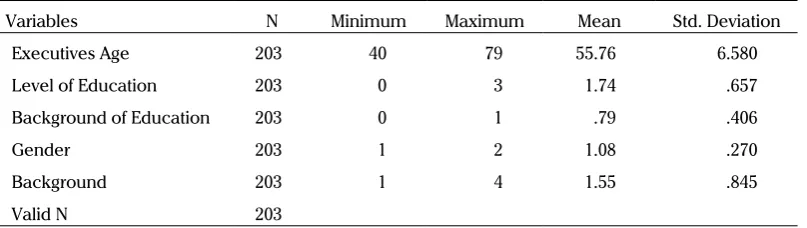
Table 1 shows the mean and standard deviation of the executives’ age, level of education, background of education, gender, background of the members of the TMT. The age range of the members of TMT is from 40 to 79, with the mean of age average of TMT members is 55.79 and standard deviation is 6.610; the mean for level of education is 1.73 and the standard deviation is 0.659, background of education (2.08 and 2.469) gender (1.08 and 0.275 and background (1.55 and 0.85).
Characteristics of TMT in BPD
members of board of directors. The characteristics of the age of TMT is divided into three categories: 32 members with the age of 40-49 years (15.8); 118 members with the age of 50-59 (58.1%); and 53 members with the age of 60 years and above (26.1%). It can be seen that the highest number goes to the second category, with 113 members or 57.9%. It shows that this age group has more chance in becoming the members of TMT in BPD in Indonesia. Meanwhile, the average age, seen from the mean (55.79) and standard deviation (6.610), is 55.48. For the educational level, there is only two (1%) members of TMT who have senior high diploma, while others have attended the higher education with the following classification: 71 members (35%) got a college degree; 108 members (53.2%) got a master’s degree, and 22 members (10.8%) got a doctoral degree. We divide the background of education into two classifications, consisting of economics and non economics and the result shows that the members of TMT who take an economics degree and non economics degree are 161 (79.3%) and 42 (20.7%) respectively. For gender, there is a significant difference in which the male dominates the members of the TMT, reaching 187 people (92.1%), while the females were only 16 (7.9%). It shows that male employees have more chance to become TMT members compared to female employees. In other words, female workers have less chance to become TMT in BPD in Indonesia. It can be seen that 137 members (67.5%) have background as bankers, which means that those members are
bank employee who become the members of TMT. The other 66 members (32.5%) are not bank employees. They consist of 23 academicians, 41 government employees and 2 military staff. It is not surprising since BPD is owned by the government of each province so they put their people inside a board, especially on board of commissioners.
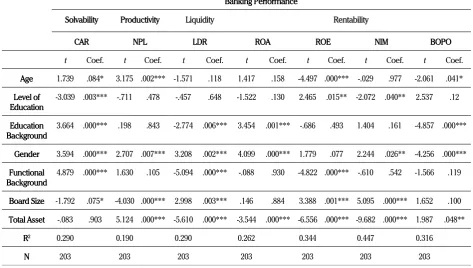
Table 3. provides us with the results of the hypotheses testing from five hypotheses. First, the Hypothesis 1 (H1) states that the composition of age in the top management team gives positive effect to the performance of BPD. The results show that four of the seven performance ratio namely CAR (0.084, with p > 0.1), NPL (0.002, with p > 0.01), ROE (0.000, with p > 0.01) and BOPO (0.041, with p > 0.1) are significant. In contrast, this ratio is not significant in LDR, ROA and NIM. Based on this regression analysis, we accepted the H1. Second, the hypothesis 2 (H2) states that the level of education at top management team will positively influence the performance of BPD. We can see the results on CAR (0.003, with p < 0.01), ROE (0.015, with p < 0.05) and NIM (0.040, with p < 0.05). H2 is supported by our data so H2 is accepted. Third, the hypothesis 3 examines the educational background and BPD performance and the results show that the education background at TMT is positively influence the performance of BPD, CAR (0.000, with p < 0.01), LDR (0.006, with p < 0.01), ROA (0.001, with p < 0.01) and BOPO (0.000, with p < 0.01), so the H3 is accepted. Then, the hypothesis 4 states that the
Variables N Minimum Maximum Mean Std. Deviation
Executives Age 203 40 79 55.76 6.580
Level of Education 203 0 3 1.74 .657
Background of Education 203 0 1 .79 .406
Gender 203 1 2 1.08 .270
Background 203 1 4 1.55 .845
Valid N 203
Table 2. Characteristics of Top Management Team in all BPD
Table 2. Characteristics of Top Management Team in all BPD
Profile Classification Total Percentage Mean Standard
Deviation
Board Commissioners 91 44.6 1.55 .501
Directors 112 55.4
Age 40 – 49 32 15.8 55.76 6.580
50 – 59 118 58.1
60< 53 26.1
Level of Education High School 2 1 1.74 .657
Bachelor 71 35
Master 108 53.2
Doctor 22 10.8
Background of Education Economics 161 79.3 .79 .406
Non-Economics 42 20.7
Gender Male 187 92.1 1.08 .270
Female 16 7.9
Background Banker 137 67.5 1.55 .850
Academician 23 11.3
Government 41 20.2
Military 2 1
Banking Performance
Solvability Productivity Liquidity Rentability
CAR NPL LDR ROA ROE NIM BOPO
t Coef. t Coef. t Coef. t Coef. t Coef. t Coef. t Coef.
Age 1.739 .084* 3.175 .002*** -1.571 .118 1.417 .158 -4.497 .000*** -.029 .977 -2.061 .041*
Level of
Education -3.039 .003*** -.711 .478 -.457 .648 -1.522 .130 2.465 .015** -2.072 .040** 2.537 .12
Education
Background 3.664 .000*** .198 .843 -2.774 .006*** 3.454 .001*** -.686 .493 1.404 .161 -4.857 .000***
Gender 3.594 .000*** 2.707 .007*** 3.208 .002*** 4.099 .000*** 1.779 .077 2.244 .026** -4.256 .000***
Functional
Background 4.879 .000*** 1.630 .105 -5.094 .000*** -.088 .930 -4.822 .000*** -.610 .542 -1.566 .119
Board Size -1.792 .075* -4.030 .000*** 2.998 .003*** .146 .884 3.388 .001*** 5.095 .000*** 1.652 .100
Total Asset -.083 .903 5.124 .000*** -5.610 .000*** -3.544 .000*** -6.556 .000*** -9.682 .000*** 1.987 .048**
R2 0.290 0.190 0.290 0.262 0.344 0.447 0.316
N 203 203 203 203 203 203 203
proportion of female at top management team will positively influence the performance of BPD, and the result shows CAR (0.000, with p < 0.01), NPL (0.007, with p < 0.05), LDR (0.002, with p < 0.01), ROA (0.000, with p < 0.01), NIM (0.026, with p < 0.05) and BOPO (0.000, with p < 0.01). The data supports H4. Finally, the hypothesis 5 examines the background of TMT and the performance of BPD. The result shows CAR (0.000, with p < 0.01), LDR (0.000, with p<0.01), and ROE (0.000, with p < 0.01), and based on this regression analysis, H5 is also accepted.
CONCLUSION
The general purpose of this study is to explore the characteristics of the board in regional develop-ment bank (BPD). Therefore, we decide to exa-mine the average age of TMT, level of education, background of education, presence of female on board and the background. Surprisingly, all of our hypotheses is accepted and this is a good indicator for our research. Firstly, the average age of TMT is supported by the positive significance shown in four ratios of performance of BPD. We argue that the average and composition or perhaps the diver-sity of age in TMT members are excellent because the average of age of TMT in BPD is already in the golden age. Consequently, the executive is wiser and has good instinct and experience.
This idea is supporting by the arguments from Mayr (2011) who argued that the detrimental aspects on ageing could be compensated by the package of knowledge, experience and wisdom gained over time and the negative aspects of age gradually weakens because of the complexity of job for executives and the demand of specific skills. Then, Taylor (1975) indicates that this must be considered with care, because the older managers also seek more information, evaluate information more accurately, and take more time in making a decision. Secondly, the level of education has
a positive effect to the BPD performance. This happens because the top executives’ area group of educated people who are mostly hold bachelor and master’s degrees. This means that the higher level of education might help the executives in making a good teamwork and decision so that their work will be more effective and their education surely has a positive impact to the firm performance. This finding supports the research from Bantel and Jackson (1989) who find that the team’s educational level is significantly correlated with the total innovation and from Norburn and Birley (1988) who find that the educational level has positive effects to the growth of the firm. Thirdly, the results from educational background, give significant and positive effects to the BPD performance. This is not surprising because most of the executives have backgrounds in economics, managements and accountings which form their good knowledge in making a decision regarding the firm performance.
R E F E R E N C E S
Amason, A.C. (1996). Distinguishing the effects of functional and dysfunctional conflict on strategic decision - making: Resolving a paradox for top management teams. Academy of Management Journal, 39(1), 123-148.
Amason, A.C. & Sapienza, H.J. (1997). The effects of top management team size and interaction norms on cognitive and affective conflict. Journal of Management, 23, 495-516.
Bantel, K. A. & Jackson, S. E. (1989), Top management and innovations in banking: Does the composition of the top team make a difference?.Strategic Management Journal, 10: 107–124. doi: 10.1002/smj.4250100709
Bialas, M. & Solek, A. (2010) Evolution of Capital Adequacy Ratio, Economics & Sociology, Vol. 3, No 2. pp. 48-57.
Boone, C. & Hendricks, W. (2009). Top management team diversity and firm performance: Moderators of functional-background and locus-of-control diversity. Management Science, 55 (2009), pp. 165–180
Certo, S. T., Lester, R. H., Dalton, C.M., & Dalton, D. R. (2006) Top management teams, strategy and financial performance: A meta-analytic examination. Journal of Management Studies, Vol. 43 813–839.
Finkelstein, S. & Hambrick, D. C. (1996) Strategic leadership: Top executives and their effects on organizations. St. Paul, MN: West Publishing
Glunk, U., Heijltjes, M., G., & Olie, R. (2001). Design characteristics and functioning of top management teams in Europe.
European Management Journal, 19(3): 291–300
Habelian, J. & Finkelstein, S. (1993) Top management team size, CEO dominance, and firm performance: The moderating role of environmental turbulence and discretion. Academy of Management Journal, Vol. 36: 844-863.
Hambrick, D. C. (2007). Upper Echelons Theory: An Update. The Academy of Management Review, 32(2), 334–343. doi. org/10.2307/20159303
Hambrick, D. C., Cho, T. S. & Chen, M. (1996) The influence of top management Heterogeneity on firms’ competitive moves.
Administrative Science Quarterly, Vol. 41: 659-684.
Hambrick, D. C. & Mason, P. A. (1984) Upper echelons: The organization as a reflection of its top managers. Academy of Management Review, Vol. 9: 193-206.
Hermalin, B. E. & Weisbach, M. S. (1988). The Determinants of Board Composition. RAND Journal of Economics, 19(4), 589-606.
Hermann, P. & Datta, D. K. (2005) Relationships between top management team characteristics and international diversification: An empirical investigation’, British Journal of Management, Vol. 16 No. 1: 69-78.
Jarzabkowski, P. & Searle, R. (2003)Top management team strategic capacity:diversity, collectivity & trust. Aston Business School Research Papers
Kasmir. (2007). Bank dan Lembaga Keuangan Lainnya, Edisi Keenam, Penerbit Raja Grafindo Persada, PT, Jakarta
Kusumastuti, S., Supatmi., & Astra, P. (2007) Pengaruh Board Diversity Terhadap Nilai Perusahaan dalam Perspektif Corporate Governance. Jurnal Akuntansi Keuangan, 9(2). 88-98
Mayr, R. (2011). Top Management Team Age Structure and Firm Performance, Ph.D Dissertation, University of St. Gallen, Graduate School of Business Administration, Economics, Law and Social Sciences (HSG)
Maclean, M., C. Harvey & J. Press (2005) “Business Elites and Corporate Governance in France and the UK”, Hampshire, Palgrave Macmillan.
Michel, J. & D. Hambrick. (1992) Diversification posture and top management team characteristics, Academy of Management Journal, Vol. 35 No. 1, pp. 9-37.
Pegels, C. C. & Yang, B., (2000). Top management team impact on strategies assets accumulation capabilities. Management Decision: Vol. 38: 694-710
Ponnu, C.H. (2008). Corporate Governance Structures and the Performance of Malaysian Public Listed Companies.International Review of Business Research Papers., 4 (2). pp. 217-230.
Taylor, R. N. (1975). Age and Experience as determinants of Managerial Information Processing and Decision Making Performance. Academy of Management Journal. 18, pp.74-81
Tjager, I.N. (2003). Corporate Governance; Tantangan dan Kesempatan bagi Komunitas Bisnis Indonesia. PT Prenhallindo, Jakarta.
Van Veen, K. & Elbertsen, J. (2008), Governance Regimes and Nationality Diversity in Corporate Boards: A Comparative Study of Germany, the Netherlands and the United Kingdom. Corporate Governance: An International Review, 16: 386–399.
West, M.A. & Anderson, N.R. (1996), Innovation in top management teams. Journal of Applied Psychology, Vol 81(6), Dec 1996, 680-693.