MONITORING THE SURFACE HEAT ISLAND (SHI) EFFECTS OF INDUSTRIAL
ENTERPRISES
A. Şekertekin a, *, Ş. H. Kutoglu a
, S. Kaya b, A. M. Marangoz a
a BEU, Engineering Faculty, Geomatics Engineering Department 67100 Zonguldak, Turkey - (aliihsan_sekertekin, kutogluh, aycanmarangoz)@hotmail.com
b
ITU, Civil Engineering Faculty, 80626 Maslak Istanbul, Turkey - (kayasina)@itu.edu.tr
Youth Forum
KEY WORDS: Urban Heat Island, Surface Heat Island, Land Surface Temperature, Industrial Enterprises, Landsat
ABSTRACT:
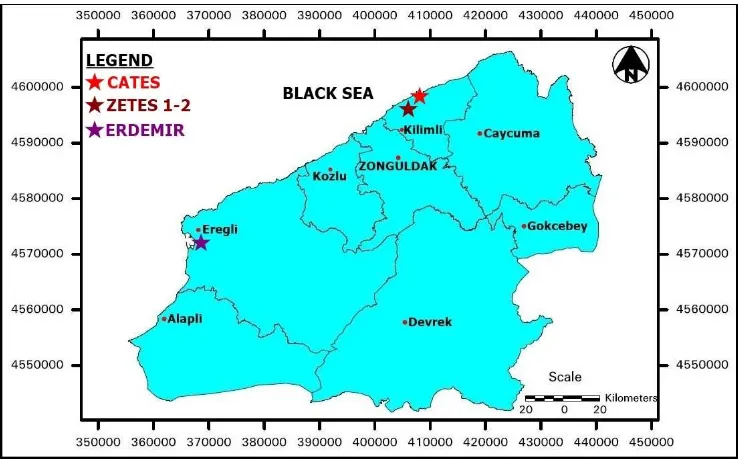
The aim of this study is to present the effects of industrial enterprises on Land Surface Temperature (LST) and to retrieve Surface Heat Island (SHI) maps of these regions. SHI is one of the types of Urban Heat Island (UHI) and as the urban areas grow in a city, UHI effect becomes bigger. The city centre of Zonguldak was chosen as study area and Landsat 5 satellite data were used as materials. Zonguldak has important industrial enterprises like thermal power plants and iron and steel plant. ERDEMIR is the biggest iron and steel plant in Turkey and it is one of the biggest ones in Europe, as well. There are three operating thermal power plants in the region namely CATES, ZETES1 and ZETES2. In order to investigate these industrial regions, Landsat 5 satellite data were processed using mono-window algorithm to retrieve LST and they were acquired on 11.09.1987, 18.09.2007 and 29.09.2011, respectively. The obtained results revealed that from 1987 to 2011, spatial and temporal variability in LST in industrial enterprises became higher than the surroundings. Besides, the sizes of SHIs in 2011 are bigger than the ones in 1987. For the countries and governments, having industrial enterprises is crucial for the development and it is also important to present the community better conditions in life. Thus, decision makers should consider mitigating the effects of these regions on LST.
*
Corresponding author
1. INTRODUCTION
The rise in temperature of Earth’s surface has been accelerating since the last century. Thus, it is of great importance to study on Land Surface Temperature (LST) as a climate parameter for the scientists. Satellite images are widely used by the scientists in order to investigate and visualize the effects of global warming by means of remote sensing technologies.
LST is a crucial climate parameter and it is great importance of analysing the UHIs and local climate changes (Voogt & Oke, 2003; Kaya et al., 2012). Split-window algorithm (Sobrino et al., 1996), temperature/emissivity separation method (Gillespie et al., 1998), mono-window algorithm (Qin et al., 2001) and single channel method (Jimenez-Munoz & Sobrino, 2003) are the most commonly used LST retrieval algorithms. Radiative transfer equation method, single channel method and mono-window algorithm are generally used LST retrieval methods for Landsat data. Radiative transfer equation method is not applicable because during the satellite pass, atmospheric parameters must be measured in-situ. Thus, single channel method and mono-window algorithms are preferred to obtain LST maps using Landsat data and they both present satisfying results. However, mono-window algorithm can be implemented
simply and practically because of using simulated linear transformation equations for some parameters in the algorithm.
The UHI is the phenomenon that the cities or urban areas have more temperature values than its surrounding (rural areas). SHI is one of the types of UHI and it can be observed by airborne aircrafts, satellites etc. The aim of this study is to extract Surface Heat Island (SHI) maps of the industrial regions on the basis of LST and to analyse the effects of industrial enterprises on LST. operating in the study area right now. ERDEMIR is one of the biggest iron and steel plants in Europe and the thermal power plants are some of the important ones in Turkey. The city Zonguldak is one of the most forested cities in Turkey. However, with the exploitation of the coal reserves, progressive deforestation, and massive loss of wetlands followed on (Sekertekin et al., 2016). This study was examined in order to investigate whether the industrial enterprises have impact on LST and SHI or not.
Figure 1. The distribution of the industrial enterprises in the study area
3. MATERIAL AND METHOD
In this research, Landsat 5 TM images acquired on 11.09.1987, 18.09.2007 and 29.09.2011 were used to retrieve LST. In addition to satellite data, meteorological data such as humidity and temperature obtained from the local meteorological stations were used in the algorithm.
Radiative transfer equation method, mono-window algorithm and single-channel algorithm are the most common LST retrieval methods using Landsat data. Radiative transfer equation method reveals the best results, but it requires in-situ radiosonde measurement of the atmospheric parameters during the satellite passes. Mono-window algorithm is also an effective method which provides satisfying values of root mean square deviation (Sobrino et al., 2004). Therefore, mono-window algorithm was chosen in this research.
Mono-window algorithm, developed by Qin et al. (2001), is recommended for LST retrieval of the images with one thermal band. The method includes three main parameters, namely emissivity, atmospheric transmittance and effective mean atmospheric temperature (Qin et al., 2001). In order to apply mono-window algorithm, seven steps written below were utilized.
• Converting Digital Numbers (DNs) To Spectral Radiance Values
• Converting Spectral Radiance to Reflectance Values • Converting Spectral Radiance to Brightness Temperature
Values
• Estimation of Emissivity Values (Depends on Normalized Difference Vegetation Index (NDVI))
• Estimation of Atmospheric Transmittance (Depends on water vapour content)
• Calculation of Mean Atmospheric Temperature • Calculation of LST
Before implementing these steps, pre-processing of satellite data were performed. The images were resampled and clipped as including the study area. The first two steps of the algorithm are
radiometric corrections. After radiometric corrections of the images, spectral radiance values of thermal bands were converted to brightness temperature by means of equation (1).
where T = effective at-satellite temperature in Kelvin Lλ = spectral radiance at the sensor's aperture K1, K2 = calibration constants
The next step is the estimation of Land Surface Emissivity (LSE) by using NDVI. A detailed estimation of LSE from NDVI was proposed by Zhang et al. (2006a).
After that, the estimation of mean atmospheric temperature (Ta) via near surface temperature (To) was proposed by Qin et al. (2001). Estimation of the last parameter, atmospheric transmittance (τi), could be estimated from water vapor content (wi) as demonstrated in Table 1 (Qin et al., 2001). Water vapor content can be obtained from the meteorological stations or can be calculated using near surface temperature and relative humidity.
0.08007×wi 0.99611 0.002368
1.6-3.0
1.031412-0.11536×wi 0.99827 0.002539
Low Air Temperat
ure
0.4-1.6
0.982007-0.09611×wi 0.99563 0.003340
1.6-3.0
1.053710-0.14142×wi 0.99899 0.002375
Table 1. Estimation of atmospheric transmittance from water vapour
Finally LST values could be obtained from equation (2), the equation of mono-window algorithm.
where a = −67.355351 b = 0.458606 C = εi × τi
D = (1 − τi)[1 + (1 − εi) × τi Ts = LST in Kelvin
Ti = brightness temperature in Kelvin Ta = effective mean atmospheric temperature τi = atmospheric transmittance
εi = land surface emissivity a, b = algorithm constants
Urban Thermal Field Variance Index (UTFVI) was used to evaluate the SHI effect (Zhang et al., 2006b). UTFVI can be calculated using the equation (3) as below:
where Ts = LST in Kelvin
TMEAN = the mean LST value of the whole study area in Kelvin
The threshold values for the ecological evaluation index related to UTFVI are presented in Table 2.
Urban Thermal Field Variance
Index
Urban Heat Island phenomenon
Ecological Evaluation Index
<0 None Excellent
0.000-0.005 Weak Good
0.005-0.010 Middle Normal
0.010-0.015 Strong Bad
0.015-0.020 Stronger Worse
>0.020 Strongest Worst
Table 2. The threshold values for the ecological evaluation index related to UTFVI
4. RESULTS
A model of the mono-window algorithm is illustrated in Figure 2. The whole process in this figure is programmed in Erdas Imagine Spatial Modeler for processing the data automatically. After obtaining LST, the images were classified using threshold method (Figure 3).
Figure 2. LST image model created in Erdas Imagine Spatial Modeler
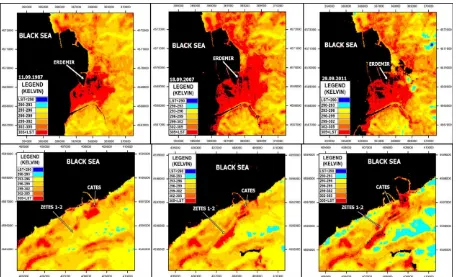
Figure 3. Classified LST images of the industrial enterprises in the study area
Accuracy assessment of LST image was conducted using the linear correlation coefficient between the radiance and LST values. In general, the temperature values of LST image and local meteorological stations are compared for this evaluation. Because there is only one meteorological station in Zonguldak, the radiance and LST values were compared with each other for the accuracy assessment and the results from 1987 to 2011 were 88%, 92% and 90%, respectively.
In this study, industrial regions in the city of Zonguldak were evaluated with regard to LST and SHI. As a result of the analyses, the surface temperature around some places in thermal power plants’ region Catalagzi is about 5 ºC higher than the city centre. Three thermal power plants (ÇATES, ZETES 1 and ZETES 2) have high LST values compared to the other land cover types. Max., min., and mean LST values for the industrial regions are presented in Table 2. The acquisition month of the satellite images is September. Although 2011 image was acquired at the end of September, mean LST values for this image are higher than the others. In the satellite images some places seem wet; hence, LST values for these places could not be calculated in the algorithm due to just presenting land cover.
ERDEMIR
Table 2. LST statistics for the Landsat images
Classified UTFVI for the study sites were presented in Figure 4. As understood from Figure 4, SHIs’ sizes have enlarged year by year for the industrial enterprises and their surroundings due to the expansion of the facilities in the regions. In particular, after constructions of ZETES’ power plant (after 2005) heat island effect can be observed in the region clearly.
Figure 4. Classified UTFVI images of the study sites
5. CONCLUSION
Heat island effect has an important role for regional climate change studies. Thus, variations in air and surface temperatures for any region are considered by lots of scientists. In this context, satellite imagery is an effective method to retrieve LST thanks to presenting large areas. In this study, LST variations in industrial regions were evaluated and SHIs were extracted using LST images. ERDEMIR is in the centre of the city and Thus it should be investigated by some different disciplines together whether it has negative effects on people and environment or not. The expansion in the industrial enterprises’ facilities causes rise in the surface temperature. Therefore, it should be considered to increase woodland and vegetative areas while
constructing concrete structures. The decision makers should control the construction works and consider using materials that do not absorb sun radiation so much in the industrial enterprises.
REFERENCES
Gillespie, A. R., Rokugawa, S., Matsunaga, T., Cothern, J. S., Hook, S. J., & Kahle, A. B., 1998. A temperature and emissivity separation algorithm for advanced space borne thermal emission and reflection radiometer (ASTER) images. IEEE Transactions on Geoscience and Remote Sensing, 36, 1113-1126.
Jimenez-Munoz, J. C., & Sobrino, J. A., 2003. A generalized single-channel method for retrieving land surface temperature from remote sensing data. Journal of Geophysical Research, 108(D22), 4688.
Kaya, S., Basar, U. G., Karaca, M., & Seker, D. Z., 2012. Assessment of Urban Heat Islands Using Remotely Sensed Data. Ekoloji, 21(84), 107-113.
Qin, Z., Karnieli, A., & Berliner, P., 2001. A mono-window algorithm for retrieving land surface temperature from Landsat TM data and its application to the Israel-Egypt border region.
International Journal of Remote Sensing, 22(18), 3719-3746.
Sekertekin, A., Kutoglu, S.H., & Kaya, S., 2016. Evaluation of spatio-temporal variability in Land Surface Temperature: A case study of Zonguldak, Turkey. Environ Monit Assess, 188:30.
Sobrino, J. A., Li, Z. L., Stoll, M. P., & Becker, F., 1996. Multi-channel and multi-angle algorithms for estimating sea and land surface temperature with ATSR data. International Journal of Remote Sensing, 17, 2089-2114.
Sobrinoa, J. A., Jimenez-Munoz, J. C., & Paolini, L., 2004. Land surface temperature retrieval from LANDSAT TM 5.
Remote Sensing of Environment, 90, 434–440.
Voogt, J. A., & Oke, T. R., 2003. Thermal remote sensing of urban climates. Remote Sensing of Environment, 86, 370–384.
Zhang, J., Wang, Y., & Li, Y., 2006a. A C++ program for retrieving land surface temperature from the data of Landsat TM/ETM+ band6. Computers & Geosciences, 32, 1796–1805.
Zhang Y., Yu T., Gu X., Zhang Y., Chen L., Yu S., Zhang W., Li X., 2006b. Land surface temperature retrieval from CBERS-02 IRMSS thermal infrared data and its applications in quantitative analysis of urban heat island effect. J. Remote Sens., 10, 789-797.