www.elsevier.comrlocateratmos
Observation of ozone concentration during the
solar eclipse
S. Chudzynski
´
a, A. Czyzewski
˙
a, K. Ernst
a, A. Pietruczuk
a,
W. Skubiszak
a, T. Stacewicz
a,), K. Stelmaszczyk
a,
A. Szymanski
´
a, I. Sowka
´
b, A. Zwozdziak
´
b, J. Zwozdziak
´
ba
Institute of Experimental Physics, Warsaw UniÕersity, 00-681 Warsaw, Hoza 69, Poland˙
b
Faculty of EnÕironmental Engineering, Technical UniÕersity of Wrocl/aw, Wybrzeze Street,˙
Wyspianskiego 27, 50-370 Wrocl´ /aw, Poland
Received 3 March 2000; accepted 8 October 2000
Abstract
We report the results of measurements of ozone concentrations during the solar eclipse of 11
Ž .
August 1999. The experiment was performed in Warsaw Poland and its surroundings. The temporal evolution of ozone concentration was measured using the differential absorption lidar
ŽDIAL and it was compared with results obtained by several monitoring stations measuring with.
other methods. In almost all cases, a drop in the ozone concentration was observed during the eclipse. Experimental data was compared with calculations done using a simple model based on NO –O chemical kinetics.q2001 Elsevier Science B.V. All rights reserved.
x 3
Keywords: Ozone monitoring; Eclipse; Chemical kinetics
1. Introduction
Researchers are still largely interested in the problem of tropospheric ozone. Its
Ž .
background concentration reaches a mean value of about 20 ppb Crutzen, 1995 and is mainly of stratospheric origin. The remaining part of ozone is produced as a result of chemical reactions occurring in the troposphere. In urban areas, substrates for these
Ž .
reactions NO and other compounds are of anthropogenic origin, mainly as a result ofx
)Corresponding author. Fax:q48-22-6256404.
Ž .
E-mail address: [email protected] T. Stacewicz .
0169-8095r01r$ - see front matterq2001 Elsevier Science B.V. All rights reserved.
Ž .
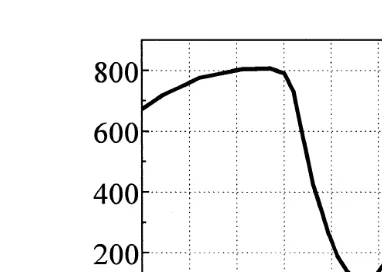
w 2x
Fig. 1. Evolution of sun light intensity Wrm during the solar eclipse that was assumed for calculations of O –NO dynamics.3 x
the combustion of various fuels. The most efficient reactions involving the ozone are
Ž .
driven by solar radiation Finlayson-Pitts and Pitts, 1986; Seinfeld and Pandis, 1998 . The solar eclipse provided a unique possibility to check our comprehension of the ozone creationrdegradation mechanisms. During the eclipse, the character of changes in sun light intensity strongly differs from those occurring between night and day. Diurnal variations of radiation are relatively slow and are accompanied by other phenomena, like time-dependent changes of the sunlight spectrum. During the eclipse, the solar disc is geometrically hidden by the moon, so that the light isAswitchedB off and on relatively quickly, without additional spectral effects. Investigations of the ozone photochemistry could be then performed on aAshort timeB scale.
Table 1
Description of monitoring stations
No. Figure Location—street Description of Altitude Technique location
1 2a Belsk Village, 50 km Ground station Chemiluminescence
south of Warsaw
2 2b Jarczew Village, 80 km Ground station Chemiluminescence
southeast of Warsaw
3 2c Warsaw—Podlesna´ Suburb area Ground station Chemiluminescence 4 2d and 3 Warsaw—Jerozolimskie The city center, 15 m above the DOAS
the most intense street level, traffic area in 330 m optical
Warsaw path length
5 2e Warsaw—Pasteura The town, traffic 300 m above DIAL
street level
Ž .
The laboratories belong to the following institutions: 1 Geophysical Observatory of Polish Academy of
Ž . Ž . Ž .
Science, 2 and 3 Institute of Meteorology and Water Resources, 4 Voivodship Inspectorate for
Ž .
In Poland, the solar eclipse of 11 August 1999 was only partial. In Warsaw, it started at 9:56 am and it was over at 11:56 am GMT. The maximum cover of the sun disc was observed at 10:50 am and it reached 87%. In Fig. 1, the evolution of the sunlight intensity during the eclipse is presented. The curve is based on geometrical considera-tions. The normalization of the data to the circumstances corresponding to the region of Warsaw was done due to measurements of the radiation intensity performed in
monitor-Ž .
ing station in Jarczew see Table 1 .
2. Experiment
Observations of the ozone concentrations were done in Warsaw and its surroundings. A description of the detectors, their localization and method of measurements is presented in Table 1.
Chemiluminescence technique is used for monitoring O and NO in point detectors3 x
ŽAlloway and Ayres, 1998 . In the differential optical absorption spectroscopy DOAS. Ž .
method, the selective detection of gas species is done by the analysis of absorption
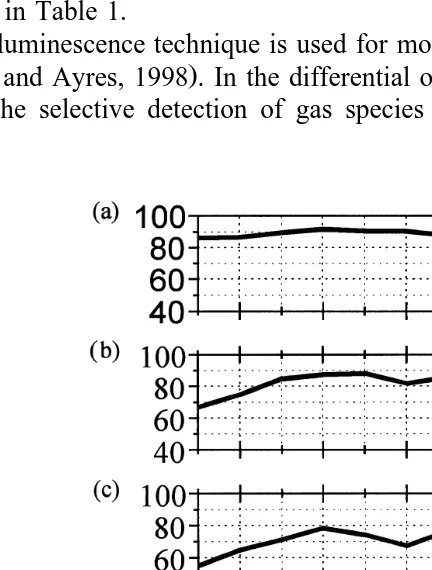
Ž . Ž .
Fig. 2. Ozone concentration measured during the solar eclipse by the following laboratories: a Belsk, b
Ž . Ž . Ž .
Jarczew, c Warsaw—Podlesna, d Warsaw—Jerozolimskie, e Warsaw—Pasteura. All values are given in´
Ž .
within a wide spectral range on a long absorption path Siegrist, 1994 . Description of
Ž . Ž
the differential absorption lidar DIAL technique can be found elsewhere Chudzynski
´
.
et al., 1997; Killinger and Mooradian, 1983 . It is based on the analysis of the lidar echo measured at two wavelengths: one that is tuned to the absorption line of the investigated
Ž . Ž .
compound for O it is equal to 286.3 nm and the other one slightly shifted , that is3
Ž .
less absorbed and serves as a reference 282.4 nm .
On the day of the eclipse, the DIAL measurements started at 09:00 am and were continued until 2:00 pm GMT. The laser beam was directed above the region of the town of large traffic intensity. The data shown in Fig. 2e corresponds to the effective altitude of about 300 m above street level. The data was averaged over 30 min, similarly to the other detectors.
The meteorological conditions during the measurements were as follows: temperature 278C, relative humidity about 50%, clear sky condition until 8:00 am and 40% sky coverage between 10:00 am and 6:00 pm.
3. Results of measurements
Results of ozone measurements are presented in Fig. 2a–e. In all cases but one, a decrease of the ozone concentration synchronized with the eclipse time was observed.
Ž .
The highest decrease was measured by DIAL located in Warsaw Fig. 2e . A smaller dip
Ž .
was registered by the laboratory in Jarczew Fig. 2b that is out of town. Other two
Ž .
laboratories located in Warsaw Podlesna—Fig. 2c, Jerozolimskie—Fig. 2d , also observed a decrease of the ozone concentration. This effect was not registered in the
Ž .
laboratory in Belsk Fig. 2a , which is situated in a village, with a small influence of traffic and industry.
4. Model
In order to describe the dynamics of ozone changes under the influence of variable sunlight intensity, a simple chemical kinetics model was considered. The model consists of main reactions leading to ozone production and destruction. It is based on the
Ž .
NO –O chemistry Finlayson-Pitts and Pitts, 1986; Seinfeld and Pandis, 1998 . Thex 3
reactions considered and their efficiencies are shown in Table 2.
Table 2
Ž .
Basic reactions of the ozone production and destruction in the atmosphere Seinfeld and Pandis, 1998
Reaction Rate coefficients
y3 y1 Ž .
1 Photo-dissociation of NO2 NO2qhv™NOqO j1sj10 nI t , j10s8.9=10 s ,
Ž .
I t —sunlight intensityn
y34Ž 6. Ž 2 .
2 Creation of ozone in the OqO2qM™O3qM k2s6=10 cm rmolPs
Ž .
presence of a third body M
y1 4Ž 6. Ž 2 .
w x
On the basis of indicated reactions the rate equations for ozone O , nitrogen oxide3 wNO , nitrogen dioxide NOx w 2x and atomic oxygen O concentrations can be written asw x
follows:
The rate constants of the reactions are given in Table 2.
Ž . Ž .
and as a consequence, the following relation:
w
NOx
qw
NO2x
sconstsw
NOx
0qw
NO2 0x
,Ž .
6w x w x Ž .
where NO0 and NO2 0 denote the initial values of the relevant species. Eq. 6 makes
w x w x
possible the calculation of NO from known NO2 values.
Ž . w xw xw x Ž .
In Eq. 1 , the unknown term k O O2 2 M can be found using the relation 4 . It is well known that due to the fast destruction of atomic oxygen in the troposphere, in comparison with other substrates, we may assume a steady state approximation:1
w x
d O
™0.
Ž .
7d t
Ž .
Then, Eq. 4 provides the relation:
w x w
x w x
w
x
k O O2 2 M sj NO1 2 .
Ž .
8Ž . Ž .
Finally, after using Eqs. 6 and 8 , the rate equation for the ozone concentration
ŽEq. 1Ž .. can be written in the form:
By solving this equation, the temporal evolution of ozone concentration can be found.
Žw x w x.
As nitric dioxide concentrations NO2 0 and NO2 we used the empirical data. They
w x
mirrored the influence of urban conditions on the investigated process. The NO0 was found as a free parameter from the best fit of the equation solution to the experimental data.
1
The experimentally proven phenomenon of low concentration of atomic oxygen, as well as of the small
Ž . Ž .
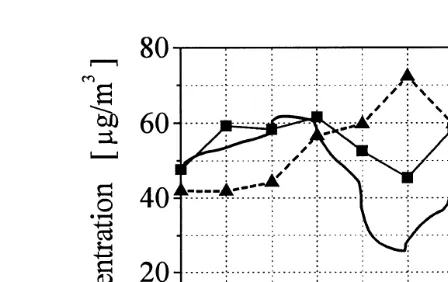
Ž . Ž
Fig. 3. Comparison of the model results continuous line with the ozone concentration continuous line with
.
squares measured by the Laboratory of Voivodship Inspectorate for Environmental Protection in Warsaw. Dashed line with triangles shows the NO concentration measured by this station.2
We compared the calculations with the experimental results. A quantitative compari-son could be done only with data concentrations from the laboratory of Voivodship Inspectorate for Environmental Protection in Warsaw because only this station beside of
w x
ozone provided the empirical values of NO2 as well. Since the solar radiation intensity
Ž .
was not measured by this laboratory, we assumed for our calculations that I t function
Ž .
can be based on purely geometrical considerations related to the eclipse see Fig. 1 . Results are presented in Fig. 3. Since the experimental data were averaged over 30 min, we applied the same averaging constant to the equation solution. The ozone
w x
concentrations are shown together with measured NO2 values. The best agreement
w x 3
between the experimental and the model results was found for the NO0 of 11mgrm .
w x w x
Note that changes of NO2 values are opposite to changes of the O .3
5. Conclusions
In this work, the ozone concentration data from measurements performed in Warsaw
ŽPoland at the time of the partial sun eclipse 11 August 1999 are presented. The. Ž .
measurements were performed by means of DIAL and DOAS systems as well as by conventional point detectors. The decrease of ozone concentration during the eclipse time was clearly observed. The simple model, based on NO –O chemistry, indicatesx 3
that light intensity is the main factor influencing ozone concentration.
Acknowledgements
This work was partially supported by the Polish Committee for Scientific Research
Žproject Nos. 6 P04G 027 17 and 6 P04G 030 17 . We would like to thank the following. Ž
Inspec-. Ž
torate for Environmental Protection in Warsaw , Mrs. J. Iwanek Environmental
Protec-. Ž
tion Agency , Mgr. J. Jarosl
/
awski Institute of Geophysics of Polish Academy of. Ž
Sciences at Belsk as well as Dr. S. Puchalski and Mgr. P. Sobolewski Institute of
.
Meteorology and Water Resources .
References
Ž .
Alloway, B.J., Ayres, D.C., 1998. Chemical Principles of Environmental Pollution. Stanlet Thorns Publishers , UK.
Atkins, P.W., 1984. Physical Chemistry. Oxford Univ. Press, London.
Chudzynski, S., Ernst, S., Stacewicz, K., Szymanski, T., 1997. Mobile Lidar Laboratory. Proceedings of SPIE,´
vol. 3188, pp. 180–185.
Crutzen, P.J., 1995. Overview of tropospheric chemistry: developments during the past quarter century and a look ahead. Faraday Discuss. 100, 1–21.
Finlayson-Pitts, B.J., Pitts Jr., J.N., 1986. Atmospheric Chemistry: Fundamentals and Experimental Tech-niques. Wiley, New York.
Killinger, D.K., Mooradian, A., 1983. Optical and Laser Remote Sensing. Springer-Verlag, Berlin. Seinfeld, J.H., Pandis, S.N., 1998. Atmospheric Chemistry and Physics. Wiley, New York.