Exploring Microsoft Access
Objectives (1 of 2)
• Define field, record, table, and database
• Start Access; describe windows and objects
• Add, edit, and delete records
Objectives (2 of 2)
• Apply filter; sort on one or more fields
• Explain how PivotTable and PivotChart
views display data
Overview
• Every organization uses data
• Intro to database management
• Operations to maintain a database
• Introduction to Access
Introduction to a Database
• Defining a database
• Database window in Access
Database Window
Database Window
Object Buttons Menu Bar
Table Views
• Datasheet view is used to add, edit, or
delete records
• Design view is used to create and modify
fields
• PivotTable view summarizes groups of data
• PivotChart view charts the data from
Datasheet View
Current Record
Total Number of Records
Tables
• Record selector symbol next to current record
shows status
• Triangle indicates saved to disk
• Pencil indicates you are typing
Design View
Primary KeyField Names
Field
Properties Data Type
Tables
• Insertion point:
where text is entered
• Primary key:
unique identifier for each record
Forms, Queries, and Reports
• A
form
is a friendly interface for entering or
modifying a table
• A
query
provides a subset of a table based
on a criteria
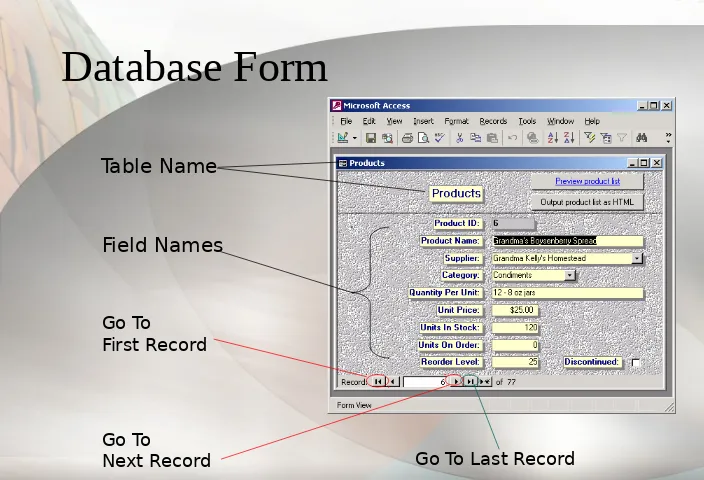
Database Form
Table Name
Go To
Next Record Go To Last Record Go To
First Record
Report
Report Header
Page Header
Close Print Preview
Detail Section
Filters and Sorting
• Filter by Selection is easiest
• Filter by Form allows for comparative
criterion (e.g. >, <)
and allows for
or
filters (e.g. either cosmetics
or shoes)
Filter By Selection
Sorting
The Previous Filtered Records Sorted by City
PivotTable View
PivotChart View
The Previous PivotTable
Relational Database
• Uses multiple tables
Relationships Window
Table NamesModifying Related Information
Clicking plus sign displays all employees at L04
Displaying Related Information
Chapter 1 Summary
• Six object types: Tables, Forms, Queries, Reports,
Macros, & Modules
• Tables views: Design, Datasheet, PivotTable, or
PivotChart
• Data validation is critical
• A filters applies a criteria to display a subset of records