VALIDATION STUDY ON ALOS PRISM DSM MOSAIC AND ASTER GDEM 2
T. Tadono a, *, J. Takakub, M. Shimadaa a
Earth Observation Research Center, Japan Aerospace Exploration Agency (JAXA), Tsukuba, Ibaraki, Japan
- (tadono.takeo, shimada.masanobu)@jaxa.jp
b
Remote Sensing Technology Center of Japan (RESTEC), Tokyo, Japan - [email protected]
Commission IV, WG IV/6
KEY WORDS: DEM/DTM, Global, Satellite, Instruments, Performance
ABSTRACT:
This study aims to evaluate height accuracy of two datasets obtained by spaceborne optical instruments of a digital elevation data for a large-scale area. The digital surface model (DSM) was generated by the Panchromatic Remote-sensing Instrument for Stereo Mapping (PRISM) onboard the Advanced Land Observing Satellite (ALOS, nicknamed ‘Daichi’), and the global digital elevation model (DEM) version 2 (GDEM-2) was derived from the Advanced Spaceborne Thermal Emission and Reflection Radiometer (ASTER) onboard NASA’s TERRA satellite. The test site of this study was the entire country of Bhutan, which is located on the southern slopes of the eastern Himalayas. Bhutan is not a large country, covering about 330 km from east to west, and 170 km from north to south; however, it has large height variation from 200 m to more than 7,000 m. This therefore makes it very interesting for validating digital topographic information in terms of national scale generation as well as wide height range.
Regarding the reference data, field surveys were conducted in 2010 and 2011, and collected ground control points by a global positioning system were used for evaluating precise height accuracies in point scale as check points (CPs), with a 3 arc-sec DEM created by the Shuttle Radar Topography Mission (SRTM-3) used to validate the wide region. The results confirmed a root mean square error of 8.1 m for PRISM DSM and 29.4 m for GDEM-2 by CPs.
* Corresponding author.
1. INTRODUCTION
Topographical information is fundamental to any spatial related applications on Earth, particularly for land areas. Remote sensing satellites have the advantage in such fields because they are capable of global observation and repeatedly. Recently, various satellite data and their derivative datasets were provided to examine global terrains with medium and fine resolutions, as started by the Shuttle Radar Topography Mission (SRTM) spearheaded by the National Aeronautics and Space Administration (NASA) and the National Geospatial-Intelligence Agency (NGA) of the United States (Farr et al., 2007). However, it covers only latitude regions to within +/-60 degrees, and still remains ‘void area’ due to Radar shadowing and low correlations. A further set of data was released as the global digital elevation model Version 1 (GDEM-1) dataset by NASA and the Ministry of Economy, Trade and Industry (METI), Japan on June 2009, using data acquired by the Advanced Spaceborne Thermal Emission and Reflection Radiometer (ASTER) onboard NASA’s TERRA satellite. However, this had several problems in terms of quality and resolution. The second version of ASTER GDEM (GDEM-2) was released on Oct. 17, 2011 and it acquired 260,000 additional scenes over GDEM-1 in order to improve coverage, provide a smaller correlation kernel to yield higher spatial resolution, and improve water masking (Tachikawa et al., 2011a and b). In addition to these, several operational satellites have a function of optical stereo capability, one of them being the Panchromatic Remote-sensing Instrument for Stereo Mapping (PRISM) onboard the Advanced Land Observing Satellite (ALOS, nicknamed ‘Daichi’), which was launched and operated by the Japan Aerospace Exploration Agency (JAXA).
This study aims to evaluate the height accuracy of two datasets of a digital surface model (DSM) and digital elevation model (DEM) derived by spaceborne optical instruments. The former is a DSM generated by PRISM, and the latter is a product of ASTER GDEM-2. The test site of this study covers the entire country of Bhutan, which is located on the southern slopes of the eastern Himalayas. Bhutan is not a particularly large country, covering about 330 km from east to west, and 170 km from north to south; however, it has large height variations from 200 to more than 7,000 m. This is therefore interesting for validating digital topography in terms of national-scale generation and wide height range. Regarding the reference data, the field surveys were conducted in 2010 and 2011, and collected ground control points (GCPs) by a global positioning system (GPS) were used for evaluating precise height accuracies in point-scale as checkpoints (CPs), with a 3 arc-seconds (arcsec) DEM created by SRTM (SRTM-3) used for spatial validation.
2. INSTRUMENTS AND DATA
2.1 PRISM DSM
ALOS was launched on Jan. 24, 2006, and has operated well after the mission target life of five years (Shimada et al., 2010). However, its operation moved to the low load mode (LLM) from Apr. 22, 2011 due to a power generation anomaly. This was subsequently followed by an official termination of the mission on May 12, 2011. However, approximately 6.5 million scenes of archived data produced by three mission instruments, and which cover the entire globe, are available to users. PRISM consists of three radiometers for nadir-, forward-, and backward-looking, and it has a spatial resolution of 2.5 m with a
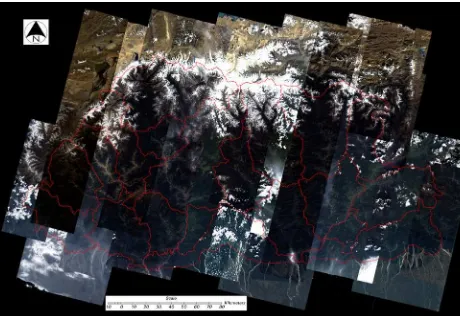
Figure 1. Pan-sharpened mosaic by PRISM and AVNIR-2, covering the entire country of Bhutan (R, G, B = Band 3, 2, 1). The red lines show national and local administration boundaries.
Figure 3. Magnified PRISM DSM mosaic in the northwestern region of Bhutan, showing the location of GPS measurements (yellow: continuous measurement in 2010; red: CPs in 2010; and blue: CPs in 2011; black: masked areas due to clouds).
35 km swath width in triplet mode. It performs along-track triplet stereo observations to generate a precise DSM.
We are developing software called the “DSM and Ortho-image Generation Software for ALOS PRISM (DOGS-AP)” to process the DSM and ortho rectified image (ORI) using PRISM stereo pair images (Takaku and Tadono, 2009a). DOGS-AP also has a function of instrument calibration. Since the launch of ALOS, we have carried out the calibration of PRISM to improve the absolute accuracy of the standard products (Tadono et al., 2009, 2010). This result is reflected by the DOGS-AP software. As a result, GCPs are not essential in processing PRISM DSM and ORI because its standard product has good planimetric accuracy of 6.1 m for nadir radiometer (root mean square error, RMSE). In the past few years, we validated the generated PRISM DSMs at several test sites with various surface conditions (Takaku and Tadono, 2009b, 2010). The DSMs from the airborne Lidar and GCPs were used as reference data, and confirmed height accuracies of PRISM DSMs fell in the range 2.94 to 7.15 m (RMSE), ~3.44 m (bias) and ~6.44 m (standard deviation, STDEV). In addition, in a previous study we also investigated the generation of a DSM mosaic to cover large-scale areas and concluded that the bias error correction only has to consider the height, even if the GCPs were not used in processing them (Takaku and Tadono, 2011).
Figure 2. PRISM DSM mosaic in Bhutan with masked areas (black color) and administration boundaries (red). The yellow square represents the magnified area depicted in Figure 3.
So far, more than 5,500 scenes of PRISM DSM and ORI have been processed at the JAXA Earth Observation Research Center (EORC) for calibration, validation, and scientific research purposes. Some of these are used in this study.
Figure 1 shows a pansharpened mosaic image taken by PRISM and the Advanced Visible and Near Infrared Radiometer type 2 (AVNIR-2), which is another optical instrument onboard ALOS and it has 10 m resolution, showing the entire country of Bhutan which is our study area. The red lines show national and local administration boundaries, which were originally published by GADM (GADM 2009) with some manual corrections then made. This is just used as a reference but it is not exact. Figure 2 shows the mosaic image of PRISM DSM in Bhutan. The gray-scale corresponds to ellipsoid height, which is defined as Geodetic Reference System 1980 (GRS 80) by the 1997 International Terrestrial Reference Frame (ITRF 97) coordination, and black colors show masked areas due to cloud cover. PRISM DSM has 0.3 arcsec (ca. 10 m) pixel spacing.
2.2 ASTER GDEM-2
The TERRA satellite was launched on Dec. 18, 1999, and it is currently working well. ASTER has a 15 m spatial resolution in visible and near infrared band and also has the capability of generating a DEM using a nadir- and backward-looking radiometer. ASTER GDEM-1 was produced from more than 1.2 million-scenes of archived DEMs led by the US Geological Survey (USGS) and the Earth Remote Sensing Data Analysis Center (ERSDAC) of Japan. It covers the entire globe, up to latitudes of 83 degrees north and south with 1 arcsec (ca. 30 m) pixel spacing. However, several artifacts associated with poor stereo coverage at high latitudes, cloud contamination, water masking issues, and degradation of the resolution were found in GDEM-1 product. GDEM-2 was processed with additional scenes to respond these issues, and several efforts could be done by GDEM-2 validation team (Tachikawa et al., 2011a and b), which reported as an elevation accuracies of -0.70 m (bias), 5.9 m (STDEV), and 6.1 m (RMSE) in flat and open areas, and +7.4 m (bias), 12.7 m (STDEV), 15.1 m (RMSE) in mountainous area, and ~0.6 arcsec (averaged magnitude) of horizontal (or planimetric) shifts was also identified in Japan.
2.3 Reference data
In order to validate digital elevation data, two reference data are introduced in this study, i.e., a ground-based GPS measurement and an existing DEM. The ground-based GPS measurements
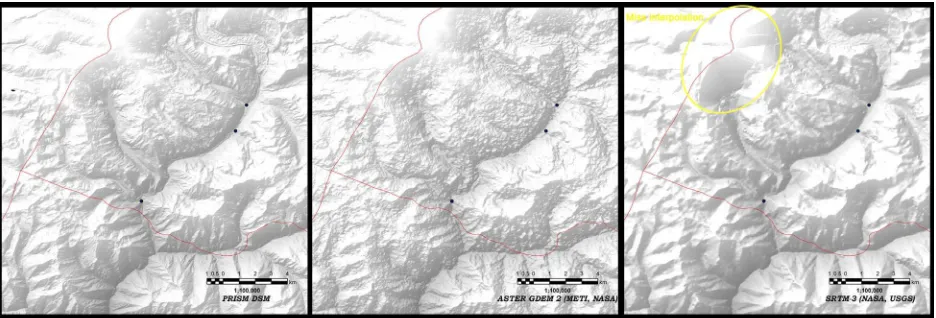
Figure 4. Visual comparison of PRISM DSM (0.3 arcsec, left), ASTER GDEM-2 (1 arcsec, middle) and SRTM-3 (3 arcsec, right) for the same area. The red lines show administration boundaries, and blue dots represent the locations of several CPs in 2011.
Table 1. Summary of validation results using ground-based GPS measurements among SRTM-3, PRISM DSM mosaic, and ASTER GDEM-2 in the Bhutan Himalayans.
Elevation data Size (line / pixel) Number of CPs Bias error (m) Standard deviation (m) RMSE (m)
SRTM-3 6,000 / 3,600 321 4.09 11.52 12.21
PRISM DSM 60,000 / 36,000 3,268 2.28 7.79 8.11
ASTER GDEM-2 18,000 / 10,800 426 16.95 24.08 29.42
were carried out by portable GPS receivers during field surveys in 2010 and 2011 under the project “Study on Glacial Lake Outburst Floods in the Bhutan Himalayas” (Fujita et al., 2012). The reference GPS data consist of two types: point measurements taken as CPs in 2010 and 2011, and continuous GPS measurements taken while trekking in 2010. All ground-based GPS measurements that were post-processed using base-station of GPS data that also installed in the project; therefore, the accuracy of them is expecting less than 1 m (RMSE). However, these measurements include some inaccurate data, which may be caused by shadows from forests and steep terrains, as well as conditions such as dilution of precision (DOP). Therefore, a set of the measurement points that were within +/-30 m of errors with respect to the PRISM DSM were selected as reference data. The threshold value was decided from previous validation results of PRISM DSM (Takaku and Tadono, 2009b, 2010). Figure 3 shows a magnified PRISM DSM mosaic for the area indicated by the yellow square in Figure 2. The locations of the continuous GPS measurements are given by yellow dots, CPs in 2010 by red dots, and CPs in 2011 by blue dots in Figure 3. This CPs is covered altitude in a range from 1,000 to more than 5,000 m above sea level. Another validation effort for the digital elevation data was carried out using SRTM-3 as an existing DEM. It has a 3 arcsec (ca. 90 m) resolution and well validated in the world in both local- and continental-scales with several kinds of the reference data i.e. GCP, airborne- and satellite-based Lidar as well as photogrammetric techniques. This analysis was done by simply overlaying both digital elevation data and SRTM-3, and then calculated height differences as the digital elevation data minus SRTM-3 DEM.
3. RESULTS
3.1 Visual comparisons of digital elevation data
As the first investigation to validate digital elevation data, visual comparison among three datasets is considered. Figure 4 shows an example of visual comparisons between PRISM DSM mosaic with 0.3 arcsec resolution (left), ASTER GDEM-2 with 1 arcsec (middle), and SRTM-3 with 3 arcsec (right) for the
same area of the northwestern region in Figure 3. The red lines show the administrative boundaries as a reference, and the blue dots show the locations of some CPs in 2011. It is clearly identified that PRISM DSM captured the details of terrain features with fine resolution. GDEM-2 gives good resolution, albeit with some noise, and rough terrain features, while SRTM-3 captured good terrain features but with a coarse resolution compared to the others. Such visual resolutions are as expected because they are consistent with the relationship between original spatial resolutions.
It should also be pointed out that an improvement of GDEM-2 over GDEM-1 could be confirmed regarding to its resolution. One problem in GDEM-1 was degradation of spatial resolution, similar to for SRTM-3. However, rough terrain features in GDEM-2 may cause problems in application fields. This probably depends upon the size of the correlation kernel used in processing the DEM, as explained in Section 1, as well as the number of stacking scenes at the point. To reduce such noise or roughness in the DEM, the resolution may again be sacrificed. With regard to the quality of SRTM-3, it sometimes gives void areas as well as misinterpolated areas, as indicated, for example, in yellow in the right hand image of Figure 4. These artifacts are also likely to cause problems in applications. More careful considerations may be necessary for such artifacts, especially for steep and low correlation regions such as covered by snow and ice.
In the case of PRISM DSM mosaic, it looks very good; however, a disappointing thing is that cloud regions are still remaining as shown in Figure 2.
3.2 Point-scale height validation by CPs
First, SRTM-3 is compared to the ground-based GPS data to confirm its accuracy because it will then be used as the reference to validate other digital elevation data. In the past, many validation results of SRTM-3 have been published (e.g., Farr et al., 2007). A literature suggested that the absolute height accuracies of SRTM were in the ranges of 6.0 to 10.0 m of 90 % error, -0.7 to 1.8 m (bias error), and 3.5 to 5.9 m (STDEV) using kinematic GPS data on continental-scale validation campaign, for example (Rodriguez et al., 2006),
Figure 5. Comparison of heights between ground-based GPS measurements and SRTM-3 (red: continuous measurement in 2010; green: CPs in 2010; and blue: CPs in 2011).
Figure 7. Comparison of heights between ground-based GPS measurements and PRISM DSM mosaic (legend is the same as that in Figure 5).
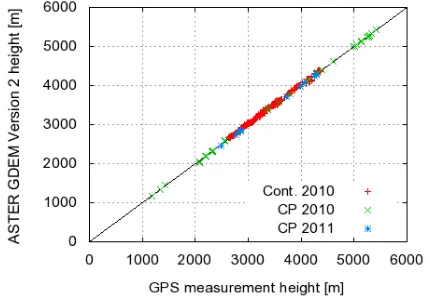
Figure 9. Comparison of heights between ground-based GPS measurements and ASTER GDEM-2 (legend is the same as that in Figure 5).
and the greatest errors were associated with steep terrain (i.e.
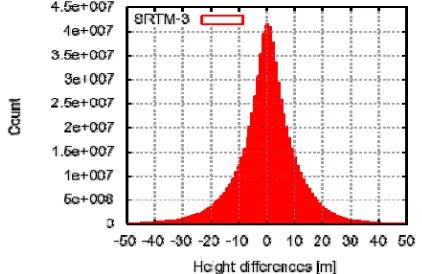
Himalaya, Andes) and very smooth sandy surfaces with low signal-to-noise ratio (SNR) such as deserts (Farr et al., 2007). Figure 5 shows a height validation result of SRTM-3 in Bhutan with CPs where 321 CPs that consist of the continuously measured 278 points in 2010, 34 CPs in 2010, and 9 CPs in 2011. Figure 6 represents a histogram of height differences between SRTM-3 and CPs. The shape of the histogram shows an approximately Gaussian distribution. The upper row of Table
Figure 6. Histogram of height differences between SRTM-3 and ground-based GPS measurements.
Figure 8. Histogram of height differences between PRISM DSM mosaic and ground-based GPS measurements.
Figure 10. Histogram of height differences between ASTER GDEM-2 and ground-based GPS measurements.
1 summarizes the statistical results with 4.1 m (bias error), 11.5 m (STDEV), and 12.2 m (RMSE) confirmed. These values show a slightly lower accuracy compared with past validation results. This may be due to their steep terrains in Bhutan Himalayas. It will be however used as the reference for validating other elevation data in Bhutan.
Second, PRISM DSM mosaic is validated using CPs, where were used a total of 3,268 CPs consisting of the continuously measured 3,198 points in 2010, 59 CPs in 2010, and 11 CPs in 2011. Figure 7 shows the relationship of height between PRISM
Figure 11. Height difference image of PRISM DSM minus SRTM-3 in Bhutan. The black colors show the masked areas in the PRISM DSM, while the green colors represent the void data areas in SRTM-3.
Figure 13. Histogram of height differences between PRISM DSM mosaic and SRTM-3.
DSM and CPs, with the results listed in the middle row of Table 1. Figure 8 represents a histogram of height differences between PRISM DSM mosaic and ground-based GPS measurements, showing a Gaussian distribution. It confirmed that the height accuracy of the PRISM DSM mosaic was 2.3 m (bias), 7.8 m (STDEV), and 8.1 m (RMSE). These results are relatively consistent with previous validation results, as explained in Section 2.1 (Takaku and Tadono, 2009b, 2010). To obtain height accuracy above mentioned from the generated PRISM DSM, planimetric accuracy should also be good for both a DSM and ORI, except for low correlation regions, e.g., clouds, oceans, and saturated pixels. This is an advantage of simultaneous generation both a DSM and ORI using optical stereo pair images with precise planimetric accuracy.
Third, ASTER GDEM-2 product was evaluated using CPs. Figure 9 shows the relationship of height between ASTER GDEM-2 and 426 CPs consisting of the continuously measured 356 points in 2010, 59 CPs in 2010, and 11 CPs in 2011. Figure 10 represents a histogram of height difference between ASTER GDEM-2 and ground-based GPS measurements, and it has a relatively strange distribution that may be related to the capturing of rough terrain features as explained in Figure 4. The lower row of Table 1 summarizes the statistical results, with 17.0 m (bias error), 24.1 m (STDEV), and 29.4 m (RMSE) confirmed. This is not as good as previous report as explained in Section 2.2 especially bias error (Tachikawa et al., 2011b). This may be related with horizontal shift of GDEM-2 product. If this bias error is corrected, RMSE may become around 13 m. This may be reasonable. We are not sure that such bias offset is only in the Bhutan Himalayas, but also other regions.
Figure 12. Height difference image of ASTER GDEM-2 minus SRTM-3 in Bhutan. The black lines show administration boundaries as a reference. The void areas of SRTM-3 were not considered in this figure.
3.3 Large-scale height validation with SRTM-3
Spatial height differences are investigated in this subsection. Based on the results in Section 3.2, the height accuracy of SRTM-3 may not be sufficient for it to be used as a reference data for validating other digital elevation data in particular for PRISM DSM mosaic because it has better height accuracy. However, it is used in this study for large-scale investigation except for the void areas.
Figures 11 and 12 show images of height differences between PRISM DSM mosaic and SRTM-3, and ASTER GDEM-2 and SRTM-3, for the entire country of Bhutan. These are simply calculated slave digital elevation data minus SRTM-3, and no attempt was made to co-register between the datasets. The white colors represent areas in which the height difference is around 0 m, while red and blue graduations correspond to areas with +/-30 m differences, and more than +/-30 m filled in red and blue, respectively. Note that the black colors show the masked areas in the PRISM DSM, while green colors represent the void data areas in SRTM-3, in which many areas still remain void due to steepness and other features in Figure 11. On the other hand, the void areas of SRTM-3 were not considered in Figure 12, therefore showing the effects of these void areas on the data
Regarding to PRISM DSM mosaic, the large errors shown by blue and red colors in Figure 11 are seen around the north central section of the Bhutan Himalayas, which is the highest and most mountainous region of Bhutan covered by glaciers and snow. These height errors may have occurred in the PRISM DSM due to a lack of image matching accuracy. However, regions of misinterpolation in SRTM-3 in the northeastern Bhutan, like right of Figure 2, were not allocated in green as void data. Again, it is necessary for careful consideration to be made for void areas as well as the misinterpolated areas in SRTM-3. Generally, the void areas can be identified because it assigns ‘-9999’ pixel value in original SRTM-3 data, but mis-interpolation areas cannot be identified. In addition, spatial systematic error could not be found in Figure 11, therefore, we expect that the stacking and mosaicing processes worked well when generating the PRISM DSM mosaic. Figure 13 represents a histogram of the height differences between PRISM DSM and SRTM-3, which clearly displays characteristics of a Gaussian distribution. More than seven hundred million DSM heights were compared in this validation, and -0.4 m (bias), 20.7 m (STDEV), and 20.7 m (RMSE) of height accuracy was obtained for PRISM DSM mosaic.
Regarding to ASTER GDEM-2 product, it covered the entire Bhutan, but some systematic errors could be found in along path strips as well as neighbouring scene that represented by blue or red gaps in Figure 12. These artifacts cause linear steps in GDEM-2. This was also reported in previous literature and may depend on the number of stacking original ASTER data (Tachikawa et al., 2011b). The number of linear step appearances was reduced in GDEM-2 from GDEM-1 as improvement; however it is still remaining especially less than around 5 stack regions and causes about 10 m height gap. As the statistical result of height differences between GDEM-2 and SRTM-3, more than 2.1 million pixels were compared in this evaluation, and -1.0 m (bias), 67.4 m (STDEV) of height accuracy including void areas of SRTM-3 was confirmed. These validation exercises of digital elevation data are difficult to be certain of their accuracy because both reference data still remain uncertain. The GPS measurements are limited in terms of coverage area and accuracy, while SRTM-3 has void and interpolation regions likely with low accuracy. This is also difficult to evaluate in global. The important things are that to clarify what reference data are used for evaluation, and how much accurate them in the paper.
4. CONCLUSIONS
In this study, we validated two digital elevation datasets i.e.
PRISM DSM mosaic and ASTER GDEM-2 that was newly released on October 2011, in the entire states of Bhutan using CPs acquired ground-based GPS measurements and SRTM-3 as reference data. Bhutan is small country but it contains eastern Himalayans; therefore it can be said relatively hard condition to do it. Firstly, SRTM-3 was evaluated by CPs and 4.1 m (bias) and 12.2 m (RMSE) accuracy was confirmed. Secondly, PRISM DSM mosaic had 2.3 m (bias) and 8.1 m (RMSE) accuracy using CPs. This result may also outcome of good planimetric accuracy of standard products. Nonetheless, SRTM-3 was used as reference data of existing DEM to evaluate large region, and result showed -0.4 m (bias) and 20.7 m (RMSE) accuracy for PRISM DSM in Bhutan. Thirdly, ASTER GDEM-2 was confirmed 17.0 m (bias) and GDEM-29.4 m (RMSE) accuracy by CPs that a little bit worth result compared with published report and still remaining linear steps that causes height gaps between neighbouring scenes. These results are depends on a number of stacking scene-frame DEMs of ASTER and their planimetric accuracy. This is issue to make large-scale mosaic of digital elevation data. Another disappointing thing is cloud covers for optical stereo observation especially for PRISM DSM. ALOS-3 optical satellite is now discussing under Japanese government as following PRISM (Imai et al., 2011), and be able to achieve generate precise DSM product in globe without clouds combining with PRISM’s one.
References
Farr, T. G., P. A. Rosen, E. Caro, R. Crippen, R. Duren, S. Hensley, M. Kobrick, M. Paller, E. Rodriguez, L. Roth, D. Seal, S. Shaffer, J. Shimada, J. Umland, M. Werner, M. Oskin, D. Burbank, and D. Alsdorf, 2007. The Shuttle Radar Topography Mission. Report on the Jet Propulsion Laboratory, California Institute of Technology, California, US.
http://www2.jpl.nasa.gov/srtm/SRTM_paper.pdf (10 Jan. 2012). Fujita, K., K. Nishimura, J. Komori, S. Iwata, J. Ukita, T. Tadono, and T. Koike, 2012. Outline of research project on glacial lake outburst floods in the Bhutan Himalayas. Global Environmental Research, 16, in press.
GADM 2009. GADM database of Global Administrative Areas. http://www.gadm.org/country (11 Jan. 2012).
Imai, H., H. Katayama, M. Takahashi, T. Tadono, Y. Hatooka, S. Suzuki, and Y. Osawa, 2011. Outline of Advanced Land Observing Satellite-3 and its instruments. Proc. SPIE, 8176, International Society for Optics and Photonics, in press. Rodriguez, E., C. S. Morris, and J. E. Belz, 2006. A global assessment of the SRTM performance. Photogrammetric Engineering and Remote Sensing, American Society for Photogrammetry and Remote Sensing, 72(3), pp. 249-260. Shimada, M., T. Tadono, and A. Rosenqvist, 2010. Advanced Land Observing Satellite (ALOS) and monitoring global environmental change. Proc. the IEEE, 98(5), pp. 780-799. Tachikawa, T., M. Hato, M. Kaku, and A. Iwasaki, 2011a. The characteristics of ASTER GDEM version 2. Proc. IGARSS 2011, IEEE, CD-ROM.
Tachikawa, T., M. Kaku, A. Iwasaki, D. Gesch, M. Oimoen, Z. Zhang, J. Danielson, T. Krieger, B. Curtis, J. Haase, M. Abrams, R. Crippen, and C. Carabajal, 2011b. ASTER global digital elevation model version 2 -Summary of validation results, Tokyo, Japan.
http://www.ersdac.or.jp/GDEM/E/1.html (20 Oct. 2011). Tadono, T., M. Shimada, H. Murakami, and J. Takaku, 2009. Calibration of PRISM and AVNIR-2 onboard ALOS "Daichi".
Transactions on Geoscience and Remote Sensing, IEEE, 47(12), pp. 4042-4050.
Tadono, T, T. Iwara, M. Shimada, J. Takaku, and S. Kawamoto, 2010. Updated results of calibration and validation of PRISM onboard ALOS. Proc. IGARSS 2010, IEEE, CD-ROM. Takaku, J. and T. Tadono, 2009a. PRISM on-orbit geometric calibration and DSM performance. Transaction on Geoscience and Remote Sensing, IEEE, 47(12), pp. 4060-4073.
Takaku, J. and T. Tadono, 2009b. High resolution DSM generation from ALOS PRISM -Status updates on over three year operations-. Proc. IGARSS 2009, IEEE, CD-ROM. Takaku, J. and T. Tadono, 2010. High resolution DSM generation from ALOS PRISM -Processing status and influence of attitude fluctuation-. Proc. IGARSS 2010, IEEE, CD-ROM. Takaku, J. and T. Tadono, 2011. High resolution DSM generation from ALOS PRISM -Archiving and mosaicing-,
Proc. IGARSS 2011, IEEE, CD-ROM. Acknowledgements:
A part of this study was carried out under the project “Study on Glacial Lake Outburst Floods in the Bhutan Himalayas,” supported by the Japan Science and Technology Agency (JST) and the Japan International Cooperation Agency (JICA), under the “Science and Technology Research Partnership for Sustainable Development (SATREPS).” We also gratefully acknowledge all of our colleagues on the project for collaborations.
The original data of ASTER GDEM-2 is the property of METI and NASA, and SRTM-3 is of NASA and USGS.