EVALUATION OF CORRECTION METHODS OF
CHROMATIC ABERRATION IN DIGITAL CAMERA IMAGES
R. Matsuoka a, *, K. Asonuma a, G. Takahashi a, T. Danjo a, K. Hirana a
a
Kokusai Kogyo Co., Ltd., 2 Rokubancho, Chiyoda-ku, Tokyo 102-0085, Japan
(ryuji_matsuoka, kazuyoshi_asonuma, genki_takahashi, takuya_danjo, kayoko_hirana)@kk-grp.jp
Commission III, WG III/1
KEY WORDS: Correction, Comparison, Calibration, Optical, Distortion, Camera, Non-Metric, Experiment
ABSTRACT:
This paper reports an experiment conducted to evaluate correction methods of chromatic aberrations in images acquired by a non-metric digital camera. The chromatic aberration correction methods evaluated in the experiment are classified into two kinds. One is the method to correct image coordinates by using camera calibration results of color-separated images. The other is the method based on the assumption that the magnitude of chromatic aberrations can be expressed by a function of a radial distance from the center of an image frame. The former is classified further into five types according to the difference of orientation parameters common to all colors. The latter is classified further into three types according to the order of the correction function. We adopt a linear function, a quadratic function and a cubic function of the radial distance as a correction function. We utilize a set of 16 convergent images shooting a white sheet with 10 by 10 black filled circles to carry out camera calibration and estimate unknown coefficients in the correction function by means of least squares adjustment. We evaluate the chromatic aberration correction methods by using a normal image shooting a white sheet with 14 by 10 black filled circles. From the experiment results, we conclude that the method based on the assumption that the magnitude of chromatic aberrations can be expressed by a cubic function of the radial distance is the best method of the evaluated methods, and would be able to correct chromatic aberrations satisfactorily enough in many cases.
1. INTRODUCTION
As performance of a digital camera becomes better and its price becomes lower in recent years, digital camera images are becoming more popular in diverse fields. The recent increase in number of pixels of images acquired by a non-metric digital camera encourages a nonprofessional to utilize it for image measurement. A non-metric digital camera is required to be geometrically calibrated when it is used for image measurement. Camera calibration to estimate a calibrated principal distance, offsets from the principal point to the center of an image frame, a radial lens distortion component, and a decentering lens distortion component becomes essential for precise image measurement by using a non-metric digital camera.
On the other hand, the magnitude of displacements between different colors (red (R), green (G), blue (B)) caused by chromatic aberrations are smaller than 1 / 10 of the magnitude of radial lens distortions in almost all the non-metric digital cameras. However, as a pixel size on the focal plane of a non-metric digital camera becomes smaller, the influence of chromatic aberrations becomes greater. Currently, correction of chromatic aberrations would be indispensable for precise image measurement by using images acquired by a non-metric digital camera.
Kaufmann and Ladstädter (2005) reported an experiment to correct chromatic aberrations by using a lateral chromatic aberration model expressed by a linear function of a radial distance from the center of an image frame. They estimated the model by means of least squares adjustment. The correction method proposed by them is easy for a nonprofessional, but their results indicated that the effect of the correction would be
limited. Luhmann et al. (2006a) reported an experiment to correct chromatic aberrations by using a chromatic aberration model expressed by a series of odd powered terms of a radial distance added to the ordinary radial lens distortion model. They estimated the model by means of self-calibrating bundle adjustment. The report showed the results on the accuracy of close-range photogrammetry, but the effect of the correction was not shown in the report. The implementation of the function to estimate the model would not be easy for a nonprofessional as well. Mallon and Whelan (2007) and Hattori
et al. (2011) also reported experiments to correct chromatic aberrations by using their chromatic aberration models based on the Brown’s distortion model (Brown 1966). Their experiment results did not necessarily indicate that their proposed correction methods are able to provide satisfactory correction results equal to the measurement accuracy of single point features described in the literature by Luhmann et al. (2006b).
This paper reports an experiment conducted to evaluate several correction methods of chromatic aberrations in images acquired by a non-metric digital camera.
2. CHROMATIC ABERRATION CORRECTION
2.1 Chromatic aberration
Chromatic aberrations are caused by the variation of refractive index with wavelength, and produce lateral (oblique) distortions and axial (longitudinal) distortions (McGlone et al., 2004). As for image measurement, the lateral chromatic aberrations that bring geometric errors are more influential than the axial chromatic aberrations that bring image blurs. Displacements
Type (Xi, Yi, Zi)
Table 1. Orientation parameters in the camera calibration of the Types A-1 to A-5
: To be estimated
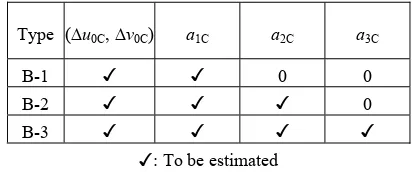
Table 2. Coefficients in the correction function of the Types B-1 to B-3
between different colors caused by the lateral chromatic aberrations are point symmetric and the magnitude of the displacements is proportional to a radial distance from the principal point of a camera. Accordingly, the lateral chromatic aberration is often referred to as a chromatic difference in magnification.
A compound lens assembled from several lens elements made of substances with different refractive indexes can be utilized to reduce chromatic aberrations (Shibuya, 2005a, Shibuya, 2005b). The most common type is an achromatic doublet composed of two elements made of crown glass and flint glass. By combining more than two lenses of different composition, the degree of correction can be further increased. However, exact correction by using a compound lens can be made only at a small set of wavelengths, and it is impossible to correct chromatic aberrations perfectly at any wavelength over the visible range.
2.2 Evaluated correction methods
We conducted an experiment to evaluate correction methods of chromatic aberrations in images acquired by a non-metric digital camera. We treated the green (G) as the reference color in the experiment, and examined methods to correct displacements GR between the red (R) and the green (G), and displacements GB between the blue (B) and the green (G).
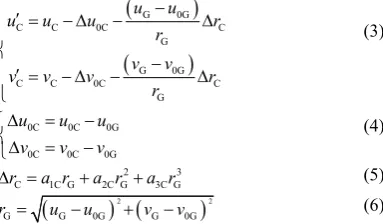
(uR, vR), (uG, vG) and (uB, vB) are uncorrected image coordinates of R, G and B respectively, and (uC, vC) are uncorrected image coordinates of the target color (C), that is, C = R or C = B from now on. (u0R, v0R), (u0G, v0G), (u0B, v0B) and (u0C, v0C) are uncorrected image coordinates of the center of an image frame of R, G, B and the target color (C = R or B) respectively as well. Moreover, (uR, vR), (uG, vG), (uB, vB) and (uC, vC) are corrected image coordinates of R, G, B and the target color (C = R or B) respectively.
The chromatic aberration correction methods evaluated in the experiment were classified into two kinds. One was the method to correct image coordinates by using camera calibration results of color-separated images (R, G, B). The other was the method based on the assumption that the magnitude of lateral chromatic aberrations can be expressed by a function of a radial distance from the center of an image frame. The former was classified further into five types (Types A-1 to A-5) according to the difference of orientation parameters common to all colors. On the other hand, the latter was classified further into three types (Types B-1 to B-3) according to the order of the correction function. Furthermore, we evaluated the chromatic aberration correction function of a piece of commercial software (Type-C).
2.2.1 Types A-1 to A-5: We adopted the following image distortion model for the Types A-1 to A-5:
are the offsets from the principal point of a camera to the center of an image frame, (k1, k2, k3) are the coefficients of radial distortions, (p1, p2) are the coefficients of decentering distortions. The image distortion model expressed as Equations (1) and (2) is one of the most popular image distortion models in close range photogrammetry (Luhmann et al., 2006b).The Type A-1 had no common orientation parameters to all colors, that is to say, camera calibration using each color image was carried out independently. Space coordinates (Xi, Yi, Zi) of
calibration points were common to all colors for the Types A-2 to A-5. Exterior orientation parameters (X0, Y0, Z0), (, , ) were common to all colors for the Types A-3 to A-5. Coefficients (k1, k2, k3), (p1, p2) of radial and decentering distortions were common to all colors for the Types 4 and A-5. All colors had the common offsets (xP, yP) from the principal point to the center of an image frame for the Type A-5. Orientation parameters common to all colors in the camera calibration of the Types A-1 to A-5 are summarized in Table 1.
2.2.2 Types B-1 to B-3: Considering that the magnitude of lateral chromatic aberrations of a single lens element is proportional to a radial distance from the principal point of a camera and the simplest approximation of radial distortions is expressed in the third power of a radial distance, we adopted a linear function, a quadratic function and a cubic function of the radial distance rG of the reference color (G) for the Types B-1, B-2 and B-3 respectively. The following equations can be utilized for the Types B-1 to B-3 to correct chromatic aberrations:
Abbreviation E-P2 20D-C 50D-T
Camera Olympus PEN E-P2 Canon EOS-20D Canon EOS-50D
Sensor size 17.3 mm × 13.0 mm 22.5 mm × 15.0 mm 22.3 mm × 14.9 mm
An “element” is a single piece of glass in a lens. A single uncemented element, or two or more elements cemented together are called a “group”. For instance, the right figure shows the construction of the Tessar which is a famous photographic lens. The Tessar consists of 4 elements in 3 groups: one positive crown glass element at the front (left), one negative flint glass element at the center and a negative plano-concave flint glass element cemented with a positive convex crown glass element at the rear (right).
Table 3. Specifications of the investigated cameras
Figure 1. Images for correction parameter estimation Figure 2. Image for evaluation
an image frame by demosaicing, and a1C is the coefficient expressing the difference of the focal lengths, a2C, a3C expressing the difference of the radial distortions between the target color (C = R or B) and the reference color (G). (u0C, v0C) and a1C, a2C, a3C in Equations (3) to (6) are estimated by means of least squares adjustment. Unknown coefficients (u0C, v0C) and a1C, a2C, a3C to be estimated for the Types B-1 to B-3 are summarized in Table 2.2.2.3 Type C: We evaluated the chromatic aberration correction function of the commercial software DxO Optics Pro v6 as Type-C. The DxO Optics Pro v6 offered by the DxO Labs is a piece of raw conversion and image quality enhancement software, and the DxO Optics Pro v6 makes a calibrated, lens-specific correction for chromatic aberration based on the DxO’s unique modeling techniques. The chromatic aberration correction takes place as part of the DxO’s distortion and sharpening algorithms, where the calibrated corrections are applied to the three color channels independently, which is a good solution for the equipment-dependent errors according to the DxO Labs (2011).
3. OUTLINE OF EXPERIMENT
3.1 Investigated Cameras
We investigated the following non-metric lens-interchangeable digital cameras in the experiment: Olympus PEN E-P2 with Olympus M.ZUIKO DIGITAL 17 mm F 2.8 lens, which is called E-P2 for short from now on, Canon EOS 20D with Canon EF-S 18 - 55 mm F 3.5 - 5.6 USM lens, which is called 20D-C for short, and Canon EOS 50D with Tamron 18 - 270 mm F 3.5 - 6.3 Di II VC lens, which is called 50D-T for short. Table 3 shows the specifications of the investigated cameras. The 20D-C and the 50D-T were investigated at the widest view of their zoom lenses.
3.2 Camera calibration for Types A-1 to A-5
Camera calibration for the Types A-1 to A-5 was carried out by using images which were acquired following the procedure of the PhotoModeler Pro 5 software (EOS Systems Inc., 2003). A set of calibration points distributed on a 2D plane was utilized in the camera calibration. We utilized 10 by 10 black filled circles on a white sheet as calibration points. A round of camera calibration utilized a set of 16 convergent images acquired from 4 different directions with 4 different camera frame rotation angles of 0°, +90°, +180°, and −90° around the optical axis of a camera. Figure 1 shows images utilized in the camera calibration. Image coordinates of the calibration points were measured by the intensity-weighted centroid method. We developed a piece of camera calibration software dedicated to the Types A-3 to A-5.
(a-1) E-P2 / GR (b-1) 20D-C / GR (c-1) 50D-T / GR
(a-2) E-P2 / GB (b-2) 20D-C / GB (c-2) 50D-T / GB
Figure 3. Displacement vectors in the uncorrected image (Unit: pixel)
(a) E-P2 (b) 20D-C (c) 50D-T
Figure 4. Signed displacement dC vs. radial distance rG of the uncorrected image
3.3 Unknown coefficients estimation for Types B-1 to B-3
As for the Types B-1 to B-3, unknown coefficients in Equations (3) to (6) were estimated by means of least squares adjustment using the same set of 16 images as that of the 16 convergent images utilized in the camera calibration for the Types A-1 to A-5. Image coordinates of the calibration points were also measured by the intensity-weighted centroid method.
3.4 Evaluation of correction methods
We evaluated the chromatic aberration correction methods by using a normal image shooting a white sheet with 14 by 10 black filled circles which are called evaluation points in the experiment. Image coordinates of the evaluation points were measured by the intensity-weighted centroid method as well. Figure 2 shows an image utilized in the evaluation.
4. RESULTS AND DISCUSSION
4.1 Evaluation index
In order to evaluate correction methods of chromatic aberrations we calculated a signed displacement dC of a displacement vector GC from the reference color (G) to the target color (C = R or B) by the following equation:
2 2
C
2 2
C G C G C G
C G C G C G
, if
, if
u u v v r r
d
u u v v r r
(7)
2 2
2 2
C C 0C C 0C
G G 0G G 0G
r u u v v
r u u v v
(8)
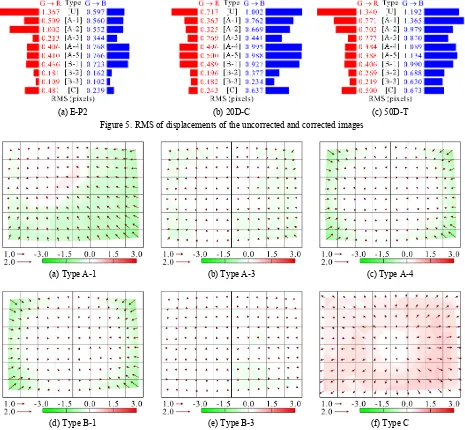
(a) E-P2 (b) 20D-C (c) 50D-T Figure 5. RMS of displacements of the uncorrected and corrected images
(a) Type A-1 (b) Type A-3 (c) Type A-4
(d) Type B-1 (e) Type B-3 (f) Type C
Figure 6. Displacement vectors GR in the corrected image of the E-P2 (Unit: pixel)
where rC and rG are radial distances from the center of an image frame of the target color (C = R or B) and the reference color (G) respectively. A displacement vector GC with a positive value of dC turns outward, while one with a negative value of dC turns inward.
4.2 Chromatic aberrations in the uncorrected images
Figure 3 shows displacement vectors GR and GB of 140 evaluation points in the uncorrected images. Figure 4 shows signed displacements dC (C = R or B) against radial distances rG of the uncorrected image. Solid lines in Figure 4 show the following approximate cubic functions estimated by means of least squares adjustment using the evaluation points for reference:
C 0C 1C G 2C G2 3C G3
d b b r b r b r (9)
The results indicate that the displacements GR and GB were larger than the ordinary measurement errors of image coordinates. Accordingly we concluded that correction of chromatic aberrations is indispensable for precise image
measurement by using images acquired by these non-metric digital cameras.
Figures 3 and 4 indicate that the signed displacements dC would depend on the radial distance rG. These figures show that the signed displacements dC would be unable to be approximated with a linear function of the radial distance rG as well. On the contrary, Figure 4 indicates that the displacements dC might be able to be approximated with a cubic function of the radial distance rG accurately enough except the displacements GB of the 50D-T. Figure 3 (c-2) shows that the displacements GB of the 50D-T might be caused by off-center chromatic aberrations which cannot be expressed in Equations (3) to (6).
4.3 Evaluation of correction methods
Figure 5 shows root mean squares (RMSs) of displacements dC (C = R or B) in the uncorrected and corrected images. The results shown in Figure 5 indicate that the Type B-3 provided the best correction results of the evaluated methods and the Type B-2, the Type A-3 provided the second-, third-best correction results as well. On the contrary, the results show that
(a-1) E-P2 / GR (b-1) 20D-C / GR (c-1) 50D-T / GR
(a-2) E-P2 / GB (b-2) 20D-C / GB (c-2) 50D-T / GB
Figure 7. Displacement vectors in the images corrected by the Type B-3 (Unit: pixel)
Type E-P2 20D-C 50D-T
A-1 (R) 0.312 0.208 0.489
(G) 0.304 0.205 0.482
(B) 0.309 0.213 0.487
A-2 0.311 0.211 0.488
A-3 0.311 0.210 0.489
A-4 0.346 0.258 0.501
A-5 0.584 1.008 1.009
Table 4. RMSE in the camera calibration (Unit: pixel) the Type B-1, which is the method based on the linear lateral chromatic aberration model, would be unable to correct chromatic aberrations sufficiently. The results that the Types B-2 and B-3 made more satisfactory corrections than the Type B-1 suggest that the fact that the investigated lenses are constructed with several lens elements would produce nonlinear lateral chromatic aberrations. Moreover, the results show that the effectiveness of the Type C by the DxO Optics Pro v6 should be nearly equal to that of the Type B-1.
The results shown in Figure 5 indicate that the Types 1 to A-5 except for the Type A-3, which are the methods to correct image coordinates by using camera calibration results, would be unable to correct chromatic aberrations sufficiently. Table 4 shows root mean squares of errors (RMSEs) in the camera calibration. Although the RMSEs of the Types A-1 and A-2 in the camera calibration were small enough, the correction results by the Types A-1 and A-2 were not so good. We think that the image distortion model expressed as Equations (1) and (2) would not have been estimated accurately enough to correct chromatic aberrations, because one or more parameters in the image distortion model have a high correlation with some exterior orientation parameter. Table 4 also indicates that the Type A-5 is an inappropriate method from the point of view of camera calibration. The correction results shown in Figure 5
demonstrate that the Type A-3, where each color has an independent image distortion model, might be able to make satisfactory corrections.
Figure 6 shows displacements GR in the corrected images of the E-P2 by some typical correction methods: the Types A-1, A-3, A-4, B-1, B-3 and C. The displacement vectors in the corrected image by the Type B-3 would turn randomly, while the directions of the displacement vectors in the corrected image by the other methods would indicate the existence of systematic residuals in the corrected image.
Figure 7 shows displacements GR and GB in the corrected images of all the cameras by the Type B-3. Figures 5 (c) and 7 (c-2) indicate that the Type B-3 would be unable to make satisfactory corrections as to chromatic aberrations between the blue (B) and the green (G) in images acquired by the 50D-T. Furthermore, directions of the displacement vectors GB in Figure 7 (c-2) would indicate the existence of systematic residuals in the corrected image. Wider distribution of displacements dC around the approximate cubic curve shown in Figure 4 (c) would be a cause of the systematic residuals in the corrected image by the Type B-3.
Since there must be some cameras whose chromatic aberrations cannot be corrected satisfactorily enough by the Type B-3, we are now planning to conduct an experiment to find out a new correction method applicable to these cameras. One of promising correction methods is an extension of the Type B-3 which applies the following equations to correct chromatic aberrations instead of Equations (3) to (6):
image coordinates of the center of off-center radial distortions and a1C is the coefficient expressing the difference of the focal lengths, a3C, a5C, a7C expressing the difference of off-center radial distortions between the target color (C = R or B) and the reference color (G). (u0C, v0C), (uFC, vFC) and a1C, a3C, a5C,a7C in Equations (9) to (12) are estimated by means of least squares adjustment. The method is able to deal with off-center and higher order radial distortions which might bring the displacements GB of the 50D-T shown in Figures 3 (c-2) and 4 (c).
5. CONCLUSION
From the experiment results, we concluded that the correction method the Type B-3, which is the method based on the assumption that the magnitude of chromatic aberrations can be expressed by a cubic function of the radial distance from an image frame center, is the best method of the evaluated methods, and would be able to correct chromatic aberrations satisfactorily enough in many cases.
However, we think that there must be some cameras whose chromatic aberrations cannot be corrected satisfactorily enough by the Type B-3. Accordingly we are now planning to conduct an experiment to find out a new correction method applicable to these cameras. Furthermore we intend to investigate other cameras in the next experiment.
REFERENCES
Brown, D., 1966. Decentering Distortion of Lenses,
Photogrammetric Engineering, Vol. 32, No. 3, pp. 444-462.
DxO Labs, 2011. “DxO Optics Pro - Features - Chromatic aberration”,
http://www.dxo.com/intl/photo/dxo_optics_pro/features/optics_ geometry_corrections/aberration (27 Dec. 2011)
EOS Systems Inc., 2003. PhotoModeler Pro 5 User Manual, 20th Edition, EOS Systems Inc., Vancouver, Canada. pp. 118-121.
Hattori, S., Imoto, H., Ohnishi, Y., Ikeda, K., 2011. Chromatic Aberration Compensation for Industrial Vision Metrology,
Technical report of IEICE, Multimedia and virtual environment, Vol. 110, No. 457, pp. 225-230.
Kaufmann, V. and Ladstädter, R., 2005. Elimination of Color Fringes in Digital Photographs Caused by Lateral Chromatic
Aberration, Proceedings of CIPA 2005 XX International Symposium, Turin, Italy, pp. 403-408.
Luhmann, T., Hastedt, H., Tecklenburg, W., 2006a. Modelling of Chromatic Aberration for High Precision Photogrammetry,
The International Archives for Photogrammetry and Remote Sensing, Dresden, Germany, Vol. XXXVI, Part 5, pp. 173-178.
Luhmann, T., Robson, S., Kyle, S., Harley, I., 2006b. Close Range Photogrammetry, Whittles Publishing, Caithness, pp. 114-129, pp. 364-375.
Mallon, J. and Whelan, P.F., 2007. Calibration and Removal of Lateral Chromatic Aberration in Images, Pattern Recognition Letters, Vol. 28, No. 1, pp. 125-135.
McGlone, J.C., Mikhail, E.M., Bethel, J., Eds., 2004. Manual of Photogrmmetry, Fifth Edition, American Society for Photogrammetry and Remote Sensing, Bethesda, MD, USA, pp. 346-349.
Shibuya, M., 2005a. Tutorial of Lens Optics (14), O plus E, Vol. 27, No. 10, pp. 1182-1187.
Shibuya, M., 2005b. Tutorial of Lens Optics (15), O plus E, Vol. 27, No. 11, pp. 1308-1313.