THE INFLUENCE OF THE REGION
’S
FINANCIAL
PERFORMANCE TO THE ECONOMIC GROWTH OF
REGENCIES/CITIES IN THE PROVINCE OF SOUTH
SUMATERA
performance of the economic growth of regencies/cities in South Sumatera Province. The financial performance of such the local governments consists of : Fiscal Decentralization, the ability of being autonomous, Effectiveness and efficiency. Such the study is conducted in the quantitative form by using “doubled regression” of the 2006 – 2015 data panel.Based on partially calculation, fiscal decentralization has coefficient of regression such as 62.73185, which means that fiscal decentralization has a positive and significant influence to the economic growth. Further more, the financial autonomous ability has coefficient of regression -16.04656, means that the financial autonomous ability of the local governments has a negative and significant influence to the economic growth. From the point of view of the financial effectiveness of the local governments, it has coefficient of regression -0.074855, meaning that effectiveness has a negative influence but not significant to the economic growth. The financial efficiency has coefficient regression of -0.254122, meaning that efficiency has negative influence and not significant to the economic growth.
Based on the comprehensive calculation : Fiscal Decentralization, Financial autonomous, Effectiveness and Efficiency has a positive and significant influence to the economic growth. This means that the local governments financial performance is very much influencing the economic growth in such the regions and cities in South
Regional Autonomy authorizing the local governments (regencies/cities) to explore the potential sources of its revenues as the fund to administer each of their region. As it is stressed by Suparmoko (2012) that the regional autonomy is defined as
Regencies/cities in South Sumatera Province are different from one to another in regard with its potential and sources of income. This will creates Partiality (imbalances), that caused by the differences of its natural sources, by the differences in demographical conditions, by the unsmooth of goods and services mobility, by the difference of the concentration of the regional economic activities, and by the difference of the allocation of the development budget in each region. The allocation of the development budget is different from one to another region. It is because of each region has its different source of income to finance the difference payments such as the source of income which is coming from Regional Original Income (PAD), from Proportional Fund/equality fund, and the source of financing that comes from SILPA. Referring to the said matters, that is why such the local governments are being demanded to be able to discover its economic potentials by increasing the contribution of its Regional Original Income (PAD) as the biggest regional source of income. Each region has various level of income and the income is fluctuating.
In regard with the development which is conducted in the Province of South Sumatera, it is known that the city of Palembang has its relatively high rate of the economic growth. In 2015, Palembang city is being placed at the highest rank with the growth rate up to 8.14 %, and Palembang is the only one that has growth more than 8 %. In 2015, the economic growth of the regencies/cities in the Province of South Sumatera shows significant differences between Palembang City compare to another regencies/cities. The second highest rate of economic growth is approximately 6 %, that reached by the Regency of OKU Timur (6.82 %), and the 3rd place is by the Regency of Ogan Ilir (6.68 %). There are 5 regencies and 1 city reached the rate of approximately 6 % of the economic growth, while there are 2 cities and 4 regencies at the rate of approximately 5 %, and there are 4 regencies reached the rate of approximately 4 % of the economic growth. The Regency of Musi Banyu Asin has the lowest economic growth among the other Regencies or Cities with the growth rate of 4.21 %. The Regency of PALI is the second lowest with the growth of 4.23 %, and the Regency of Musi Rawas Utara as the third lowest with the growth of 4.94 % (BPS 2015).
The existence of the imbalances that shown at the economic growth of Palembang City compare to another Regencies/Cities, is caused by the differences of its natural sources, by the differences in demographical conditions, by the unsmooth of goods and services mobility, by the difference of the concentration of the regional economic activities, and by the difference of the allocation of the development budget in each region (Sjafrizal, 2008). The difference of the development budget allocation in each region is caused by the ability and the source of fund/budget of each regions/cities are difference one to another. The ability of the region to fulfil its need and its expenses is very much determined by the financial performance of the regions.
means that such the region has the ability and the authority to discover its financial sources, to manage and to utilize its own financial to finance the implementation of its
government’s administration. (2) The dependency to the assistance of the central
government has to become minimum and Regional Real Income (PAD) has to become the biggest source of income that supported by the proportional fund policy between central government and regional government. In other words, the success of the development of the regional autonomy could be seen from the level of the regional fiscal autonomy – such as the increasing ratio between the regional real income (PAD) and the total regional income (APBD).
Referring to the above mentioned explanation, we will study more deeply about the financial performance of the region, against the economic growth of regencies/cities in the Province of South Sumatera.
Set Of Problems.
The problem to be studied is how the influence of the financial performance of the economic growth of the regencies / cities in South Sumatera Province?.
LITERATURE REVIEW
1. The Region’s Financial Performance.
Performance is an achievement of what has been planned by the individuals or by the organization. If such the achievement is in accordance with what has been planned, it is means that the performance is implemented well. If the achievement is more than what has been planned, the performance is implemented very well or very good. If the achievement is less than what has been planned, the performance is bad. Financial performance is a measurement of a performance using financial indicators.
The use of the ratio analysis on the public sector, particularly against the government budget is rare, so theoretically there is no firmed consensus yet concerning the name and the norm of the measurement. By the way, in term of managing the financial of the region which is transparent, honest, democratic, effective, efficient, accountable, the ratio analysis against the
regional government’s budget has to be conducted even though the norm of
accountancy in the regional state budget is different from the budget of a private company (Halim 2008).
In the region financial performance analysis, there are some ratio being used such as :
a. Ratio of Fiscal Decentralization b. Ratio of the Financial Autonomy c. Ratio of the Effectiveness
d. Ratio of Efficiency
2. The Economic Growth
The economic growth could be defined as the increase of Gross Domestic Product (GDP) or Gross National Product (GNP) without paying attention to the matters wether the increase is bigger or smaller than the rate of the population growth, or wether there is a change in the economic structure or not.
The economic growth is also means the progress of activities in the economy that caused the increase of the production of goods and services and
the increase of people’s prosperity (Sukirno 2006). According to Budiono (1999), economic growth is a process of the increase of the per-capita output in the long run. The average per-capita expenses is a cost that payed to be consumed by the family member monthly, the costs that come from the purchase, the gift, or from their own production, divided by the total number of the family member. House Holds Consumption.
According to Todaro (2000), there are three main factors or components in the economic growth such as :
a. Capital accumulation including all kind and types of investment which is invested on land, physical tools, capital or human resources.
b. Population growth that will bring the increase number of man power
c. The advance of technology is the most important source of the economic growth.
The matter of the economic growth could be regarded as the matter of Macro Economic in the long run which can be measured based on the ability of a country in producing goods and services from one to another period of time. According to the classical theory led by Adam Smith, David Ricardo, Malthus, and John Stuart Mill, the economic growth is influenced by four (4) factors such as : number of population, number of the stock of the capital goods, the size of the land, and the level of technology that is owned (Sukirno 2007).
Hypothesis
Based on the above conceptual framework, the searchers made hypothesis such as follows :
Ha1: fiscal decentralization regencies / cities in the province of South Sumatra partially positive
and significant impact on economic growth
Ha2: financial autonomus regencies / cities in the province of South Sumatra partially positive
and significant impact on economic growth
Ha3: The effectiveness regencies / cities in South Sumatra partially positive and significant
impact on economic growth
Ha4: Financial efficiency of regencies / cities in South Sumatra partially positive and significant
impact on economic growth
Ha5: fiscal decentralization, finsncisl autonomy, effectiveness and efficiency of the regencies / cities in South Sumatra simultaneously positive and significant impact on economic growth
RESEARCH METHODOLOGY
Scope of Research
The research on the analysis of the financial performances of the regencies/cities in the Province of South Sumatera is using the quantitative research method. The data that being used are data from the financial report of the regional governments and the regional government budget (APBD) of each regency/cities in the Province of South Sumatera in 2006 – 2015. This research is using the double Linier regression analysis model that covers 16 regencies/cities in the Province of the South Sumatera in 10 years period of time from 2006 to 2015.
Source of Data
Data Analysis Technique
This research is using quantitative analysis technique. This research technique is using the ratio to see the level of fiscal decentralization, the autonomy, the effectiveness, the regional financial efficiency and the economic growth.
In analysing the influence of the financial performance to the economic growth the researcher use the examiner tool such as statistic descriptive analysis, regression analysis, and examining the hypothesis. The multiple linear regression analysis and the simple linear regression analysis, the model of data panel in measuring wether dependent variable is really decided by the independent variable is by the Least Squares Methods (LS). The equation model used in this research is :
InEGit=
Explanation:
EG = Economic Growth
= Coefficient
DFit = Fiscal Decentralization in I region at the year of t
KKDit = The Region autonomous financial in the region I at the year of t
EFKKDit = Region Financial Effectiveness in the region of I at the year of t
EFIKDit = Region financial efficiency in the region of I at the year of t €tit = Error Term
DISCUSSION
According to Halim (2004), the comparison between components in the budget is measured by using some ratio which is being developed based on the financial data that come from the regional government budget (APBD) such as : autonomous ratio, effectiveness ratio, ratio of efficiency, growth ratio, and the ratio of harmony. On the other hand Mahmudi (2007) measuring the financial performance by using : the regional autonomous ratio, regional dependency ratio, the level of decentralisation, the regional real income effectiveness and efficiency ratio, the level of contribution of the regional state owned company, and regional government debt and income ratio. This research will see the regional financial performance by seeing : fiscal decentralisation, the autonomous ratio, the effectiveness ratio and the ratio of efficiency.
Fiscal decentralisation is the ability of a region in observing the decentralisation. This ratio shows the level of the contribution of the region real income (PAD) to the total region Income. The higher the contribution, the higher the ability of the regional government in observing the decentralisation.
Prabumulih, Pagaralam, Lubuk Linggau, Banyuasin, Musi Banyuasin, Muara Enim, Musi Rawas, Empat Lawang, Lahat, Ogan Ilir, OKI, OKU, OKUT, dan OKUS. At the same time, the ratio of Fiscal Decentralisation of the city of Palembang is categorised Minus with the average ratio of 17.59 %. In general calculation, the ratio of Fiscal Decentralisation in the Province of South Sumatera shows the category of Minus and Less than Minus or Very Much Minus. It is means that the regencies/cities are not able to finance the implementation of decentralisation with their own capability. It is still needed more dominant role of the Central Government rather than the regional government autonomous.
Regencies/cities with the criteria very low in term of the autonomous ratio
(below 25 %) during 2006-2015 are : Prabumulih, Pagaralam, Lubuk Linggau, Banyuasin, Musi Banyuasin, Muara Enim, Musi Rawas, Empat Lawang, Lahat, Ogan Ilir, OKI, OKU, OKUT, dan OKUS. Such the condition is reflecting the pattern of autonomy which is still instructive. The pattern of the instructive relation means the role of the central government is more dominant than the autonomous of the region or local government. Such the pattern, causing the regional/local government financially very much depends on the central government. This dependency is become stronger because of the transfer income that coming from the central government transfer/equalization fund, tax revenue sharing, nontax revenue sharing (natural resources), the general allocation fund, the special allocation fund, the other central government transfer, special autonomy fund, adjustment fund, government transfer.
The ratio of the effectiveness shows the ability of the regional governments in realizing the regional real income (PAD) which is planned with the target decided based on the regional potential. It can be saying that the bigger ratio of the effectiveness, the better performance of the regional government.
During 10 years period of time (2006-2015), region with the biggest ratio of effectiveness is the Regency of OKUS with the score 209.9% means very effective. Out of OKUS regencies/cities that categorized very effective are: Palembang, Prabumulih, Pagaralam, Lubuk Linggau, Banyuasin, Musi Banyuasin, Muara Enim, Musi Rawas, Empat Lawang, Lahat, OKI, OKU. It can be said that Palembang could make its regional real income (PAD) effective.
Results of Multiple Linear Regression Analysis
Processing data using multiple linear regression to determine the effect of independent variables on the dependent variable. The following results table regression analysis.
Table 1. The results of multiple linear regression
Variable Coefficient Std. Error t-Statistic Prob.
C -0.260984 1.063368 -0.245432 0.8065
DF? 62.73185 15.12778 4.146799 0.0001
KKD? -16.04656 6.712601 -2.390513 0.0183
EFEKKD? -0.074855 0.134993 -0.554508 0.5802
EFIKD? -0.254122 0.768409 -0.330712 0.7414
Source: data processing, 2016
Information :
DF : Ratio of Fiscal Decentralization
KKD : Ratio of Regional Financial Independence
EFEKKD : Ratio of effectiveness
EFIKD : Ratio of effesiensi
Based on the results of the regression analysis on the above table, the obtained equation regression model as follows:
EG = -0.260984 + 62.73185
The constant value is - 0.260984, this value indicates that if there is no independent variable, (fiscal decentralization , financial autonomy, effectiveness, efficiency) then the economic growth is - 0.260984.
The regression coefficient β1 show that when the ratio of DF increased 1%, economic growth would increase by 62.73185 assuming other variables held constant.
The regression coefficient β2 show that when the ratio of KKD increased 1%,
economic growth will be decreased by -16.04656 assuming other variables held
constant. The regression coefficient β3 show that when the ratio of EFEKKD
increased 1%, economic growth decreased by -0.074855, assuming other variables
held constant. The regression coefficient β4 shows that when the value EFIKD ratio rose 1%, the decline in economic growth -0.254122, assuming other variables constant.
Determinant Coefficient (R2 )
The result of the test using fixed effect model, it is found that the influence of fiscal decentralization, the region financial autonomous, the effectiveness and the efficiency on the economic growth at the regencies/cities in the Province of South Sumatera has the score of 0.341114. This means that the independence variable available in the model could explain the bounded variable (dependent) until 34.11 %, and the rest 65.89 % will be explained by other variables outside the model.
F Test
According to the F test, the result of the regression “fixed effect model”
founding the score of F-statistic 5.256744. At the level of conviction a = 5% with the df1 = k – 1 (4) and df2 = n – k (144), until F-table of 2.434503 is obtained. F statistic > F-table, it can be concluded that Ha is accepted and Ho is un-accepted. It is means
that the independence variable (fiscal decentralization, the region’s financial
autonomous, effectiveness, and efficiency) collectively have significant influence to their dependent variables (the economic growth).
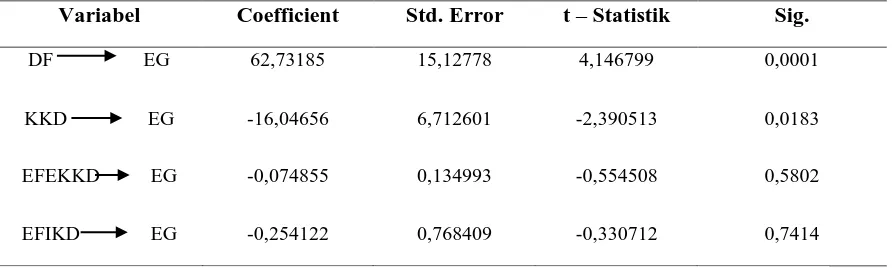
T test (partial test)
This test was conducted to test whether the independent variable partial effect on the dependent variable, ie by comparing the respective value of t-statistic of regression with t-table in determining the hypothesis is accepted or un- accepted. At a confidence level α = 5% df = n-k (144), the obtained t-table is 1.976575. As shown in Table 4.1.
Table 2. Result – t test
Variabel Coefficient Std. Error t – Statistik Sig.
DF EG 62,73185 15,12778 4,146799 0,0001
KKD EG -16,04656 6,712601 -2,390513 0,0183
EFEKKD EG -0,074855 0,134993 -0,554508 0,5802
EFIKD EG -0,254122 0,768409 -0,330712 0,7414
Source: data processing, 2016
.At the variable of Fiscal Decentralisation, has coefficient regression for DF such as 62.73185. It shows that fiscal decentralisation has the positive and significant influence to the economic growth. T statistic is bigger than t-table, it can be concluded that Ha is acceptable and Ho is un-acceptable. Fiscal decentralisation is comparing the Regional Real Income (PAD) to total revenue of the region. The size
of PAD is really influencing the region’s economic growth. Such the condition is in
line with what Azizi (2013) said in his research. The PAD is very important for the development of a region, so the higher PAD, is the better the growth of the region.
could be concluded that the region’s financial autonomous has negative influence but
it is very significant to the economic growth. The financial autonomous is so much needed for the better growth and development of a region. But the readiness of each region is deferent. According to the research observed by Effendi (2011), it is found that the region’s financial autonomous is still relatively small, and it is found that very
difficult to increase the region’s financial autonomous. Such the research which is conducted in Nganjuk stated that the region’s financial autonomous seems still very
low and it is less of fiscal decentralisation. These means that the regional government is still very much depends on the Central Government. The research made by Gomes (2013) stated that there are some obstacles that makes the region’s financial autonomous is difficult to be implemented such as the difficulty in increasing the tax revenue, the difficulty in decreasing the expenses, the dependency from the central government, including in expecting financial sources from the other
party’s concerned and from the outside region.
From the point of view of the Region’s Financial Effectiveness it has coefficient regression for EFEKKD such as -0.074855. EFEKKD have a t-statistic <t-table. Moreover, the probability value of 0.5802 EFEKKD> value significance level of 0.05, which means that Ho is accepted. It could be said that the effectiveness has negative influence and not significant to the economic growth.
The region’s Financial Efficiency has coefficient regression for EFIKD such as -0.254122, have a t-statistic <t-table. Moreover, the probability value of 0.7414 EFIKD> value significance level of 0.05, which means that Ho is accepted. It is means that efficiency has negative influence and not significant to the economic growth.
But according to the simultaneously calculation during 2006 – 2015, it is seems that fiscal decentralisation, region’s financial autonomous, effectiveness, and efficiency have positive and significant influence to the economic growth:
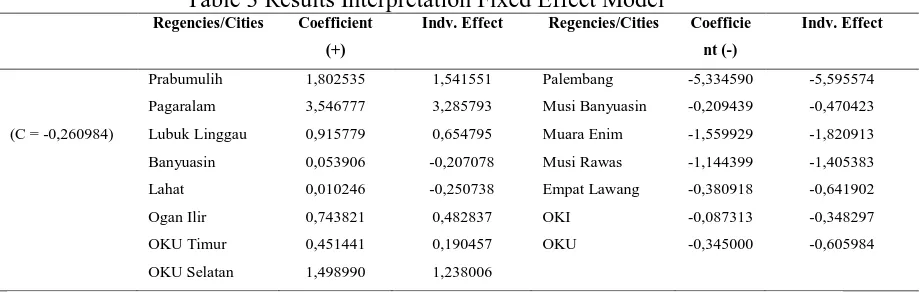
Interpretation Fixed Effect Model
Based on test results using a fixed effect model, visible interpretation of the district / city in South Sumatra province is as follows:
Table 3 Results Interpretation Fixed Effect Model
Prabumulih 1,802535 1,541551 Palembang -5,334590 -5,595574 Pagaralam 3,546777 3,285793 Musi Banyuasin -0,209439 -0,470423 (C = -0,260984) Lubuk Linggau 0,915779 0,654795 Muara Enim -1,559929 -1,820913 Banyuasin 0,053906 -0,207078 Musi Rawas -1,144399 -1,405383 Lahat 0,010246 -0,250738 Empat Lawang -0,380918 -0,641902 Ogan Ilir 0,743821 0,482837 OKI -0,087313 -0,348297 OKU Timur 0,451441 0,190457 OKU -0,345000 -0,605984 OKU Selatan 1,498990 1,238006
Based on Table3, above shows that the regencies/ city in South Sumatra province have individual influence different to any change in the ratio of fiscal decentralization, financial autonomus, effectiveness of local finance, local finance efficiency and economic growth. Regencies / cities that have a positive influence coefficient means an increase that is Prabumulih, Pagaralam, Lubuk Linggau, Banyuasin, Lahat, Ogan Ilir, East OKU and OKU Selatan. While that has a negative coefficient namely Palembang, Musi Banyuasin, Muara Enim, Musi Rawas, Empat Lawang, OKI, and OKU. The three biggest that has a positive coefficient that is Pagaralam, Prabumulih, and South OKU amounted to 3.546777, 1.802535, and 1.49899. In addition, the 3 regencies/ cities have also had the greatest individual influence with each of 3.285793, 1.541551 and 1.238006. While the three largest have a negative coefficient of the OKI, Banyuasin, and OKU of 0.087313, -0.209439 and -0.345000 by having individual influence of -0.348297, -0.470423, and -0, 605 984. Regencies / cities that have the smallest positive coefficient of .010246 Lahat with -0.250738 and influence of individuals who have the smallest negative coefficient of Palembang -5.595574 -5.334590 with individual influences. When viewed as a whole the increase in the ratio of fiscal decentralization, financial autonomy, effectiveness, and efficiency of economic growth during the period 2006-2015 occurred in the City Pagaralam largest and the lowest occurred in Palembang.
CONCLUSION
The conclusion said that obtained from the previous discussion stated that
region’s financial performance for the regencies/cities in the Province of South
Sumatera have differences of ratios. Region’s Financial Performance could be seen from the ratio of fiscal decentralisation, the autonomous ratio, ratio of the effectiveness and the ratio of efficiency. From the point of view of fiscal decentralisation, it could be concluded that in total, the average fiscal decentralisation of regencies/cities in the Province of South Sumatera is categorized Low, means under or smaller than 10 %. The regencies/cities are : Pagaralam, Lubuk Linggau, Banyuasin, Musi Banyuasin, Muara Enim, Musi Rawas, Empat Lawang, Lahat, Ogan Ilir, OKI, OKU, OKUT dan OKUS. The ratio of Fiscal Decentralisation of Palembang city is categorized Less with the average ratio of 17,59 %.
From the region’s autonomous ratio point of view, most of the regencies/cities are categorized very Low which is under 25 %. It covers the regencies/cities of Prabumulih, Pagaralam, Lubuk Linggau, Banyuasin, Musi Banyuasin, Muara Enim, Musi Rawas, Empat Lawang, Lahat, Ogan Ilir, OKI, OKU, OKUT, dan OKUS. This condition is interpreting the autonomous pattern which is still instructive. Pattern of Instructive relationship means where the role of the central government more dominant than the region government autonomous. Such the Instructive Pattern is
causing the region’s government dependency (from the financial side) to the central government is still very high.
If it is seen from the ratio of the region’s effectiveness, regency/city that have
Musi banyuasin, Muara Enim, Musi Rawas, Empat Lawang, Lahat, OKI, OKU, and OKUS.
In the last 10 years time, regencies/cities in the Province of South Sumatera reach the ratio such as 80% - 90%. Efficient category belongs to Palembang, Prabumulih, Pagaralam, Lubuk Linggau, Musi Banyuasin, Empat Lawang, Lahat, OKUT, and OKUS. Category of the ratio of Efficient Enough belongs to Banyuasin, Muara Enim, Musi Rawas, Ogan Ilir, OKI, and OKU.
The regencies/cities in the Province of South Sumatera which have the influence of the positive coefficient (meaning that experiencing the improvement) are Prabumulih, Pagaralam, Lubuk Linggau, banyuasin, lahat, Ogan Ilir, OKUT, dan OKUS. While those who have negative coefficient are Palembang, Musi Banyuasin, Musara Enim, Musi Rawas, Empat Lawang, OKI, dan OKU. The biggest three regencies/cities that have positive coefficient are Pagaralam (3.546777), Prabumulih (1.802535), and OKUS (1.49899). Other than that, These 3 regencies/cities are also have the biggest score of individual influence such as Pagaralam (3.285793), Prabumulih (1.541551), and OKUS (1.238006). The other three biggest regencies/cities which have negative coefficient are OKI (-0.087313), MusiBanyuasin (-0.209439), and Musi Banyuasin (0.345000). They are having the score of the individual influence such as OKI (-0.348297), Musi Banyuasin (-0.470423), and OKU (-0.605984). Regency/city that has smallest positive coefficient is Lahat (0.010246) with the individual influence of -0.250738. Regency/city that has the smallest negative coefficient is Palembang (-5.334590) with individual influence -5.595574. In general it could be said that fiscal decentralisation, financial autonomous, effectiveness, and efficiency have positive and significant influence to the economic growth. From the result of the statistical test, it is proofed that the region financial
performance will support the particular region’s economic growth.
RECOMENDATIONS
1. Optimizing the Region’s Original Revenue (PAD) particularly the source of revenue which has prime potential by giving fund assistance, plays the active roles in giving a lead and shooting problems and watching the improvement.
2. For the continuator of the research can conducts the more details research or can adds the other variable.
3. Increasing the development of the main sectors which is used to increase the
economic growth and the growth the region’s physical such as building roads,
BIBLIOGRAPHY
Ardhini. 2011. Influence of the Regional Financial Ratios Capital Expenditure for Public Service in Agency Theory Perspective. UNDIP
Central Bureau of Statistics. (2012). Palembang In Figures. South Sumatra Province
………(2014). Gross Regional Domestic Product of South
Sumatra Province By Regency / City Year 2010-2013. Palembang:
………(2014). Sumsel In Figures. South Sumatra Province
Directorate General of Fiscal Balance, Ministry of Finance of the Republic of Indonesia. (2013). Regional Capital Expenditure Evaluation Report. DJPK MOF: Jakarta.
Efendi, (2011), development of local financial capacity to underpin the implementation of regional autonomy in Nganjuk, Proceedings of the Seminar nasioanl, Muhammadiyah University, Semarang
Ginting, Ari Mulianta and Rasbin, (2010). Effect of Economic Growth Against Poverty Rate In Indonesia Before And After the Crisis, Journal of Economics and Public Policy Vol.2
Gomes Ricardo Correa, (2013), the local government Analyzing financial performance: evidence from Brazilian municipalities from 2005 to 2008, Rev. adm. contemp. vol.17 no.6 Nov./Dec Curitiba. 2013
Halim, Abdul. (2004). Public Sector Accounting: Financial Accounting Regions. Salemba Four: Jakarta.
Halim, Abdul. (2012). Regional Financial Accounting. Jakarta. Salemba Issue Four
………(2011). Financial Management. Third Edition. UPP AMP YKPN
Hendriwiyanto, Guntur. (2013). Effect Against Local Revenue Growth with Variable Capital Expenditure as mediation. Journal of Economics and Business University of Brawijaya, Malang.
Law No. 32 of 2004 on Regional Government.
Law No. 33 of 2004 on Financial Balance between the Central Government and Local Government
Mangkoesoebroto, Guritno, (2010). Public Economics. Third Edition. BPFE Yogyakarta.
... (2009). Local Revenue Management, Balanced Fund and Loan Fund Based on Law No. 25 of 1999. In the Anthology of Regional Financial Management. First Edition. Publishers and Printing Unit (UPP) AMP YKPN. Yogyakarta
... (2004). Autonomy and Local Financial Management, Publisher Andi, Yogyakarta.
... (1999). Financial Management Oriented On Public Interest. PAU Economic Studies UGM, Yogyakarta.
Maryamah, Edy Susanto, (2016). Effect of revenue (PAD), General Allocation Fund (DAU), Special Allocation Fund (DAK) on economic growth as a regional shopping area with moderating variable (the empirical studies in 29 counties and 9 cities in East Java ), Semarang Stie Journal, Vol. 8, edition 2
Mawarni, (2013), Effect of local revenue and general allocation of funds to capital expenditures and their impact on economic growth, (in districts and cities in Aceh) Journal of Accounting, Volume 2, 2 Graduate University of Syiah Kuala
Muktiali, Mohammad, (2000). Degree of Regional Fiscal Autonomy in Indonesia: A Case Study on 26 Dati II Become a Pilot Regional Autonomy, Thesis, S2, Graduate School of Gadjah Mada University, Yogyakarta
Najiah, Laeni. (2013). Effect Analysis PAD, DBH and Labor Force Participation Rate to the GDP in Depok period 2001-2010. Essay. State Islamic University Syarif Hidayatullah, Jakarta. (Publication)
Nachrowi, Djalal Nachrowi, and Hardius Usman.(2006) Popular and Practical Approaches. Econometrics for Economic and Financial Analysis. Issuing Faculty of Economics, University of Indonesia: Jakarta.
Nanga, Munga, (1991). Financial Autonomous Regional Level II, A Case Study in Malang, Probolinggo, and Psychology (East Java Province) ", Thesis, S2, Graduate School of Gadjah Mada University, Yogyakarta
Hamzah.( 2007). Effect Analysis PAD, DAU, DAK and Development Expenditure on Economic Growth, Poverty and Unemployment: Approach Path Analysis. Journal of Accounting and Finance Indonesia Vol. 4 No. 2 December.
Sjafrizal. (2008). Regional Economic Theory and Applications. Baduose Media: West Sumatra.
Sukirno, Sadono. (2006). Economic Development. The second edition. Kencana Prenada Media Group: Indonesia.
Sularso, Hafiz, (2011). Effect of Financial Performance Against Capital Expenditure Allocation And Economic Growth Regency / Municipality in Central Java. media Research Accounting, Thesis, Faculty of Economics, University General Sudirman.
Suparmoko (2002). Public Economics: for Finance and Regional Development, Publisher Andi Yogyakarta
Todaro, Michael P. (2000). Economic Development in the Third World Translation Haris Munandar Seventh Edition. Publisher: Jakarta.