DAFTAR PUSTAKA
1. Tjoke Gede Kerthyasa, Indri Yuliani. Gaya Hidup selaras dengan alam. Bandung:Qanita; 2013.
2. Kementrian Kesehatan Republik Indonesia. Integrasi Pengobatan
Tradisional Dalam Sistem Kesehatan Nasional; 2011. Dari https://Depkes.go.id. Diakses tahun 2016
3. Yuniarti, T. Ensiklopedia Tanaman Obat Tradisional. Yogyakarta: Media Pressindo;2003.
4. Menteri Kesehatan Republik Indonesia. Peraturan Menter Kesehatan Nomor: 149/ SK/ Menkes/ IV/ 1978 tentang Tanaman Obat
Tradisional. Jakarta; 1978.
5. Saifuddin A, Rahayu, Yuda Hilwan. Standarisasi Bahan Obat Alam. Yogyakarta: Graha alam; 2011: 1-22. 4
6. Wilmana, P.F., dan Gan, S. Farmakologi dan Terapi. Jakarta: Balai Penerbit: FKUI; 2009: 240.
7. Hidayati, Nurul. Pengaruh Variasi Kadar Karbopol Terhadap Sifat Fisik dan Stablitas Fisik Gel Ekstrak Etanolik Terhadap Kulit Pisang. Yogyakarta: Universitas Gajah Mada; 2014.
9. Akhil TT dan Prabhu P. Evaluation of Anti-oxidant, Anti-inflammatory and toxicity Potenbtial of Hemigraphis colorata. International Journal of Pharmaceutical Sciences and Research;2013:Vol 4(9): 3477-3483
10. Hammer et al.2008. Antimicrobial and Anti-inflammatory Activity of Five Taxandria fragnans Oils in vitro. Microbial Immunol; 2008: 52:522-530
11. Chippada SC and Vangalapati. Antioxidant, Anti-inflammatory and Anti arthritic of Centella asiatica extracts. J.Chen.Bio.Phy.Sci; 2011: Vol.1, No.2, Sec. B, 260-26.
12.Mycek M, Harvey, dan Champe. Farmakologi Ulasan Bergambar Edisi 2.Jakarta: Widia Medika; 2001.
13.Srdan Stankov. Definition of Inflammation, Causes of Inflammation and Possible Anti-inflammatory Strategies. The Open Journal; 2012:5:1-9
14.Chippada SC, Volluri SS, Bammidi SR and Vangalapati M. In Vitro Anti Inflammatory Activity of Methanolic Extract of Centella
asiatica by HRBC Membrane Stabilisation. Rasayan J.Chem; 2011: Vol.4, No.2, 457-460.
15.Kumar V, Cotran RS, Robbins SL. Buku ajar patologi. 7 nd ed , Vol. 1. Jakarta: Buku Kedokteran EGC; 2007: 189-1.
17.Robbins, S.L., Kumar, V., dan Cotran, R.S. Buku Ajar Patologi.
Jakarta: Penerbit Buku Kedokteran EGC; 2007: 7(1): 35-37, 50-53. 18. Katzung BG. Basic & Clinical Pharmacology. 10th ed. New York:
McGraw-Hill Companies; 2006.
19.Wibowo S, Gofir A. Farmakoterapi dalam neurologi. Edisi 1. Jakarta: Salemba Medika.
20.Bertram G. Katzung, MD, P. Basic & clinical pharmacology (Twelfth Ed.). Mc Graw Hill; 2012.
21.Sastroamidjojo, S. Obat Asli Indonesia. Jakarta: Dian Rakyat; 1997:83 22.Hapsoh dan Y. Hasanah. Budidaya tanaman obat dan rempah. Medan:
USU Press; 2011.
23.Ishita C, Kaushik B. Turmeric and curcumin: biological actions and Medical applications (Review). Current Science; 2004: 87:44–50. 24.Setiawan AS, Yulinah E, Adnyana IK, Permana H, Sudjana P. Efek
Antidiabetes Kombinasi Ekstrak Bawang Putih (Allium sativum
Linn.) dan Rimpang Kunyit (Curcumma domestica Val.) dengan
Pembanding Glibenklamid pada Penderita Diabetes Melitus Tipe
2. MKB; 2011: 43(1):26–34.
25.Chainani-Wu N. Safety and anti-inflammatory activity of curcumin: a component of tumeric (Curcuma longa). J Altern Complement Med; 2003: 9: 161–168.
27.Hsu, W. Y., Simonne, A., Weissman, A and Jeong-Mok Kim 2010,
Antimicrobial Activity of Greater Galangal [Alpinia galanga
(Linn.) Swartz.] Flowers. Food Science Biotechnol; 2010: 19(4): 873-880.
28.Pamungkas, R. N., Julaichah, D., Prasasti, S. D., & Muslih, M.
Pemanfaatan Lengkuas (Lenguas galanga L.) Sebagai Bahan
Pengawet Pengganti Formalin. Malang: Program Kreativitas Mahasiswa Universitas Negeri Malang; 2010.
29.Malang. Dalimartha, S. Atlas Tumbuhan Obat Indonesia Jilid 6. Cetakan I. Jakarta: Pustaka Bunda; 2009: 89-94.
30.Gembong, T. Taksonomi Tumbuhan. Cetakan ketujuh. Yogyakarta: Gadjah Mada University Press; 2005: 192.
31. Hapsoh, Hasanah, Y., dan Julianti, E. Budidaya dan Teknologi
Pascapanen Jahe. Medan: USU press; 2010: 1-5, 14-18, 27,57-59. 32.Rukmana, R. Usaha Tani Jahe. Kanisius. Yogyakarta;2000.
33.Lukito. Petunjuk Praktis Bertanam jahe. Agromedia Pustaka. Jakarta;2007.
34.Tjitrosoepomo, G. Taksonomi Tumbuhan Obat-obatan. Jogyakarta: Penerbit Gadjah Mada University Press; 2005: 447.
37. Syukur, C. dan Hernani. Budidaya Tanaman Obat Komersial. Jakarta: Penerbit Penebar Swadaya; 2001: 43-48.
38.C.Januwati M, Yuhono JT. Budidaya cabe jawa (Piper retrofractum Vahl).Balitro: Bogor; 2003: 7:1-3.
39.Soleh, M., M.C. Mahfud, S. Roesmarkam, Z. Arifin, R.D. Wijadi, Ismail- Wahab,A. Suryadi, D. Rahmawati, dan N. Pangarsa. Pengkajian rakitan teknologi sistem usaha tani cabe jamu. BPTP Karangploso TA; 1999: 342- 352.
40.Vinay, S., K. Renuka, V. Palak, C.R. Harisha, and Prajapati.
Pharmacognostical and phytochemical study of Piper Longum L.
and Piper retrofractum Vahl. Journal of Pharmaceutical and Scientific Innovation; 2012: 62-66.
41.Jamal, Y., P. Irawati, A. Fathoni, A. Agusta. Chemical constituents and antibacterial effect of essential oil of javaness pepper leaves (Piper
retrofractum Vahl.). Media Litbangkes; 2013. 23(2): 65-72. 42.Evizal, R. Tanaman Rempah dan Fitofarmaka. Fakultas Pertanian Unila.
Bandar Lampung 2013.
43.Kim, K.J., M.S. Lee, K. Jo, J.K. Hwang. Piperidine alkaloids from
Piper retrofractum Vahl. protect against high-fat diet-induced
obesity by regulating lipid metabolism and activating
44.Chaveerach, A., P. Mokkamul, R. Sudmoon, and T. Tanee. Ethnobotany of the genus Piper (Piperaceae) in Thailand. Ethnobotany Re-search & Applications; 2006: 4:223-231.
45.Ruhnayat, A., R.S. Muljati dan W. Haryudin. Respon tanaman cabe
jawa produktif terhadap pemupukan di Sumenep Madura. Bul. Littro; 2011: 22(2): 136-146.
46.Rusdi Evizal. Status Fito Status Fitofarmaka Dan Perkembangan Agroteknologi Cabe Jawa (Piper Retrofractum Vahl.). Jurnal Agrotropika;2013: 18(1): 34-40,
47.Ditjen POM. Paramater Standar Umum Ekstrak Tumbuhan Obat.
Jakarta: Departemen Kesehatan Republik Indonesia; 2000: 15-18. 48. Ditjen POM. Farmakope Indonesia Edisi III. Jakarta: Departemen
Kesehatan Republik Indonesia; 1979: 33;899.
49.British Pharmacopoeia. British Pharmacopoeia. Medicines and Healthcare Products Regulatory Agency (MHRA); 2009: 6488
50.Kohli K, Ali J, Ansari MJ, Raheman Z. Curcumin : a natural
antiinflammatory agent. Indian J Pharmachol; 2005: Vol 37 (3):141-147.
51.Mycek, M.J., Richard A.H., Pamela C.C. Farmakologi Ulasan
52.Juheini. (1990). Efek Antiinflamasi Jahe (Zingiber officinale Rose
Terhadap Udem Buatan pada Tikus Putih. Majalah Farmakologi dan Terapi Indonesia. 7: 9-14.
53.Erlina Rustam dkk (2007). Efek Antiinflmasi Ekstrak Etanol
Kunyit (Curcuma domestica val) Pada Tikus Putih Jantan Wistar.
LAMPIRAN
LAMPIRAN 3. HASIL PENELITIAN
Explore
Kelompok
Case Summaries
5 5 5
48.00 161.80 169.60
5.701 12.716 9.397
50.00 167.00 170.00
40 145 155
55 175 180
5 5 5
66.40 124.00 126.20
12.341 11.402 24.232
65.00 120.00 120.00
52 110 105
85 140 166
5 5 5
65.00 129.20 151.00
14.142 15.959 26.315
70.00 120.00 160.00
50 117 105
80 152 170
5 5 5
66.80 119.00 130.40
4.919 16.733 8.414
65.00 115.00 127.00
62 105 125
75 145 145
20 20 20
61.55 133.50 144.30
12.288 21.649 24.904
63.50 127.50 150.00
40 105 105
85 175 180
N Mean
Std. Deviation Median Minimum Maximum N
Mean
Std. Deviation Median Minimum Maximum N
Mean
Std. Deviation Median Minimum Maximum N
Mean
Std. Deviation Median Minimum Maximum N
Mean
Awal
Tests of Normality
.961 5 .814
.973 5 .894
.843 5 .174
.860 5 .228
.912 5 .478
.961 5 .814
.815 5 .107
.881 5 .314
.949 5 .728
.876 5 .293
.751 5 .031
.742 5 .025
Kelompok P1 P2 P3 P4 P1 P2 P3 P4 P1 P2 P3 P4 Awal
Jam 1
Jam 2
Statistic df Sig.
Shapiro-Wilk
Jam 1
Jam 2
Test of Homogeneity of Variances
3.506 3 16 .040
.570 3 16 .643
1.715 3 16 .204
Awal Jam 1 Jam 2
Levene
NPar Tests
Kruskal-Wallis Test
Ranks
5 4.00
5 12.70
5 12.20
5 13.10
20 Kelompok
P1 P2 P3 P4 Total Awal
N Mean Rank
Test Statisticsa,b
8.204 3 .042 Chi-Square
df
Asymp. Sig.
Awal
Kruskal Wallis Test a.
Oneway
Post Hoc Tests
ANOVA Jam 1
5599.400 3 1866.467 9.034 .001
3305.600 16 206.600
8905.000 19
Between Groups Within Groups Total
Sum of
Squares df Mean Square F Sig.
Multiple Comparisons Dependent Variable: Jam 1
Bonferroni
37.800* 9.091 .004 10.45 65.15
32.600* 9.091 .015 5.25 59.95
42.800* 9.091 .001 15.45 70.15
-37.800* 9.091 .004 -65.15 -10.45
-5.200 9.091 1.000 -32.55 22.15
5.000 9.091 1.000 -22.35 32.35
-32.600* 9.091 .015 -59.95 -5.25
5.200 9.091 1.000 -22.15 32.55
10.200 9.091 1.000 -17.15 37.55
-42.800* 9.091 .001 -70.15 -15.45
-5.000 9.091 1.000 -32.35 22.35
-10.200 9.091 1.000 -37.55 17.15
(J) Kelompok P2 (I) Kelompok P1
(I-J) Std. Error Sig. Lower Bound Upper Bound 95% Confidence Interval
NPar Tests
Kruskal-Wallis Test
Ranks
5 16.80
5 6.40
5 11.50
5 7.30
20 Kelompok
P1 P2 P3 P4 Total Jam 2
N Mean Rank
Test Statisticsa,b
9.714 3 .021 Chi-Square
df
Asymp. Sig.
Jam 2
Kruskal Wallis Test a.
T-Test (P1)
Paired Samples Statistics
48.00 5 5.701 2.550
161.80 5 12.716 5.687
161.80 5 12.716 5.687
169.60 5 9.397 4.202
48.00 5 5.701 2.550
169.60 5 9.397 4.202
Awal
Mean N Std. Deviation
Std. Error Mean
Paired Samples Correlations
5 .855 .065
N Correlation Sig.
Paired Samples Test
-113.800 -7.800 -121.600 8.379 13.627 9.633
3.747 6.094 4.308
-124.203 -24.720 -133.561 -103.397 9.120 -109.639 -30.371 -1.280 -28.226
4 4 4
.000 .270 .000
Mean Std. Deviation Std. Error Mean
Lower Upper 95% Confidence Interval
of the Difference Paired Differences
t df
Sig. (2-tailed)
-T-Test (P2)
Paired Samples Statistics
66.40 5 12.341 5.519
124.00 5 11.402 5.099
124.00 5 11.402 5.099
126.20 5 24.232 10.837
66.40 5 12.341 5.519
126.20 5 24.232 10.837
Awal
Mean N Std. Deviation
Std. Error Mean
Paired Samples Correlations
5 -.227 .713
N Correlation Sig.
Paired Samples Test
-57.600 -2.200 -59.800 18.609 25.479 26.715
8.322 11.395 11.947
-80.706 -33.837 -92.971 -34.494 29.437 -26.629 -6.921 -.193 -5.005
4 4 4
.002 .856 .007
Mean Std. Deviation Std. Error Mean
Lower Upper 95% Confidence Interval
of the Difference Paired Differences
t df
Sig. (2-tailed)
-T-Test (P3)
Paired Samples Statistics
65.00 5 14.142 6.325
129.20 5 15.959 7.137
Awal Jam 1 Pair
1
Mean N Std. Deviation
Std. Error Mean
Paired Samples Correlations
5 -.249 .686
Awal & Jam 1 Pair 1
N Correlation Sig.
Paired Samples Test
-64.200
Std. Deviation Std. Error Mean
Lower Upper 95% Confidence Interval
of the Difference Paired Differences
t df
Sig. (2-tailed)
NPar Tests
Wilcoxon Signed Ranks Test
Ranks Negative Ranks
Positive Ranks Ties
Total
Negative Ranks Positive Ranks Ties
Total Jam 2 - Jam 1
Jam 2 - Awal
N Mean Rank Sum of Ranks
Jam 2 < Jam 1
Test Statisticsb
-1.483a -2.023a
.138 .043
Z
Asymp. Sig. (2-tailed)
Jam 2 - Jam 1 Jam 2 - Awal
Based on negative ranks. a.
T-Test (P4)
Paired Samples Statistics
66.80 5 4.919 2.200
119.00 5 16.733 7.483
Awal Jam 1 Pair
1
Mean N Std. Deviation
Std. Error Mean
Paired Samples Correlations
5 .468 .427
Awal & Jam 1 Pair 1
N Correlation Sig.
Paired Samples Test
-52.200
Std. Deviation Std. Error Mean
Lower Upper 95% Confidence Interval
of the Difference Paired Differences
t df
Sig. (2-tailed)
NPar Tests
Wilcoxon Signed Ranks Test
Ranks Negative Ranks
Positive Ranks Ties
Total
Negative Ranks Positive Ranks Ties
Total Jam 2 - Jam 1
Jam 2 - Awal
N Mean Rank Sum of Ranks
Jam 2 < Jam 1
Test Statisticsb
-1.214a -2.060a
.225 .039
Z
Asymp. Sig. (2-tailed)
Jam 2 - Jam 1 Jam 2 - Awal
Based on negative ranks. a.
Explore
Kelompok
Case Summaries
5 5 5
113.80 7.80 121.60 8.379 13.627 9.633 117.00 5.00 125.00
100 -12 105
120 23 130
5 5 5
57.60 2.20 59.80
18.609 25.479 26.715 65.00 10.00 53.00
25 -30 35
70 36 101
5 5 5
64.20 21.80 86.00 23.816 26.508 30.083 60.00 25.00 95.00
42 -12 35
102 53 110
5 5 5
52.20 11.40 63.60 15.073 21.208 11.059 50.00 10.00 60.00
40 -18 55
78 40 83
20 20 20
71.95 10.80 82.75 29.807 21.729 31.955 66.50 10.00 84.00
25 -30 35
120 53 130
N Mean
Std. Deviation Median Minimum Maximum N
Mean
Std. Deviation Median Minimum Maximum N
Mean
Std. Deviation Median Minimum Maximum N
Mean
Std. Deviation Median Minimum Maximum N
Mean
Std. Deviation Median
Selisih Awal - Jam 1
Selisih Jam 1 - Jam 2
Selisih Awal - Jam 1
Tests of Normality
.825 5 .128
.732 5 .020
.910 5 .466
.799 5 .079
.938 5 .654
.959 5 .800
.967 5 .855
.988 5 .974
.788 5 .064
.915 5 .498
.826 5 .129
.708 5 .012
Kelompok P1 P2 P3 P4 P1 P2 P3 P4 P1 P2 P3 P4 Selisih Awal - Jam 1
Selisih Jam 1 - Jam 2
Selisih Awal - Jam 2
Statistic df Sig.
Shapiro-Wilk
Selisih Jam 1 - Jam 2
Selisih Awal - Jam 2
Test of Homogeneity of Variances
1.015 3 16 .412
.914 3 16 .456
1.917 3 16 .168
Selisih Awal - Jam 1 Selisih Jam 1 - Jam 2 Selisih Awal - Jam 2
Levene
NPar Tests
Kruskal-Wallis Test
NPar Tests
Mann-Whitney Test
Ranks Selisih Awal - Jam 1N Mean Rank
Test Statisticsa,b
10.655 3 .014 Chi-Square
df
Asymp. Sig.
Selisih Awal - Jam 1
Kruskal Wallis Test a.
Grouping Variable: Kelompok b. Selisih Awal - Jam 1
N Mean Rank Sum of Ranks
Test Statisticsb
.000 15.000 -2.619 .009
.008a Mann-Whitney U
Wilcoxon W Z
Asymp. Sig. (2-tailed) Exact Sig. [2*(1-tailed Sig.)]
Selisih Awal - Jam 1
Not corrected for ties. a.
NPar Tests
Mann-Whitney Test
NPar Tests
Mann-Whitney Test
Ranks Selisih Awal - Jam 1
N Mean Rank Sum of Ranks
Test Statisticsb
1.000 16.000 -2.410 .016
.016a Mann-Whitney U
Wilcoxon W Z
Asymp. Sig. (2-tailed) Exact Sig. [2*(1-tailed Sig.)]
Selisih Awal - Jam 1
Not corrected for ties. a.
Grouping Variable: Kelompok b. Selisih Awal - Jam 1
N Mean Rank Sum of Ranks
Test Statisticsb
.000 15.000 -2.627 .009
.008a Mann-Whitney U
Wilcoxon W Z
Asymp. Sig. (2-tailed) Exact Sig. [2*(1-tailed Sig.)]
Selisih Awal - Jam 1
Not corrected for ties. a.
NPar Tests
Mann-Whitney Test
NPar Tests
Mann-Whitney Test
Ranks Selisih Awal - Jam 1
N Mean Rank Sum of Ranks
Test Statisticsb
12.000 27.000 -.105 .916
1.000a Mann-Whitney U
Wilcoxon W Z
Asymp. Sig. (2-tailed) Exact Sig. [2*(1-tailed Sig.)]
Selisih Awal - Jam 1
Not corrected for ties. a.
Grouping Variable: Kelompok b. Selisih Awal - Jam 1
N Mean Rank Sum of Ranks
Test Statisticsb
9.000 24.000 -.733 .463
.548a Mann-Whitney U
Wilcoxon W Z
Asymp. Sig. (2-tailed) Exact Sig. [2*(1-tailed Sig.)]
Selisih Awal - Jam 1
Not corrected for ties. a.
NPar Tests
Mann-Whitney Test
Ranks
5 6.20 31.00
5 4.80 24.00
10 Kelompok
P3 P4 Total Selisih Awal - Jam 1
N Mean Rank Sum of Ranks
Test Statisticsb
9.000 24.000 -.733 .463
.548a Mann-Whitney U
Wilcoxon W Z
Asymp. Sig. (2-tailed) Exact Sig. [2*(1-tailed Sig.)]
Selisih Awal - Jam 1
Not corrected for ties. a.
Oneway
NPar Tests
Kruskal-Wallis Test
ANOVA
Selisih Jam 1 - Jam 2
1021.600 3 340.533 .685 .574
7949.600 16 496.850 8971.200 19
Between Groups Within Groups Total
Sum of
Squares df Mean Square F Sig.
Ranks Selisih Awal - Jam 2
N Mean Rank
Test Statisticsa,b
11.825 3 .008 Chi-Square
df
Asymp. Sig.
Selisih Awal - Jam 2
Kruskal Wallis Test a.
NPar Tests
Mann-Whitney Test
NPar Tests
Mann-Whitney Test
Ranks Selisih Awal - Jam 2
N Mean Rank Sum of Ranks
Test Statisticsb
.000 15.000 -2.619 .009
.008a Mann-Whitney U
Wilcoxon W Z
Asymp. Sig. (2-tailed) Exact Sig. [2*(1-tailed Sig.)]
Selisih Awal - Jam 2
Not corrected for ties. a.
Grouping Variable: Kelompok b. Selisih Awal - Jam 2
N Mean Rank Sum of Ranks
Test Statisticsb
1.500 16.500 -2.312 .021
.016a Mann-Whitney U
Wilcoxon W Z
Asymp. Sig. (2-tailed) Exact Sig. [2*(1-tailed Sig.)]
Selisih Awal - Jam 2
Not corrected for ties. a.
NPar Tests
Mann-Whitney Test
NPar Tests
Mann-Whitney Test
Ranks Selisih Awal - Jam 2
N Mean Rank Sum of Ranks
Test Statisticsb
.000 15.000 -2.652 .008
.008a Mann-Whitney U
Wilcoxon W Z
Asymp. Sig. (2-tailed) Exact Sig. [2*(1-tailed Sig.)]
Selisih Awal - Jam 2
Not corrected for ties. a.
Grouping Variable: Kelompok b. Selisih Awal - Jam 2
NPar Tests
Mann-Whitney Test
NPar Tests
Mann-Whitney Test
Test Statisticsb6.500 21.500 -1.257 .209
.222a Mann-Whitney U
Wilcoxon W Z
Asymp. Sig. (2-tailed) Exact Sig. [2*(1-tailed Sig.)]
Selisih Awal - Jam 2
Not corrected for ties. a.
Grouping Variable: Kelompok b. Selisih Awal - Jam 2
N Mean Rank Sum of Ranks
Test Statisticsb
9.000 24.000 -.740 .459
.548a Mann-Whitney U
Wilcoxon W Z
Asymp. Sig. (2-tailed) Exact Sig. [2*(1-tailed Sig.)]
Selisih Awal - Jam 2
Not corrected for ties. a.
Ranks
5 7.00 35.00
5 4.00 20.00
10 Kelompok
P3 P4 Total Selisih Awal - Jam 2
N Mean Rank Sum of Ranks
Test Statisticsb
5.000 20.000 -1.586 .113
.151a Mann-Whitney U
Wilcoxon W Z
Asymp. Sig. (2-tailed) Exact Sig. [2*(1-tailed Sig.)]
Selisih Awal - Jam 2
Not corrected for ties. a.
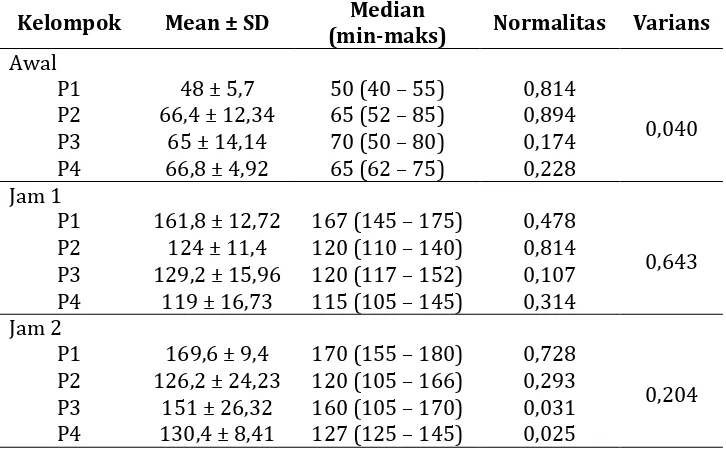
Tabel Deskriptif, Normalitas dan Varians data
Kelompok Mean ± SD Median
(min-maks) Normalitas Varians
Awal
Tabel Hasil Uji Beda
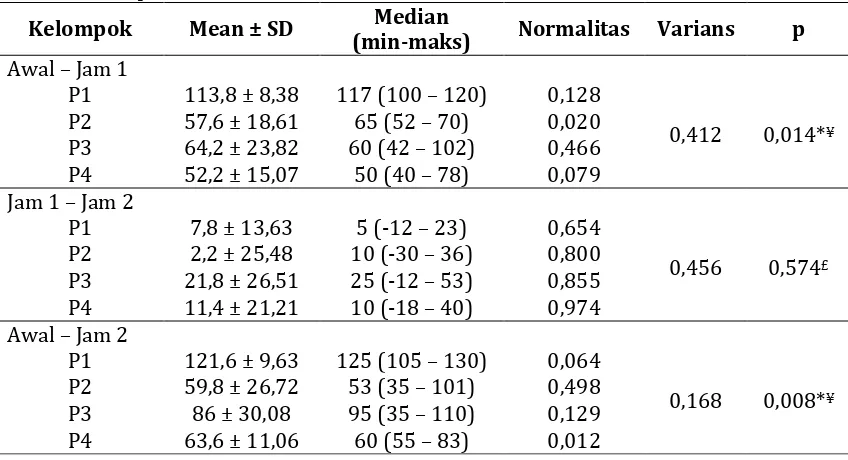
Tabel Deskriptif, Normalitas dan Varians data selisih
Kelompok Mean ± SD Median
(min-maks) Normalitas Varians p
Awal – Jam 1
P1 113,8 ± 8,38 117 (100 – 120) 0,128
0,412 0,014*¥
P2 57,6 ± 18,61 65 (52 – 70) 0,020 P3 64,2 ± 23,82 60 (42 – 102) 0,466 P4 52,2 ± 15,07 50 (40 – 78) 0,079 Jam 1 – Jam 2
P1 7,8 ± 13,63 5 (-12 – 23) 0,654
0,456 0,574£
P2 2,2 ± 25,48 10 (-30 – 36) 0,800 P3 21,8 ± 26,51 25 (-12 – 53) 0,855 P4 11,4 ± 21,21 10 (-18 – 40) 0,974 Awal – Jam 2
P1 121,6 ± 9,63 125 (105 – 130) 0,064
0,168 0,008*¥
P2 59,8 ± 26,72 53 (35 – 101) 0,498 P3 86 ± 30,08 95 (35 – 110) 0,129 P4 63,6 ± 11,06 60 (55 – 83) 0,012
Keterangan : * Signifikan p < 0,05; ¥ Kruskal-Wallis; £ One Way ANOVA;
Tabel Hasil Beda selisih data antar kelompok perlakuan dengan uji Mann Whitney
Kelompok P2 P3 P4
Awal – Jam 1
P1 0,009* 0,016* 0,009*
P2 – 0,916 0,463
P3 – 0,463
Awal – Jam 2
P1 0,009* 0,021* 0,008*
P2 – 0,209 0,459
P3 – 0,113
LAMPIRAN 5. BIODATA MAHASISWA Identitas
Nama : Pandhycha Veryza Pratama Arfan
NIM : 22010112140217
Tempat/ tanggal lahir : Jakarta, 9 November 1995 Jenis kelamin : Laki-laki
Alamat : Jl. Gondang Timur 4 No. 66B, Bulusan, Tembalang Nomor telepon : -
Nomor HP : 0811 48 91195
E-mail : [email protected] Riwayat Pendidikan Formal
1) SD : SDN Inpres Kotraja Lulus tahun : 2006 2) SMP : SMP Negeri 5 Entrop
Lulus tahun : 2019 3) SMA : SMA Negeri 4 Entrop
Lulus tahun : 2012
4) Universitas : Univ. Diponegoro Fakultas Kedokteran Prodi Pendidikan Dokter
Masuk tahun : 2012 Keanggotaan Organisasi
1) Staf PMKK KU Undip Tahun 2012 s/d 2013