CHAPTER IV
RESULTS
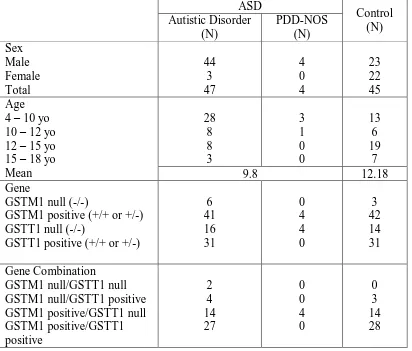
The deletion polymorphisms for GSTM1 and GSTT1 were genotyped in 51 Autism Spectrum Disorder (ASD) cases and 45 controls. Table 2 shows the frequency of ASD is 48 male and 3 female, while in control group 23 male and 22 female. The age mean of ASD is 9.8 years old and the control group is 12.8 years old.
Table 2 Distribution of age, sex, GSTM1, GSTT1 gene and combination in ASD and control
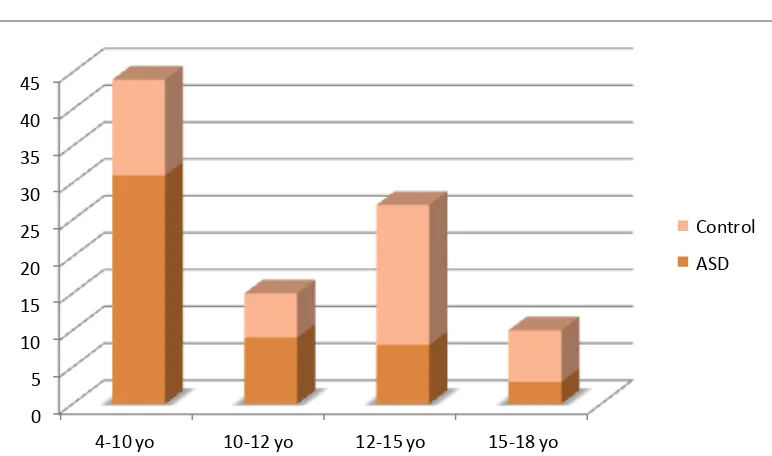
Figure 2 and 3 shows the distribution of sex and age in ASD and control group. Frequency of male patients of ASD is higher than female, but in control group the number of male and female almost the same. The highest distribution of ASD patiens are in 4-10 years old age group. Meanwhile, in control group is 12-15 years old age group.
0 10 20 30 40 50 60 70 80
Male Female
Control
ASD
Figure 2 Distribution of sex in ASD and control
0 5 10 15 20 25 30 35 40 45
4-10 yo 10-12 yo 12-15 yo 15-18 yo
Control ASD
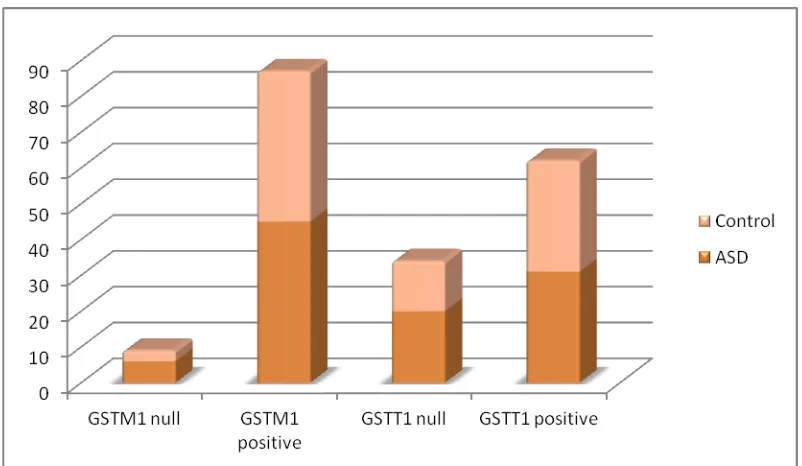
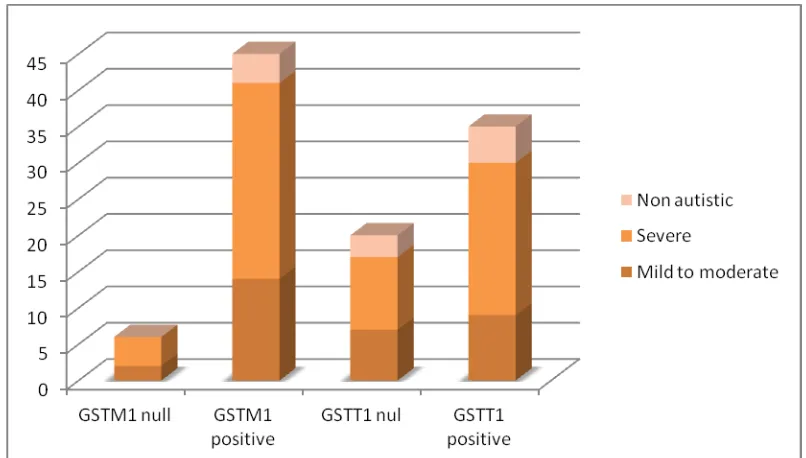
Figure 4 Distribution of GSTM1 and GSTT1 gene in ASD and control
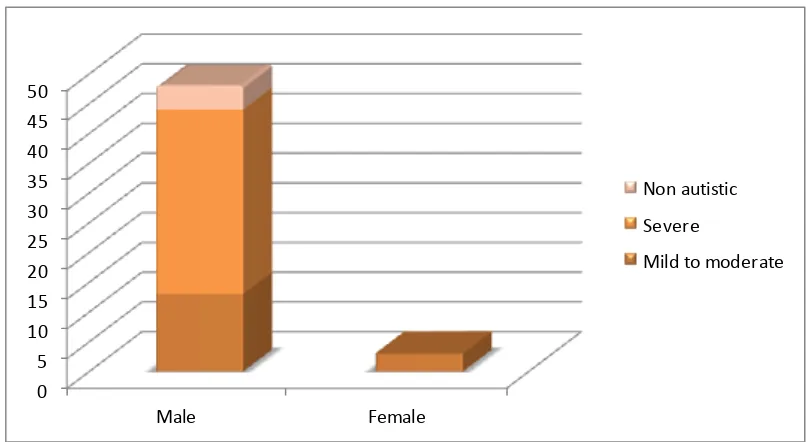
Figure 4 shows the distribution of GSTM1 and GSTT1 gene in ASD and control. The frequency of both GSTM1 null and GSTT1 null gene in ASD is higher than control, meanwhile frequency of GSTM1 positive and GSTT1 positive almost the same between ASD and control group. All female patients of ASD categorized in mild to moderate autistic using CARS. Therefore most of male ASD patients categorized in severe autistic (see table 3 and figure 5).
Table 3 Distribution of ASD according to age, sex and severity
ASD
Mild to moderate Severe PDD-NOS
0 5 10 15 20 25 30 35 40 45 50
Male Female
Non autistic Severe
Mild to moderate
Figure 5 Distribution of sex in CARS
Figure 6 Distribution of age in CARS
Figure 8 and 9 shows PCR result for GSTM1 and GSTT1 gene. The
presence of β globin gene (850 bp), GSTM1 gene band (637 bp) and GSTT1 gene
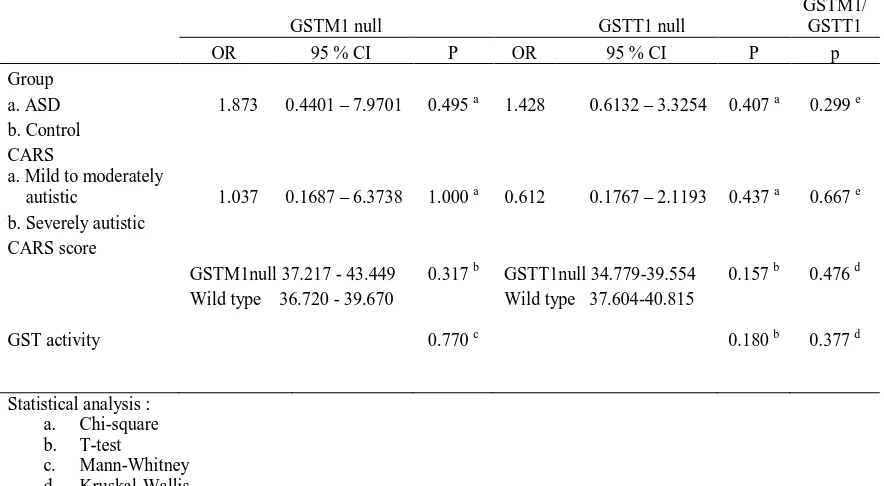
GSTM1 and GSTT1 band is interpreted as GSTM1 null and GSTT1 null. Table 2 shows the frequency of the GSTM1 and GSTT1 genotypes in ASD and control group. Frequency of GSTM1 null (11.8 %) in ASD higher compared with control group (6.7 %) but the difference is not statistically significant (p=0.495, OR=1.873; 95% CI 0.4401 – 7.9701). GSTT1 null genotype’s frequency (39.2 %) compared with control group (31.1 %) is higher but also no significance different (p=0.407,OR=1.428;95% CI 0.6132 – 3.3254). Additionally, combination of GSTM1 and GSTT1 was not reach statistically significance among cases and controls (p=0.299) [see table 4].
Figure 7 Distribution of GSTM1 and GSTT1 gene in CARS
Phenotype expression of ASD is represented by Childhood Autism Rating Scale (CARS), divided into two group as mild to moderately autistic and severely autistic. Frequency of GSTM1 null in mild to moderately autistic (11.1 %) almost
in mild to moderately autistic is 44.4 % and 32.2 % for severely autistic (see table 2). There is no statistically different in the distribution of GSTM1 null and GSTT1 null between mild to moderately autistic and severely autistic (p=1.000,OR=1.037;95% CI 0.1687 – 6.3738 and p=0.437,OR=0.612; 95% CI 0.1767 – 2.1193), that also found in combination of GSTM1 and GSTT1 gene in which the p value is 0.667. Statistical analysis for GSTM1 null, GSTT1 null and combination of both gene compared with CARS score also showed no significance different (see table 4).
Figure 7 PCR result for GSTM1 gene Lane 1: marker (ladder 1 kb)
Lane 2,4,6,7 : GSTM1 positive (+/+ or +/-) Lane 3 & 5 : GSTM1 null (-/-)
Lane 8 : positive control Lane 9 : blank
β globin : 850 bp ; GSTM1 gene : 637 bp
850 bp
Table 4 Odd ratios (OR) and p value of GSTM1, GSTT1 and combination both genes in association with group and phenotype expression
GSTM1 null GSTT1 null
GSTM1/ GSTT1
OR 95 % CI P OR 95 % CI P p
Group
a. ASD 1.873 0.4401 – 7.9701 0.495 a 1.428 0.6132 – 3.3254 0.407 a 0.299 e b. Control
CARS
a. Mild to moderately
autistic 1.037 0.1687 – 6.3738 1.000 a 0.612 0.1767 – 2.1193 0.437 a 0.667 e b. Severely autistic
CARS score
GSTM1null 37.217 - 43.449 0.317 b GSTT1null 34.779-39.554 0.157 b 0.476 d Wild type 36.720 - 39.670 Wild type 37.604-40.815
GST activity 0.770 c 0.180 b 0.377 d
Statistical analysis : a. Chi-square b. T-test
c. Mann-Whitney d. Kruskal-Wallis e. Kendall tau
Figure 8 PCR result for GSTT1 gene Lane 1 : marker (ladder 100 bp)
Lane 2,3,5,7,10,11,12,14 : GSTT1 positive (+/+ or +/-) Lane 4,6,8,9,13,15 : GSTT1 null (-/-)
Lane 16 : positive control ; lane 17 : blank
β globin : 850 bp ; GSTT1 gene : 459 bp
850 bp
The erythrocyte Glutathione s-transferase (GST) activity was examined in 6 ASD patients and 8 controls using ELISA. There was no significant difference for the mean erythrocyte Glutathione s-transferase (GST) activity among cases with GSTM1 null and wild type genotype (p=0.770) [see table 4]. Table 5 shows that the mean erythrocyte GST activity in ASD is lower (0.374 ± 0.262 nmol/min/ml) compared with controls (1.486 ± 0.262 nmol/min/ml) and the difference is statistically significant (p=0.043). Whereas, in severely autistic, mean erythrocyte GST activity is lower (0.259 ± 0.037) compared with mild to moderately autistic (0.432 ± 0.317) ,but there was no statistically significance (p=0.509). GST activity associated with CARS score was also not reach statistical significance (p=0.089).
Table 5 Mean erythrocyte Glutathione S-transferase activity in Autism Spectrum Disorder patients and control group
GST activity
Mean (nmol/min/ml) 95% CI P
Group
a. ASD (n = 6) 0.374 ± 0.262 0.164 - 0.584 0.043*
b. Control (n = 8) 1.486 ± 1.269 0.607 - 2.365 (T-test) CARS
a. Mild to moderately autistic(n=4) 0.432 ± 0.317 0.121 - 0.743 0.509 b. Severely autistic (n = 2) 0.259 ± 0.037 0.207 - 0.311 (T-test)
CARS score (n = 6) 24.990 - 47.410 0.089
(ANOVA)
* p < 0.05 : significant
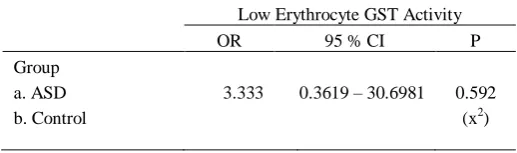
Table 6 Odd ratios (OR) and p value of Erythrocyte GST activity in association with group
Low Erythrocyte GST Activity
OR 95 % CI P
Group
a. ASD 3.333 0.3619 – 30.6981 0.592
b. Control (x2)