INTEGRATION OF LIDAR DATA INTO A MUNICIPAL GIS TO STUDY SOLAR
RADIATION
P. Africanib
, G. Bitellia
, A. Lambertinia,∗, A. Minghettib, E. Pasellib
a
Dept. Of Civil, Chemical, Environmental and Materials Engineering - DICAM, University of Bologna, Viale del Risorgimento 2, 40136 Bologna, Italy - (gabriele.bitelli, alessand.lambertini2)@unibo.it b
Municipality of Bologna - Unit Territorial Information System (SIT), Piazza Liber Paradisus 10, 40129 Bologna, Italy - [email protected]
KEY WORDS:LIDAR, Point Cloud, Urban, GIS, Building, Extraction, Modelling, Radiation
ABSTRACT:
Identifying the right roofs to install solar panels inside a urban area is crucial for both private citizens and the whole local population. The aim is not easy because a lot of consideration must be made: insolation, orientation of the surface, size of the surface, shading due to topography, shading due to taller buildings next the surface, shading due to taller vegetation and other possible problems typical of urban areas like the presence of chimneys. Accuracy of data related to the analyzed surfaces is indeed fundamental, and also the detail of geometric models used to represent buildings and their roofs. The complexity that these roofs can reach is elevated. This work uses LiDAR data to obtain, with a semi-automatic technique, the full geometry of each roof part complementing the pre-existing building data in the municipal cartography. With this data is possible to evaluate the placement of solar panels on roofs of a whole city analyzing the solar potential of each building in detail. Other traditional techniques, like photogrammetry, need strong manual editing effort in order to identify slopes and insert vector on surfaces at the right height. Regarding LiDAR data, in order to perform accurate modelling, it is necessary to obtain an high density point cloud. The method proposed can also be used as a fast and linear workflow process for an area where LiDAR data are available and a municipal cartography already exist: LiDAR data can be furthermore successfully used to cross-check errors in pre-existent digital cartography that can remain otherwise hidden.
1 INTRODUCTION
A deep knowledge of the city and urban structure geometry is to-day essential for a great number of applications. Buildings shape and their placement are fundamental informations needed to con-duct a better management of the city itself. Today modern ge-omatic offers efficient tools with high precision to obtain data on a larger scale. Three-dimensional representation in form of
3D city modelscan be realized with different techniques, in par-ticular digital photogrammetry and laser scanning that can out-put products at different level of details and precision, with great potential and the possibility to use into Geographic Information Systems maintained by municipalities and public agencies for ur-ban management and planning. Knowing that a city is a central hub of energy use, among useful applications there is the study about energy consumption and production. These analysis can be conducted from a urban scale even to single buildings in de-tail. One example isBologna Solar City, from Municipality of Bologna (Italy): a web application created to evaluate the place-ment of solar panels on roofs. It will be discussed in detail in the following section. Another example is to use LiDAR data and a derivative Digital Surface Model to produce a true ortophoto (G¨unay et al., 2007) that is useful in order to refine a detailed energy map relative to each building. This kind of analysis at building level was performed within EnergyCity, a project from Central Europe, to better understand the actual energy manage-ment and support strategies from the urban municipalities in or-der to reduce energy consumption and CO2emissions (Bitelli and Conte, 2011).
1.1 Bologna Solar City
Municipality of Bologna has a long experience in cartography and a good collection of data over the years in digital format. These data are continuously updated through different sources: georeferenced CAD drawings from executive projects, manual
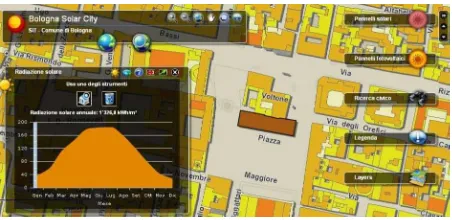
extraction of features from aerial orthophoto taken every year and surveys on the field are used to update the original large scale nu-merical cartography (CTC) made by aerial photogrammetry. In 2010, in order to help its inhabitants to reduce energy costs and save the environment, Bologna SIT office created a web appli-cation calledBologna Solar Cityto search for renewable energy systems applied in the Bologna territory and to evaluate the place-ment of solar panels on roofs. The basic idea was to estimate the solar energy available on roofs. This evaluation is the sum of direct and diffuse solar energies and it was calculated with Ar-cGIS tools. The algorithm applied required several elements in input, first of all a DSM (Digital Surface Model) of the city terri-tory developed with many altimetric information deducted from the municipal cartography. The other factors considered are, on a raster-based model, weather conditions, position and shade of each location (Minghetti et al., 2011).
Figure 1: Web application Bologna Solar City
The main simplification inBologna Solar Citywas to consider all the roofs as flat, because in 1:2000 municipal cartography there are only two height information for each building: the bottom line and the height of the rain gutter. Unfortunately the greatest part of roofs in Bologna, as well as in many other cities, are com-posed from a complex arrangement of different slopes, with many ridges and valleys. In order to perform an accurate analysis, dif-ferent parameters must be considered: insolation, orientation of the surface, size of the surface, shading due to topography, shad-ing due to taller buildshad-ings next to the surface, shadshad-ing due to taller vegetation and other possible problems typical of urban area like the presence of chimneys.
Accuracy of data relative to analyzed surfaces is indeed funda-mental, and also the detail of geometric models used to represent buildings and their roofs. For this reason the precise geometry has to be acquired in order to have a good evaluation about the solar potential of each part of the roof. To obtain this kind of information a Digital Surface Model of the city could be very useful. This is obtained, in the presented work, from LiDAR data using point clouds acquired from airborne laser scanning. These points are loaded in ENVI LiDAR, a software from Exelis Vi-sual Information Solutions. This software can classify and also directly extract 3D features from the point cloud, if the data den-sity is adequate. One challenge is to integrate LiDAR data and digital 2D cartography taking in account that each dataset has a different origin, a different reference system and also a different acquisition epoch.
2 AVAILABLE DATASETS
At the moment of writing this paper there is no LiDAR data avail-able to cover the whole city of Bologna, but only partial coverage. The chosen study area is Reno district, one of the areas with full data coverage along with Porto district which is less interesting in the analysis of this paper, being partially covered by railway and Station of Bologna and being partially inside the historical center of the city, where the installation of solar panels on roofs has to follow strict rules.
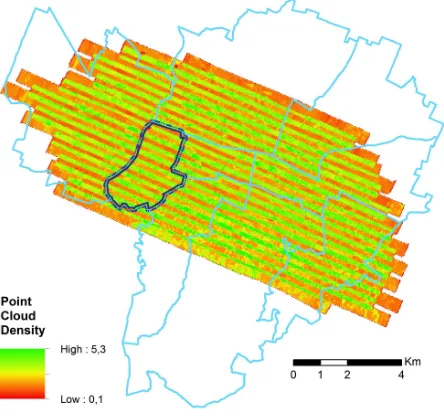
Figure 2: LiDAR data coverage and Bologna district boundaries
The laser scanner used by Blom CGR S.p.a. in the flight that took place in 2009 was a Optech ALTM 3033 with the following specification:
• Scan width (FOV): +/- 11 degrees
• Operational altitude: 1250 m altitude Above Ground Level
• Distance between strip axis: 322 m
• Laser repetition rate: 33 kHz
• Horizontal accuracy: 1/2000 altitude = 0.6 m
• Vertical accuracy: +/- 0.2 m at the 1250 m altitude AGL
The dataset received is in LAS format in a projected CRS: WGS84 / UTM zone 32N (EPSG:32632). Elevation data is therefore re-ferred to WGS84 ellipsoid.
The LiDAR cloud is not particulary dense. The survey was not performed with 3D building extraction as primary goal. There-fore, the average data density is only equal to 1 point/m2
with higher value where two adjacent strips cover the same area as can be seen in Figure 2.
In this work were also used the shapefiles from digital GIS cartog-raphy (CTC) at a nominal 1:2000 scale, produced and mantained by Municipality of Bologna and now shared as Open Data:
• Buildings perimeter
• Elevation points with orthometric height
• District boundaries
This dataset has a different CRS than LiDAR data: ED50 / UTM zone 32N (EPSG:23032) and orthometric height. In order to work in an accurate and coherent environment, all shapefiles were transformed into the same CRS as LiDAR data using ConvER3 GPS7, a free software from Regione Emilia-Romagna. It can use IGM (Italian Military Geographical Institute) grid to perform a rigorous transformation from different Coordinate Systems, in-cluding conversion from geoid to ellipsoid heights and viceversa. The result is more accurate than transformation parameters inside GIS software.
3 DATA PROCESSING
The study here described uses the software ENVI LiDAR from Exelis VIS. The procedure firstly consists in importing all the 20 LAS files acquired over Bologna in ENVI LiDAR that converts them into a unique binary data file for a faster manipulation. The first operation to perform is to check data density through the work area. This is illustrated in Figure 2 exporting the result as a raster.
ENVI LiDAR procedures operate to filter data and classify each point of the cloud. Then, through automated feature identifica-tion with manual tools for quality control, it is possible to extract different features as: vegetation, power line vectors and power poles, DSM and filtered DTM, building vectors with roof face and perimeter.
3.1 Fine-tuning parameters
Regarding building extraction some production parameters has to be set:
• Minimum area - building planes with an area below set value,
will not be vectorized.
• Near Ground Filter Width - filters out buses, trucks and train
cars. Building planes less than 5 meters from the ground are not classified as buildings unless they have a width greater than this parameter.
• Buildings Points Range - spatial variation of building’s points:
the value is used by the software’s algorithm that scans for planar surfaces when the point density is not constant in-side analyzed area or when there are some holes in the point cloud dataset. In this cases the value can be set as high as 1.2 or 1.4 meters, increasing risk to misclassify vegetation point into building class.
• Plane Surface Tolerance - curved roofs are modeled using
a series of successive planes. A new plane starts when the distance between the points being analysed and the previous plane reaches this value.
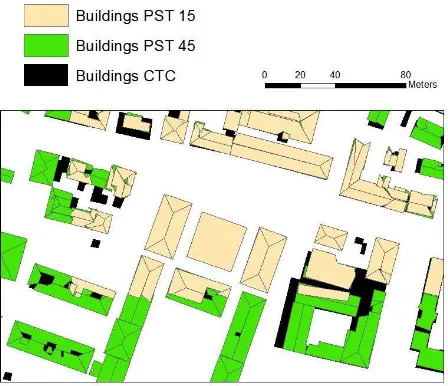
Figure 3: Results from different Plane Surface Tolerance values
Plane Surface Tolerance (PST) is a sensible parameter. The de-fault value is 30 cm. With the available data best results can be achieved using a value of 45 cm as seen in Figure 3, due to point cloud low density and low accuracy. However, using such an high value has a disadvantage when it comes to modelling curved surfaces as can be seen in Figure 4a, where a curved roof of an industrial building is extracted.
Within the urban environment where the study area is set, there are various problems related to features, like buildings from var-ious periods with hipped or gabled roof often irregular and made more complex by the presence of heterogeneous elements. There is also a strong noise effect on point cloud data caused by veg-etation that is located adjacent to the buildings on the fringes of urban roads. In correcting the slopes of the roofs the primary focus must be to keep their correct aspect rather than the exact representation of all the complexity that some buildings show as chimneys, dormers, and complex geometries. It would not be technically possible to represent them due to the reduced density
(a) PST 15 (b) PST 45
Figure 4: Different PST value with a curved surface
of the points, it is also not relevant to the objectives that have been placed in this research, which require to take greater ac-count regarding orientation of the surfaces analyzed with the aim of evaluating their solar radiation potential.
Through extensive tests the following parameters were chosen to perform analysis on the dataset for the test area:
• Minimum area: 5 m2
• Near Ground Filter Width: 150 cm
• Buildings Points Range: 1,4 m
• Plane Surface Tolerance: 45 cm
An example of the results is shown in Figure 5.
Figure 5: Roof’s polygons automatically extracted
3.2 Elevation data
Regarding height accuracy, tests were performed with ConvER3 GPS7 and data from the official IGM grid in the whole Reno district. The Geoid Height values in Reno district are between the range from 39.2 meters to 39.4 meters. The height from Elevation points in shapefile from CTC is orthometric while the data at the same coordinate in LiDAR cloud is referred to WGS84 ellipsoid. The local Geoid Height, computed as a difference between the two values, is close to the corrispondent IGM value considering the accuracy of both LiDAR and shapefile data.
It’s also possible to use LiDAR data to cross-check possible er-rors in pre-existent digital cartography, that can remain otherwise hidden, as can be seen in Figure 6. One kind of analysis can be to highlight areas where the difference between known Geoid Height value in the area and the calculated Geoid Height (dif-ference between ellipsoid height from LiDAR and orthometric height from numerical cartography) isn’t close to the given toler-ance.
Figure 6: Possible error highlighted with a yellow triangle, Or-thometric Height from CTC in green, calculated Geoid Height in red
4 REFINEMENTS, EDITING AND QUALITY ASSURANCE
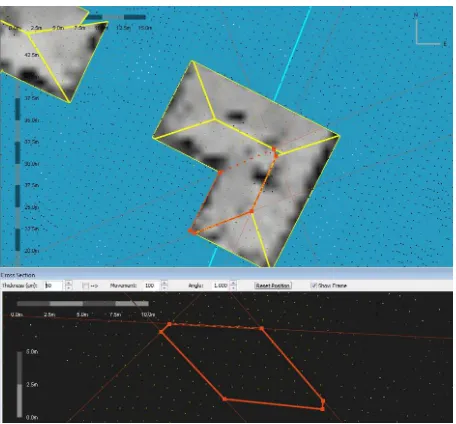
Using ENVI LiDAR after the beginning classification procedure and the further building extraction procedure, is then possible to use tools to ensure that resulting feature representations are accu-rate. In theQuality Assurancemode is possible to interactively fine-tune point classifications and specially modify feature vec-tors such as building’s roof shape using various tools such as cross sections. Some points do not belong to building class, as can be seen in Figure 7.
Figure 7: Cross section
Laser scanners detects points on antennas, chimneys and every reflective surface. These points and other outliers are automati-cally filtered out from software algorithm as they become noise around the roof surface. With tools like Cross Section in ENVI LiDAR is possible to manually remove these points if they were not correctly classified. Also, with Change Classification Code tool, points that were not classified as buildings can be assigned to the correct class. If the data density is adequate, it is also pos-sible to set the selected points as a starting point for a new inter-polating surface searching. This reduces limitations set on noise
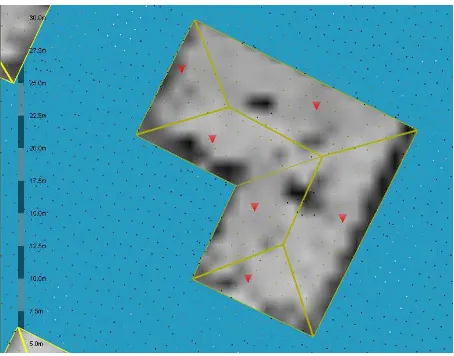
in the automatic process, thereby increasing the ability of ENVI LiDAR to set a plane at the designated point. Each vector can be manually edited, moving its vertices in every direction, to fit better to the local point cloud (Figure 8). A red triangle pointing down will appear highlighting the area where the modification is applied. All the possible operations to be performed on the data are listed in a dialog box.
Figure 8: Manual editing procedure
There is also the chance to introduce external data into the point cloud. This is a useful feature in order to verify the correct place-ment of buildings and if some of them have initially remained unnoticed from the automatic 3D extraction. The municipal nu-merical cartography is loaded to perform a visual check. As can be seen in Figure 9 some buildings were not recognized from the low density point data cloud.
Figure 9: 3D Extracted roofs along with buildings footprints from pre-existing digital cartography
Furthermore, in a traditional survey or in photogrammetry it is possible to identify quality-control elements in corrispondence with surface discontinuity as walls intersection or rain gutter line in roofs. Those two kind of controls are not available in LiDAR data especially when there is a low density in points. In pitched roofs, the clearest discontinuity is the ridge roof line which posi-tion is determined at the intersecposi-tion of the adjacent roof planes. An evaluation of planimetric accuracy can be performed com-paring ridge roof lines in overlapping LiDAR strips (Vosselman, 2008). Those lines can be easily extracted from the data cloud with software like ENVI LiDAR.
The 3D models of buildings superimposed on the photogrammet-ric model in a stereophotogrammetphotogrammet-ric workstation can provide the way for a quick visual inspection of the correct description of buildings geometry.
Figure 10: Building passed QA with little manual editing
Once the interested buildings passedQuality Assurancecontrol (Figure 10) the polygon file is ready to export. As it’s shown in Figure 11, the final 3D model can be viewed in a realistic repre-sentation, allowing to further qualify the accuracy of results fly-ing through the scene.
Figure 11: 3D Viewer interface: details from the study area
5 SOLAR RADIATION ANALYSIS
In order to perform solar radiation analysis, one possibility is to directly use the Digital Surface Model produced from LiDAR data and buildings shapefile from digital cartography as mask for
the DSM to analyze only roofs area. The LiDAR points must be first classified in order to remove vegetation points and possible outliers. Doing so, the DSM can be computed only on points be-longing to buildings and ground level. But with data so low in density as 1 point/m2
the resulting DSM has a potential cell size of only 1 meter. Performing slope and aspect analysis at building level with so low detail brings in a lot of noise and salt and pepper effect that makes the data not suitable to identify every different surface of each roof. As can be seen in Figure 12 there are also holes in the data that occur where the point cloud density goes below 1 point/m2
.
Figure 12: Aspect Map generated from DSM masked with Mu-nicipality shapefile
To have a better resolution the point density must grow expo-nentially: the operative rule to obtain aPpixel size in generated DSM isP=1/sqrt(d)wheredis the point cloud density. Using a dataset with 4 points/m2the raster resolution can be 0,50 m; us-ing a dataset with 16 points/m2a raster resolution of 0,25 m can be achieved (Beinat and Sepic, 2008).
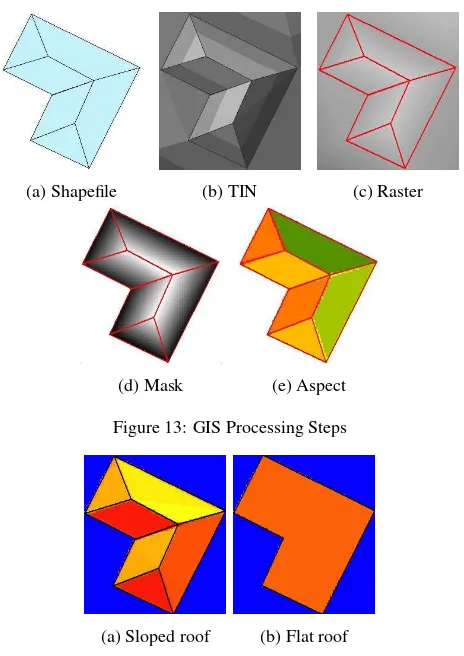
To obtain slope and aspect values in ESRI ArcGIS environment, using a 3D shapefile (Figure 13a) exported as a Polygon Z(M) from ENVI LiDAR, the best option is to transform 3D data to a raster. Generating a DSM allows to run 3D analysis tools like: line-of-sight, viewsheds or solar radiation calculations. This trans-formation is performed creating first a Triangular Irregular Net-work (TIN) using the roof polygons as breaklines and using con-strained Delaunay triangulation where no densication occurs and each breakline segment is added as a single edge (Figure 13b). Then it’s used a tool to generate a raster linearly interpolating cell z-values from the input TIN at the specified resolution of 0.5 meters that should be adequate given the instrument accu-racy (Figure 13c). ThenExtract by Maskfunction is performed to delete values outside the modeled buildings, using the build-ing’s perimeter polygons obtained from ENVI LiDAR as a mask (Figure 13d). With this final raster is possible to create deriva-tive products like aspect (Figure 13e) and slope maps and use the resulting DSM to perform solar radiation analysis.
(a) Shapefile (b) TIN (c) Raster
(d) Mask (e) Aspect
Figure 13: GIS Processing Steps
(a) Sloped roof (b) Flat roof
Figure 14: Area Solar Radiation
different roof slopes as seen in Figure 14a. The global solar radi-ation on the sloped roof is 95% of the one obtained with the flat roof. But actually only south-facing roof areas are suitable for solar panel installation. If the same ratio is computed considering only south faces from the sloped roof, the global solar radiation is only 28% the amount of the flat roof model. As expected, the flat roof simplification tends to overstimate the solar potential of the building, while with proposed method that value can be com-puted with a good accuracy for each building.
6 CONCLUSIONS
The availability of software packages that allow to extract, virtu-ally in automatic mode, 3D features, and in particular buildings, from high density LiDAR data is very attractive for a variety of applications in urban areas, among which regarding assessments in the energy field. A precise 3D roof’s model can be easily ex-tracted and with it all the information about surface area and ori-entation of each slope.
The work has shown that a software of this kind can be in par-ticular useful in studies devoted to evaluation of solar systems installation on the rooftops (the example developed at Bologna Municipality has been described), or in analyses related to energy loss. Another secondary positive result is that this approach can help further validation of numerical cartography, derived from photogrammetric database, adopted as the backbone of a munic-ipal GIS.
One of the main problems emerged is that, in order to reduce to a minimum the manual intervention in the presence of com-plex geometries of the roofs, it is important to have dataset with a density much greater than that commonly available. Therefore it is appropriate to schedule specific LiDAR acquisition flights. In further analysis, if more detailed LiDAR data will be
avail-able, it will be possible to produce a better 3D roof model and estimate an even more accurate solar potential of each building, and also high vegetation will be taken in account and its shadow introduced in solar radiation computation.
ACKNOWLEDGEMENTS
The authors would like to say thank for the fund of the Central Europe Programme.
The paper was elaborated within the EnergyCity project. LiDAR data were acquired by Blom CGR S.p.a.
REFERENCES
Beinat, A. and Sepic, F., 2008. Verifica planimetrica di rilievi lidar da aeromobile tramite elementi lineari: Metodo e sperimen-tazione. Proceedings 12a Conferenza Nazionale ASITA, pp. 323– 328.
Bitelli, G. and Conte, P., 2011. Techniques, tools and workflow for remote sensed roof temperature mapping in some cities across central europe. Proceedings 17th International Conference Build-ing Services, Mechanical and BuildBuild-ing Industry Days Urban En-ergy Conference, Debrecen, 13-14 October 2011 pp. 49–56.
G¨unay, A., Arefi, H. and Hahn, M., 2007. True orthophoto pro-duction using lidar data. International Archives of Photogramme-try, Remote Sensing and Spatial Information Sciences.
Maas, H., 2003. Planimetric and height accuracy of airborne laserscanner data: User requirements and system performance. Proceedings of Photogrammetric Week 49, pp. 117–125.
Minghetti, A., Africani, P. and Paselli, E., 2011. Bologna so-lar city, a web application for the analysis of potential energy: from estimating solar radiation to the realization of the applica-tion. Proceedings 17th International Conference Building Ser-vices, Mechanical and Building Industry Days Urban Energy Conference, Debrecen, 13-14 October 2011 pp. 25–30.
Rottensteiner, F. and Briese, C., 2002. A New Method for Build-ing Extraction in Urban Areas from High-Resolution LIDAR Data. ISPRS Commission III, WG III/3 XXXIV(3), pp. 295–301.
Shirowzhan, S. and Lim, S., 2012. Extraction of polygon foot-prints from lidar data in an urban environment. ICSDEC 2012 pp. 246–251.