AGROMETEOROLOGICAL DATA AND RAINFALL FORECASTING FOR CROP SIMULATION
Penggunaan Data Agrometeorologi dan Prakiraan Curah Hujan untuk Simulasi Tanaman
L. I. Amien and E. Runt unuwu
Bal ai Penel it ian Agrokl imat dan Hidrol ogi Jl . Tent ara Pel aj ar 1A, Bogor 16111
ABSTRACT
Agricultural production is one of the most weather sensitive human activities that depend on daily atmospheric conditions. This review attempts to describe the meteorological data for crop requirements, some techniques of climate prediction and its use for crop simulations. Despite the rapid progress achieved in forecasting technology lately, further works are necessary for the real application. The amount and distribution of the rainfall in the coming season is necessary for planning crop cultivation particularly when climate anomaly arises. In agriculture the efforts to bridge the gap, climate forecasting results are the main input in crop simulation, especially for water and agro-climate management and cropping calendar.
Keywords : Agrometeorological data, rainfall forecasting, crop simulation
ABSTRAK
Produksi pertanian merupakan salah satu dari aktifitas manusia yang sangat bergantung pada kondisi atmosfir. Review ini mencoba menggambarkan pentingnya data meteorology, teknik prediksi iklim, dan aplikasinya untuk simulasi tanaman. Meskipun laju perkembangan prediksi ini agak lambat, tetapi ke depan prediksi iklim ini perlu diaplikasikan. dalam perencanaan pertanian terutama pada kondisi iklim anomali. Hasil prakiraan ini sangat penting untuk bidang pertanian karena merupakan input utama di dalam simulasi tanaman, terutama untuk pengelolaan air-iklim-tanaman, serta penentuan kalender tanam.
Kata kunci : Data agrometeorologi, prakiraan curah hujan, simulasi tanaman
ith still about 40% of the country and 60% of the outer islands work forces engage in agriculture, made it the single largest employer in Indonesia. A healthy agricultural sector has been shown to be a prerequisite for sustained economic growth. Adequate supplies of affordable food are essential for poverty alleviation and economic development. Agriculture is also one of the most weather dependent of all human activities. Variations in weather and climate as well as their interaction with agricultural operations, from planting to harvesting determine appreciable parts of the yield variations. Despite the advances made in understanding the influence of climate on agricultural production, climate variability has been, and continues to be, the principal source of fluctuations in food production.
As an archipelagic tropical country, Indonesia is one of the most vulnerable to
climate change that caused by global warming. The inevitable climate change will have tremendous impacts on many aspects of life that require reconsideration of the development strategy. Agriculture will be seriously affected by altering agricultural lands and the production systems. The climate change also impacted economically as reported by Benhin (2008). Mean annual estimates indicate that a 1% increase in temperature will lead to about US$ 80.00 increase in net crop revenue while a 1 mm/month fall in precipitation leads to US$ 2.00 fall, but with significant seasonal differences in impacts. There are also significant spatial differences and across the different farming systems.
weather information. Weather and climate information can be used with new technological tools and data base infrastructures to assess risk and to quantify probabilities associated with weather and climate variability. The implications are enormous not only for agricultural extension services who are providing the linkage between new research results and operational applications but also for policy level decision makers who are responsible for food security and marketing decisions for their agricultural products. Boken (2009) has improved a drought early warning model for an arid region using a soil-moisture index. The soil-moisture index and other variables derived from the rainfall data could be potential candidates for developing drought early warning models for other arid regions. Such early warning information allows improved long term planning opportunities that will benefit agriculture.
The objective is to provide appropriate information derived from both meteorological data and agricultural data sources. Meteorological data are collected hourly to daily and are merged into climate data bases which expand the use from real-time operational applications to historical or comparative studies of weather and climate. Building a long period of record becomes imperative for the greater understanding of the role of weather and climate variability or trends within an agricultural region. Agricultural data, on the other hand, are collected in many different formats in the field and have a wide temporal and spatial variability as well. However, it is essential to gather as much information on crop type, crop calendar, and specific crop stage to also build a good historical data base for analysis of trends and variability. In addition to crop information, some knowledge of soil information is also extremely important for a good understanding of the agricultural meteorology of an area. Thus a combination of meteorology, agronomy, and crop physiology and penology form the complete data bases needed for analysis. Varella et al.
(2010) illustrated the link of 16 different configurations of different soil, climatic and crop conditions. How this information is used and what analytical tools are necessary forms the basis of technological applications.
Remote sensing technolgy has been used also to collect weather and climate data (Unninayar and Olsen, 2008; Minnettand and Barton, 2010). Several weather radar stations have been developed to detect the spatial variation of local rainfalls (Gerstner and Heinemann, 2008; Varella et al. 2010). Those are useful for providing rainfall forecasts with a few hours' warning. The radar provides a high-resolution image of the rainfall pattern, usually every five minutes or (optionally) once per minute. The radar measurements may be presented as time series of rainfall for specific catchments or as graphical images of the full radar coverage. This information can be broadcast to the web in real-time. Weather radar can also be combined with its urban drainage models and thus provide an integral part of urban information and flood management systems.
A national meteorological or other agro-meteorological service can contribute to the national economy. And best obtain recognition and remuneration for the investments made in agricultural meteorology, through provision of effective and efficient operational agro-meteorological services. Therefore, the challenge in front of the agro-meteorologists around the world is that more than ever before, there is a great need to more effectively integrate and deploy the skills we have developed in operational, experimental and theoretical aspects of agricultural meteorology. Timely provision of appropriate services will make production in agriculture and forestry systems more reliable, more efficient and above all more equitable in the world at large.
AGROMETEOROLOGY DATA FOR CROP REQUIREMENTS
technologies and telecommunications creates a great opportunity to enhance the role of agro-meteorologists in many decision-making processes. Information may be in the form of advisories to farmers regarding planting or spraying decisions. Information may be used in crop management systems that extension services provide to the agricultural community. It may also be incorporated into early warning alerts related to food security or market implications.
For an optimum growth, crops require heat, and water as well as plant nutrients. Except for a few like mushrooms, plants need solar radiation for photosynthesis to grow further and producing the harvested parts. Amien (2004) noted that crops will produce optimally when all the requirements of nutrient, water, heat and solar radiation are satisfied in all the stages of growth. Potential yield that determine by crop genotype and temperature can be reduced below the expected value because of limitations to the accumulation of dry matter during specific phases of growth. Attainable yield that determine by water availability and extreme meteorological conditions can additionally be affected by restrictions on the initiation and harvested parts of the crop such as flowers, fruits, grain or tubers. The ratio between actual and attainable
yield can be further reduced below normal by prolonged delay in the essential farming operation that affect crop establishment. The crop yield is also affected by timeliness of fertilizer and biocide application and harvest effectiveness. Agro-meteorology phenomena that responsible for the yield reduction are: low temperature or frost, high temperature, excessive rainfall, insufficient rainfall, excessive wind speed, and low solar radiation. The most common agro-meteorological variables and how it affects on crops are presented in Table 1.
Weather also will affect agriculture activity in the field from land preparation, sowing, fertilizer application, plant protection, harvest and post harvest activity. Excessive or shortage of water will make the tilling of heavy clay soils with specific mineralogy very difficult and expensive. As in many of the more developed world, with less and less farm workers doing rice transplanting in Asia, a new technology of rice planting called direct seeding where the rice seed is directly broadcasted to the fields with a right amount of moisture, is widely applied. The technology application requires precise information on rainfall because heavy rainfall will wash away the seed that were broadcasted in the fields. High rainfall also will hinder the broadcast fertilizer application and spraying of biocide for plant protection. High rainfall and
Table 1. Agro-meteorology variable and the effects on crops
Variable Effect
Daily minimum temperature Frost damage; lower limit of temperature tolerance
Daily maximum temperature Heat stress
Daily mean temperature Rate of crop growth and production
Atmospheric humidity
Lower limit Desiccation
Upper limit Crop disease indicator
Wind speed Crop mechanical damage
Excessive rainfall Water logging, crop inundation, traffic ability, disease
Solar radiation
Upper limit Rate of maturing
Lower limit Delayed grain filling, raised moisture content
Excessive evaporation Crop stress
Soil water shortage Drought
Soil water excess Water logging
wind speed certainly will adversely affect harvest and post harvest activity. Certainly the harvest can be delayed, but delaying the harvest will reduce the quality of the harvest. Drying grain with high moisture content as affected by high rainfall will be difficult and expensive. In Cauca Valley of Colombia where sugarcane is a major commodity, for easy handling the canes are usually burn before harvesting. The smoke from the fire will disturb the population in nearby settlements, therefore the wind direction is essential information required to schedule the burning of the canes in order to minimize the adverse effects.
Crops require specific agro-meteorological condition at different stages of the growth and different crop require different condition. The growth stages are divided into initiation, establishment, vegetative, reproductive, and ripening. Shortage or excess of water, heat and solar radiation at particular stage of growth will have adverse effects on the crops. Crops generally require high amount of water during vegetative stage but less water and high solar radiation during reproductive stage. Plants are also sensitive to temperature, as the case of rice as indicated by steadily higher yields obtained during the cooler season of December-May than the warm and high rainfall of June-November in Bangladesh (Amien, 2005). Specific agro-meteorological conditions also induce the flowering of some crops. A photo-sensitive rice variety cultivated in southern part of Borneo starts panicle initiation whenever day length exceeding certain value. Beyond the optimal values of water availability, temperature, and solar radiation will have adverse effects on the crop growth and eventually reduce the yield.
The weather condition during initiation, the early growth is very crucial for further development of crops. An adverse weather condition may delay the crop growth or even kill the germinating seed that require another planting task. Temperature and water content of the soil will determine whether the seed broadcasted in the field will germinate. Rice seed will cease to germinate when the temperature is exceeding 35○C or below 8○C or when the moisture content of the soil below field capacity. Even the establishment of winter
cereals such as wheat and barley is greatly harmed when the temperature below 3○C and shortage of water will cause uneven establish-ment in the field. Therefore, more precise information on agro-meteorology particularly on temperature and rainfall as the source of water in rain-fed agriculture is required to determine the right time to start sowing or planting.
When the limiting factor for the crop growth is water usually it can be solved in the field, by applying irrigation when it is shortage or draining the field when it is excessive. Certainly these can only be carried out when the water resources and mean to withdraw it are available. Farmers in developing countries have indigenous way to deal with water excess by preparing the fields in ridge furrow system and planting that can not stand water lodging like corn or legume on the ridge and rice on the furrow. However, when the problem is heat, solar radiation or strong wind it will be very difficult and expensive to rectify except for those crops planted in green houses. Strong wind to certain extent can be prevented by planting trees as wind break. When reliable forecast of the coming seasonal weather is available in advance, risks analysis and assess-ment of different cropping and manageassess-ment options can be performed to select the best one.
When adverse effect of weather on the already planted crops can not be avoided, it is very important to assess the impacts not only to farmers but also the society and the country. There are three steps of precaution on the possible adverse effect of weather on crops, those are warning, alert and alarm (Keane et al., 1998). Warning is issued when the adverse effect is small on limited area and alert when the effect is higher over a wider area. For a real-time coverage of wide areas the uses of external data such as radar and satellite imageries along with the data from observational networks are required for the assessment. Specific agro-meteorological conditions that alarming, term used when the possible impact on crop yield reduction is exceeding 20% over wide area of more than 10,000 km2 or yield reduction of more than 30% over 5,000 km2
Table 2. Alarming criteria for selected crop during different stage of growth
Crop/growth stage Temperature Rainfall/moisture Wind
Rice
Establishment ≤ 10○C, ≥35○C > 25 mm/d after sowing Vegetative ≤ 10○C, ≥ 27 night
≥ 32○C day
AE/PE < 0.3 for ≥ 30 day
Reproductive ≤ 10○C, ≥ 27 night ≥ 32○C day
continuous rain AE/PE < 0.3
≥6.7 m/
Ripening ≤ 13○C, ≥ 27 night ≥ 32○C day
continuous rain AE/PE < 0.3
≥6.7 m/
Harvest continuous rain
Wheat/barley
Establishment ≤ 3○C for ≥ 30 day from sowing
> 25 mm/day after sowing
Vegetative ≤-10○C for 10 day ≥ 100 day flooding
AE/PE < 0.3 for ≥ 30 day
Flowering ≥ 32○C for 1 day
≤-1○C for ≥ 2 day
3 mm/day continuous AE/PE < 0.3
≥6.7 m/s + 12 h rain
Ripening ≥25○C for ≥30 day
≤-8○C for ≥ 30 day
3 mm/day continuous AE/PE < 0.3
≥6.7 m/s + 12 h rain
Harvest 3 mm/day continuous
Potato
Planting/pre-establishment
<-5○C for 1 day < -1○C for 3 day
continuous rain 6 w < 2 mm/w for 6 w
Leaf/Tuber Growth <-5○C for 1 day < -1○C for 3 day
severe prolonged flooding or ≥ 30 day
Harvest <-5○C for1 day continuous rain for 30 day
Rapeseed
Pre-establishment ≥ 3.5 mm/day for 3 w
< 2 mm/w for 3 w Establishment ≤ 6○C for ≥ 30 day after
sowing
≥ 25 mm/day after sowing
Vegetative ≤-8○C for 10 day or ≤ -15○C for 3 day
≥ 50 day flooding AE/PE < 0.3
Flowering ≥ 3 mm/day continuous AE/PE
< 0.3
Ripening AE/PE < 0.3 6.7 m/s for 2 day
Harvest ≥ 30○C for> 10 day ≥ 3 mm/day 6.7 m/s for 10 day
for > 10 day
Sugar beet
Pre-establishment ≥3 mm/day for 40 d
<3 mm/day for 5 w
Establishment ≤-1○C for 3 day after sowing
≥ 25 mm/day after sowing ≥ 11.2 m/s for 1 day
Bulking AE/PE < 0.3 for ≥ 30 day
Harvest ≤-1○C for ≥ 5 day ≥3 mm/day continuous
RAINFALL FORECASTING
Amount and distribution of rainfall in the coming season are necessary for planning crop cultivation, particularly when climate anomaly arises. Based on long historical data the frequency and intensity of climate anomaly, is increasing recently both spatially and temporally. Climate anomaly has been and will be the main factor affecting agricultural productivity by the reducing cropped, harvested crop areas and yield. In Indonesia, climate anomaly triggered by ENSO and IODM (Indian Ocean Dipole Mode) (Kug et al., 2009) are the main factors affecting agricultural productivity and food security. The topography of an archipelago and interaction between land and sea also cause the high seasonal, intra seasonal and inter-annual climate variability.
Rainfall forecasting technique with Kalman Filtering
Rainfall is one of essential climate parameters that are dynamic, and stochastic in nature. Thus, it is necessary to quantify the total and distribution of rainfall to understand water availability for crops and then selecting the types of crops to plant. Currently, those
data are rarely available. Therefore, the condition of probable rainfall both spatially and temporally need to be quantitatively forecasted through updateable real time rainfall forecast with updating rainfall forecast technique. Indonesia Agroclimate and Hidrology Research Institute (IAHRI) has been developing rainfall forecasting technique with sea surface temperature Nino 3.4 as input data with Kalman Filtering. Kalman Filtering is combination of deterministic and stochastic models with approach to minimize of noise and able to do updating prediction immediately (on line forecasting) with actual data (Kalman, 1960). Accuracy of climate prediction model need to be improved through validation on some of climate condition and scenario to get suitability of model that are area and season specifics.
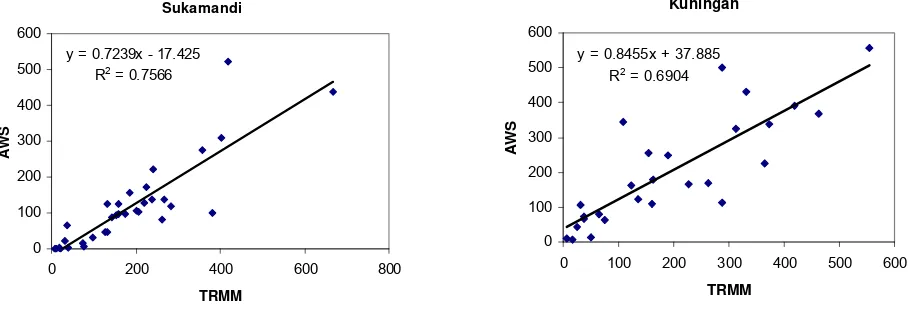
One important information from agroclimate research is climate prediction for the coming season (Figure 1). Collaborating with Indonesian Meteorological and Geophysical Agency, IAARD launched the climate seasonal prediction twice a year. For that purpose, IAHRI provides the climate data from authomatic weather station (AWS) for analyzing (Hadi et al., 2008). The main problems of this activity are often difficult to obtain the real time data from the fields observation. This is because many of
Sukamandi
the stations are distant away from IAHRI and occasionally due to the observation instrument malfunction.
Rainfall forecasting using genetic algorithm coupled with artificial neural network
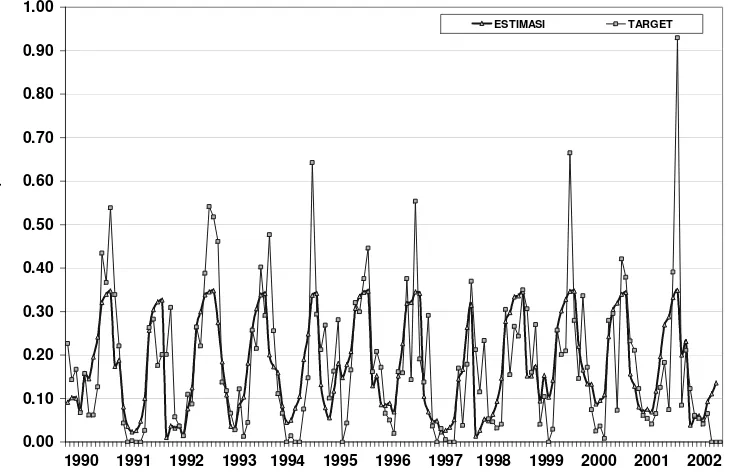
Rainfall forecasting plays many important role in water resources studies such as river training works and design of flood warning systems. Recent advance in artificial intelligence and in particular techniques aimed at converting input to output for highly nonlinear, non-convex and dimensionalized processes such as rainfall field, provide an alternative approach for developing rainfall forecasting model. Artificial neural networks (ANNs), which perform a nonlinear mapping between inputs and outputs, are such a technique (Figure 2 and 3). Current literatures on artificial neural networks show that the selection of network architecture and its efficient training procedure are major obstacles for their daily usage (Cybenco, 1989).
CROP SIMULATION
Today more than ever, increased food production depends on judicious use of resources. In addition, issues such as climate change (Kang et al., 2009), climate variability, soil carbon sequestration (Sanchez, 2000) and the long-term impact on food security (Masutomi et al., 2009) and environmental sustainability (Schafer and Kirchhof, 2000) have become important. Many weather, soil, genetic and management factors affect the way a crop will respond to irrigation, fertilizer and other management practices. Determining appropriate crop management strategies under these uncertainties has major economic and environmental implications.
Computer simulation models of the soil/ plant/atmosphere system can make a valuable contribution to both furthering our understanding of the processes that determine crop responses and predicting crop performance, resource use and environmental impacts for different environments and management scenarios.
0.00 0.10 0.20 0.30 0.40 0.50 0.60 0.70 0.80 0.90 1.00
1 1 1 1 1 1 1 1 1 1 1 1 1
NO
RM
ALIZE
D
M
O
NTHLY
R
A
INFALL
.
ESTIMASI TARGET
1990 1991 1992 1993 1994 1995 1996 1997 1998 1999 2000 2001 2002
Source : Pramudia (2008)
Figure 2. Development of ANN model
Normalize
d
monthly rai
n
Confalonieri et al. (2010) presented an application of Morris and Sobol sensitivity analysis techniques to the rice model WARM. The output considered is aboveground biomass at maturity, simulated at five rice districts of different countries for years characterized by low, intermediate, and high continentally. The importance of sensitivity analyses by exploring site and climate combinations is to evaluate novel crop-modeling approaches. User-oriented simulation models greatly facilitate the task of optimizing crop growth and deriving recommen-dations concerning crop management. They can also be used to determine the potential impact of climate change on crop production and long-term soil carbon sequestration, or provide
management scenarios for adapting to climate variability.
The decision support system for agro-technology transfer (DSSAT)
DSSAT is a microcomputer software product that combines crop, soil and weather data bases into standard formats for access by crop models and application programs. The user can then simulate multi-year outcomes of crop management strategies for different crops at any location in the world. DSSAT also provides for validation of crop model outputs; thus allowing users to compare simulated outcomes with observed results. The release of DSSAT
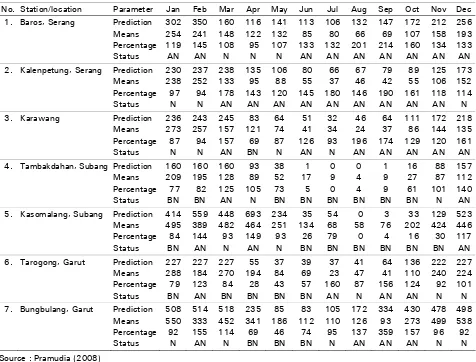
No. Station/location Parameter Jan Feb Mar Apr May Jun Jul Aug Sep Oct Nov Dec
1. Baros, Serang Prediction 302 350 160 116 141 113 106 132 147 172 212 256
Means 254 241 148 122 132 85 80 66 69 107 158 193
Percentage 119 145 108 95 107 133 132 201 214 160 134 133
Status AN AN N N N AN AN AN AN AN AN AN
2. Kalenpetung, Serang Prediction 230 237 238 135 106 80 66 67 79 89 125 173
Means 238 252 133 95 88 55 37 46 42 55 106 152
Percentage 97 94 178 143 120 145 180 146 190 161 118 114
Status N N AN AN AN AN AN AN AN AN AN N
3. Karawang Prediction 236 243 245 83 64 51 32 46 64 111 172 218
Means 273 257 157 121 74 41 34 24 37 86 144 135
Percentage 87 94 157 69 87 126 93 196 174 129 120 161
Status N N AN BN N AN N AN AN AN AN AN
4. Tambakdahan, Subang Prediction 160 160 160 93 38 1 0 0 1 16 88 157
Means 209 195 128 89 52 17 9 4 9 27 87 112
Percentage 77 82 125 105 73 5 0 4 9 61 101 140
Status BN BN AN N BN BN BN BN BN BN N AN
5. Kasomalang, Subang Prediction 414 559 448 693 234 35 54 0 3 33 129 523
Means 495 389 482 464 251 134 68 58 76 202 424 446
Percentage 84 144 93 149 93 26 79 0 4 16 30 117
Status BN AN N AN N BN BN BN BN BN BN AN
6. Tarogong, Garut Prediction 227 227 227 55 37 39 37 41 64 136 222 227
Means 288 184 270 194 84 69 23 47 41 110 240 224
Percentage 79 123 84 28 43 57 160 87 156 124 92 101
Status BN AN BN BN BN BN AN N AN AN N N
7. Bungbulang, Garut Prediction 508 514 518 235 85 83 105 172 334 430 478 498
Means 550 333 452 341 186 112 110 126 93 273 499 538
Percentage 92 155 114 69 46 74 95 137 359 157 96 92
Status N AN N BN BN BN N AN AN AN N N
Source : Pramudia (2008)
Remarks : AN = Rainfall is under Above Normal Condition (CH ≥ 115% of means)
N = Rainfall is under Normal Condition (CH < 115% of means)
BN = Rainfall is under Below Normal Condition (CH ≤ 115% of means)
Version 4 (Hoogenboom et al., 2004) incorporates changes to both the structure of the crop models and the interface to the models and associated analysis and utility programs. The DSSAT package incorporates models of 27 different crops with new tools that facilitate the creation and management of experimental, soil, and weather data files. DSSAT v4 includes improved application programs for seasonal and sequence analyses that assess the economic risks and environmental impacts associated with irrigation, fertilizer and nutrient management, climate change, soil carbon sequestration, climate variability and precision management.
In implementation in the field, this model is a useful decision support system to help farmers to optimally schedule and manage irrigation (Timsina et al., 2008). However, performing these analyses requires having access to large numbers of treatments and environment combinations (White et al.,2007).
Water agroclimate research management ver 2.0
This water balance analysis software was created since 2004 by integrated with the IAHRI Climate Database System (Runtunuwu et al., 2005, 2007), Figure 4. This software used not only the IAHRI climate data, but also field soil
and vegetation data. The main objective of this software was to assist users to analyze water balance in order to (a) evaluate crop system, (b) determine irrigation scenario, and (c) identify length growth period. Runtunuwu et al. (2009) noted that this model could estimate the paddy yield as 60% compare to obserbed data, since this model has not completed with irigarion data yet.
Cropping calendar atlas of Java Island
To assist farmers in adjusting cropping pattern and planting time, the IAARD has delineated new cropping calendar maps based on present status, wet, dry and normal years (Las et al., 2007; IAARD, 2008). The maps provide information on cropping pattern and planting time for annual crops, particularly rice based on dynamics of climate change and water resources. There are several expediencies of cropping calendar atlas: (1) providing spatial and tabular cropping pattern at the sub-district level, (2) determining cropping rotation in each sub-district based on the existing climate and water resources, (3) supporting the planning of cropping season and pattern, especially for seasonal food crops, and (4) reducing the negative impact of climate anomaly and risk of farmer's losses. The IAHRI CDS has provides all the climate data to produce this atlas.
Source : Runtunuwu et al. (2007)
CONCLUSION
Rainfall is the main source of water for the agricultural. Accurate measurement and fore-casting of the spatial and temporal distribution of rainfall is important for food security issue. The forecasting technologies and the devices used as a tool in this forecasting developed very much in the recent years. As a result of this development, quantitative rainfall forecasting, such as numerical weather prediction, becomes as main input in crop simulation, especially for water and agro-climate management and cropping calendar. However, the improvement of the climate forecasting quality and its relationship with crop productivity simulation is imperatived.
REFERENCES
Amien, L.I. 2004. Strengthenin Operational Agrometeorological Services: Needs from Agricultural Sector: Current and Potential Functions of National Agrometeorological Services: The Agricultural Demand Side. Proceedings of the Inter-Regional Workshop, March 22-26, 2004, Manila, Philippines. Technical Bulletin WAOB-2006-1 and AGM-9, WMO/TD. Pp 156-170.
Amien, I. 2005. Predicting rice yield using meteorological variables. Buletin Hasil Penelitian Agroklimat dan Hidrologi Vol 2(2)1-8.
Benhin, J.K.A. 2008. South African crop farming and climate change: An economic assessment of impacts. Global Environmental Change 18(4):666-678. Boken, V.K. 2009. Improving a drought early
warning model for an arid region using a soil-moisture index. Applied Geography, 29(3):402-408.
Cybenko, G.V. 1989. Approximation by Superpositions of a Sigmoidal function, Mathematics of Control, Signals and Systems 2:303-314.
Confalonieri, R., G. Bellocchi, S. Tarantola, M. Acutis, M. Donatelli, and G. Genovese. 2010. Sensitivity analysis of the rice model WARM in Europe: Exploring the effects of different locations, climates and methods of analysis on model sensitivity to crop parameters. Environ-mental Modelling & Software, 25(4): 479-488. (in press).
Gerstner, E.M. and G. Heinemann. 2008. Real-time areal precipitation determination from radar by means of statistical objective analysis. Journal of Hydrology, 352(3-4):296-308.
Hadi, T.W., M.A. Ratag, E. Aldrian, W. Estiningtyas, E. Surmaini, N. Joko, D. Permana, dan F. Ramadhani. 2008. Pengembangan model prediksi musim (seasonal) untuk mendukung kegiatan pertanian yang adaptif terhadap perubahan iklim. Laporan akhir Penelitian. Balai Besar Penelitian dan Pengembangan Sumberdaya Lahan Pertanian. Bogor. Hough, M.N. 1998. Examples of alarms
situation from the UK. In Agro-meteorological Applications for Regional Crop Monitoring and Production Assessment. Joint Research Centre. European Commission. Ispra, Italy.
IAARD. 2008. Cropping calendar for food crops. IAARD, Ministry of Agriculture. Jakarta. 2008. P 50.
Kalman, R.E. 1960. A new approach to linear filtering and prediction problems. Journal of Basic Engineering 82(1):35-45.
Kang, Y., S. Khan, and X. Ma. 2009. Climate change impacts on crop yield, crop water productivity and food security – A review. Progress in Natural Science, 19(12)1665-1674.
Keane, T., G. Russell, M.N. Hough, and D. Rijks. 1998. Alarms. In Agro-meteorological Applications for Regional Crop Monitoring and Production Assessment. Joint Research Centre. European Commission. Ispra, Italy.
Kug, J.S., K.P. Sooraj, Fei-Fei Jin, Jing-Jia Luo, and Minho Kwon. 2009. Impact of Indian Ocean Dipole on high-frequency atmospheric variability over the Indian Ocean Atmospheric Research 94(1):134-139.
Las, I.. A. Unadi, K. Subagyono, H. Syahbuddin, dan E. Runtunuwu. 2007. Atlas Kalender Tanam Pulau Jawa. Skala 1:1.000.000 dan 1:250.000. Balai Penelitian Agroklimat dan Hidrologi. Hlm. 96.
Masutomi, Y., K. Takahashi, H. Harasawa, and Y. Matsuoka. 2009. Impact assessment of climate change on rice production in Asia in comprehensive consideration of process/parameter uncertainty in general circulation models. Agriculture, Ecosystems & Environment 131(3-4): 281-291.
Minnettand, P.J. and I.J. Barton. 2010. Experimental Methods in the Physical Sciences. In Remote Sensing of the Earth's Surface Temperature 43:333-391. (in press)
Pramudia, A. 2008. Pewilayahan Hujan dan Model Prediksi Curah Hujan untuk Mendukung Analisis Ketersediaan dan Kerentanan Pangan di Sentra Produksi Padi. Tesis S3. Sekolah Pasca-sarjana. Institut Pertanian Bogor.
Runtunuwu, E., E. Surmaini, W. Estiningtyas, dan Suciantini. 2005. Sistem Basis Data Sumberdaya Iklim dan Air. Buku Sistem Informasi Sumberdaya Iklim dan Air. Balai Penelitian Agroklimat dan Hidrologi. Bogor. Hlm. 39-54.
Runtunuwu, E., H. Syahbuddin, B. Kartiwa, dan K. Sari. 2007. Pemutakhiran dan Pendayagunaan Sistem Informasi Sumberdaya Iklim dan Air Nasional untuk Perencanaan Pertanian. Laporan Akhir. Balai Penelitian Agroklimat dan Hidrologi. Bogor.
Runtunuwu E., K. Sari, N. Pujilestari, dan F. Ramadhani. 2009. Pendugaan Hasil Tanaman Menggunakan Model Water and Agroclimate Resources Management (WARM). Dipresentasikan pada Seminar dan Lokakarya Nasional Inovasi Sumberdaya Lahan “Inovasi Teknologi Sumberdaya Lahan Mendukung Sistem Pertanian Industrial”. Bogor, 24-25 November 2009.
Sanchez, P.A. 2000. Linking climate change research with food security and poverty reduction in the tropics. Agriculture, Ecosystems & Environment 82(1-3): 371-383.
Schafer, B.M. and G. Kirchhof. 2000. The soil and climate characterisation of benchmark sites for lowland rice-based cropping systems research in the Philippines and Indonesia. Soil and Tillage Research 56(1-2):15-35.
productivity of wheat in Punjab, India using the DSSAT-CSM-CERES-Wheat model. Agricultural Water Management 95(9):1099-1110.
Unninayar, S. and L. Olsen. 2008. Monitoring, Observations, and Remote Sensing. In Global Dimensions. Encyclopedia of Ecology, Pp 2425-2446.
Varella, H., M. Guérif, and S. Buis. 2010. Global sensitivity analysis measures the quality of parameter estimation: The case of soil parameters and a crop model. Environmental Modelling & Software 25(3):310-319. (in press).