CHAPTER III
RESEARCH METHODOLOGY
This chapter covers six elements of research plans, they are : (1) Research Design, (2) Research Site and Access, (3) Population and Sample, (4) Technique of Data Collection, (5) Reliabilities, and (6) Data Analysis. Each of these points will be explained in the following :
3.1. Research Design
Quantitative design is applied in this research with survey approches. Survey ischosen because this research was investigated students’ perception towards small group interaction in fifth semester. Keeves (1990, p.107) as cited by Triyani (2012:16) stated that survey research in education involves the collection of information from group of teachers, students, or other person related to the educational process, and the analysis of the information to explain the educational issues. In other word, survey research is a research method that involves the use of questionnaire and/or statistical survey to collect the data about people and their thought and also their behaviors.
3.2 Research Site and Access
study in Jambi University. It make the researcher easier to get permission for gathering information and collecting the data from the campus.
3.3. Population and Sample 3.3.1 Population
According to Salkind (1994:80) as cited by Triyani (2012:01) “a
population is a group of potensial participants to whom researcher wants to generalize the results of a study”. Therefore, the population of this research was the students of fifth semester of English Department in Jambi University..
At the time of the study, English program study in fifth semester of Jambi University were involve the participants who have different background and experience in learning with small group method.
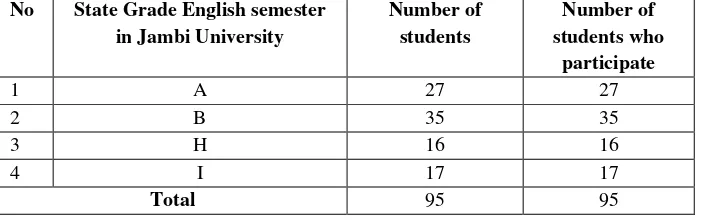
Based on observation in the field, were four class of fifth semester were eighty nine students. A shown in the following the table:
Table 1. List of number of Studentsin English program study in fifth semester of Jambi University:
No State Grade English semester in Jambi University
Number of students
Number of students who
participate
1 A 27 27
2 B 35 35
3 H 16 16
4 I 17 17
3.3.2 Sample
According to Arikunto (2006: 131), sample is part respondent of population will be investigated. Creswell (1994:401) in Triyani (2012:18) explains that sample is the group of participants in a study selected from the population which the researcher generalizes to the population. The sample of this research was taken by using total sampling technique that all of subjects in population were sample, account of sample in this research are.
3.4 Technique of Data Collection
Data collection is a series of activities that relate to each other purposed to answer emerging research question by gathering good information (Creswell, 1998). In this research, the researcher use one instrument that was questionnaire. Thereare some stages that the researcherto collecting the data:
1. Permission
Before collecting the data from that class, the researcher ask permission from that the lecture after their finish learning activity.
2. Distributing the Questionnaire
were commended to submit the questionnaire as well as they finished filling.
3.4.1 Instrument
The instrument in this reasearch is questionnaire. In collecting data, the research distribute questionnaire to the participants four class in fifth semester of English program study of Jambi University to be filled by them.
All statements in the questionnaire adopted from Graziani, Glashan, and Wade. Kouros&Abrami. Centre Study of Learning and Performance Concordia University, Montreal, Canada (2006) about how do students really feel about
working in small groups? The role of students’ attitude and behaviors in small
group setting.
Close ended questionnaire will be as the instruments to be easier in collecting data. Likert Scale was used in formulating the close questionnaire, which were only five possible answers to each question. Close ended
questionnaire for students’ perception use five choices, namely ‘strongly
disgree,’ ‘disagree,’ ‘neutral,’ ‘agree,’ and ‘strongly agree’.
The questionnaire consists of 22 statements which is divided into indicators. 3 statements is advantages of student time in small group, 3 statements about advantages of material in small group, and 5 statements about advantages of student attitude in small group. 3 statements question about disadvantages of
small group, and 5 statements are questions about disadvantages students’ attitude in small group, and the table below presents the specification of the questionnaire.
Table 1.2 the specifications of question sheet
Research
Johnson and Christensen (2008, p.144) stated that reliability refers to the stability or consistency of a set of test scores.
different reasons. There were 2 students from A class, there were 1 student from Band there were 2 students from H class, there were 1 student from I class. The total participants from three classes were89 students.
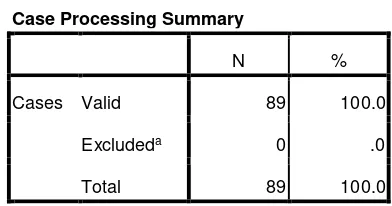
After getting the data, the reliability of students’ answers was calculated by inputting data into SPSS 16. On the basis of calculation, it was found that the frequency of reliability is .719. It can be concluded that the questionnaire is reliable for standard of students’ respond to the questionnaire.
Table 1.3 the result from my research Reliability
Case Processing Summary
N %
Cases Valid 89 100.0
Excludeda 0 .0
Total 89 100.0
a. Listwise deletion based on all variables in
the procedure.
Reliability Statistics
Cronbach's
Alpha N of Items
Researcher used interpretation of mean score to interprete the students’
answers from questionnaire.
Mean Interpretation
1.00 to 1.75 Very low/strength Negative’s disagree 1.76 to 2.50 Low/negative Disagree
2.51 to 3,25 High/positive Agree
3.26 to 4,00 V. High Strongly positives’s Agree
The validity of the questionnaire is already valid, because the questionnaire was tested before by the previous researcher that has a research in the same field. The researcher adopts the questionnaire and used it to the participants.
3.5 Technique of Data Analysis
After collecting the data through questionnaire, the researcher then analyze the data with the analysis of numerical datathat is descriptive statistics by using SPSS. Johnson and Christensen (2008) stated “the descriptive statistics has goal to
describe, summarize, explain data, or make sense of a particular set of data” (p.
464), based on the steps below:
1. Data managing
It involved organizing and checking the data collected during the
research for completeness. The researcher wrote participants’s number on
2. Reading/Memoing
The researcher read all questionnaires and writes a note when found out misunderstanding answer in open ended questionnaire. The researcher arraign the students’ reasons in open questionnaire to get the points in
each students’ judgments.
3. Classifying
Researcher categorized the data. First, the researcher determined
frequency and percentage of the participants’ choices. The researcher used
the formula of SPSS for the items of close ended questionnaire, as follow:
a. Frequency and Percentage :
The researcher saw the frequency by describing them in frequency distribution. A frequency distribution was a systematic arrangement of data values in which the data were rank and the frequencies of data value were shown (Johnson and Christensen, 2008). So, frequency here means
as the unique number of students’ answers and shown in the table.
b. Mean and Standard Deviation :
The mean was the arithmetic average, or people called as the average. So in this research, researcher found the mean of students’
answer for each students’perception toward small group interaction.
Johnson and Christensen (2008) defined Standard Deviation as an approximate indicator of how far the numbers tend to vary from the mean. Standard deviation was calculated as the square root of variance.
4. Describing
The researcher describes all the data from questionnaire in a table as the result.
5. Interpreting