Indones Biomed J. 2018; 10(2): 184-91 DOI: 10.18585/inabj.v10i2.397
R E S E A R C H A R T I C L E
Anthropometry-based Body Fat Percentage Predicts High hs-CRP in
Chronic Kidney Disease Patients
Mochammad Thaha
1,2, Maulana Antiyan Empitu
3,, Ika Nindya Kadariswantiningsih
4,
Cahyo Wibisono Nugroho
1,2,Nurina Hasanatuludhhiyah
3, Haerani Rasyid
5, Zaky El Hakim
6,
Maulana Muhtadin Suryansyah
6, Rieza Rizqi Alda
6, Mohammad Yusuf Alsagaff
7,8,
Mochammad Amin
9, Djoko Santoso
1, Yusuke Suzuki
101Department of Internal Medicine, Faculty of Medicine, Universitas Airlangga, Jl. Mayjen Prof. Dr. Moestopo 47, Surabaya, Indonesia 2Department of Internal Medicine, Universitas Airlangga Hospital, Jl. Mulyorejo, Surabaya, Indonesia
3Department of Pharmacology and Therapeutics, Faculty of Medicine, Universitas Airlangga, Jl. Mayjen Prof. Dr. Moestopo 47, Surabaya, Indonesia 4Department of Medical Microbiology, Faculty of Medicine, Universitas Airlangga, Jl. Mayjen Prof. Dr. Moestopo 47, Surabaya, Indonesia
5Department of Internal Medicine, Faculty of Medicine, Universitas Hasanudin, Jl. Perintis Kemerdekaan Km. 10, Makassar, Indonesia 6Medical Science Program, Faculty of Medicine, Universitas Airlangga, Jl. Mayjen Prof. Dr. Moestopo 47, Surabaya, Indonesia
7Department of Cardiology and Vascular Medicine, Faculty of Medicine, Universitas Airlangga, Jl. Mayjen Prof. Dr. Moestopo 47, Surabaya, Indonesia 8Department of Cardiology and Vascular Medicine, Universitas Airlangga Hospital, Jl. Mulyorejo, Surabaya, Indonesia
9Institute of Tropical Disease, Universitas Airlangga, Jl. Mulyorejo, Surabaya, Indonesia
10Department of Nephrology, Juntendo University Faculty of Medicine, 2-1-1 Hongo Bunkyo-ku, Tokyo, Japan
Corresponding author. E-mail: [email protected]
Received date: Oct 20, 2017; Revised date: May 29, 2018; Accepted date: June 5, 2018
B
ACKGROUND: Obesity is an importantcardiovascular risk factor and associated with
low grade inflammation in chronic kidney disease
(CKD) patients. This study aims to assess the association between body fat with serum high sensitivity C-reactive protein (hs-CRP) level in CKD patients.
METHODS: A cross-sectional study was performed in 71 CKD patients. Anthropometric measurements included body weight, height, body mass index (BMI), body fat percentage (BFP), skinfold thickness (SKF) of triceps and biceps were performed by trained physician. BFP was calculated using Kwok’s Formula and hs-CRP was measured by Particle enhanced Turbidimetry.
RESULTS: The averaged BMI of our subjects was
25.8±4.4. There was no significant difference in BMI
between pre-dialysis and hemodialysis CKD patients. Positive correlation was found between BFP and hs-CRP (r=0.266; p<0.05), while there was no significant correlation
between BMI and hs-CRP.
CONCLUSION: Body fat percentage was associated
with hs-CRP. Hence, it will be more beneficial to assess
nutritional status in CKD using BFP rather than BMI alone since it was demonstrated to correlate with hs-CRP in our study.
KEywORDS: CKD, obesity, inflammation, body fat,
hs-CRP
Indones Biomed J. 2018; 10(2): 184-91
Abstract
Introduction
In last decades, chronic kidney disease (CKD) has been one of the global health problems with high morbidity and mortality rates. The prevalence of CKD in United States was
Obesity is an important CKD risk factor with high prevalence in general population.(4,5). Study by Kelly, et al., estimated 937 million or 23.2% of the world’s adult population was overweight and 396 million (9.8%) was obese.(6,7) They also projected the absolute numbers of overweight and obese individuals in 2030 will increase to be 2.16 billion and 1.12 billion, respectivley.(7) In 2010, overweight and obesity were estimated to cause 3.4 million deaths, 3.9 % of years of life lost, and 3.8 % of disability-adjusted life-years (DALYs) worldwide.(8) Available data show that the most dramatic increases in obesity are in developing countries such as Mexico, China, and Thailand.(9,10)
Inflammation is considered as one of the key elements
in almost all of kidney diseases. In CKD, particularly in patients with end-stage renal disease (ESRD), prevalence
of chronic low-grade inflammation is quite high. One of the potential causes of low-grade inflammation in CKD
patients is excess of adipose tissue. Recently, adipose tissue is considered as an endocrine organ and major
site that plays important role for inflammatory and
metabolic pathways.(11) The adipose tissue is a complex organ with functions other than energy storage, and secretes
several adipokines, such as tumor necrosis factor (TNF)-α,
interleukin (IL)-6, type 1 plasminogen activator inhibitor (PAI-1), C-reactive Protein (CRP), resistin, and acylation-stimulating protein.(12) In the human body, the major fat deposit sites are subcutaneous fat and visceral abdominal fat. Both of the fat deposit sites stated previously are
associated with insulin resistance and pro inflammation in
obese subjects.(11)
Excess of adipose tissue and chronic inflammation
are associated with early pathogenesis of kidney injury,
such as glomerular hyperfiltration. Moreover, a harmful renal hemodynamic profile is also linked to obesity
both in patients with ESRD and general population. Patients with advanced CKD had increased expression of
pro-inflammatory genes in their subcutaneous abdominal fat.
This provides evidence that obesity in CKD also associated
with inflammation at the cellular level.(13) Positive
association also found between total body fat, abdominal
body fat, and markers of inflammation not only in general
population but also in CKD patients.(11,12)
High-sensitivity CRP (hs-CRP) is a most frequently
used marker of inflammation. CRP does not show a significant circadian variability in stable condition, and
its stability in laboratory measurements is comparable to serum cholesterol levels. This biomarker also associated with higher risk of cardiovascular events and mortality.
Methods
Study Design and Population Selection
This was an analytic observational study using cross-sectional design. Ninety patients from outpatient clinics and hemodialysis (HD) units at two government and a private hospitals in Surabaya and Makasar were recruited from May to July 2017. This study was approved by Ethical Committee & Law of Universitas Airlangga Hospital with No. 093/KEH/2017.
Seventy three patients were diagnosed with CKD.
Seventy one patients were qualified to participate in
this study since 2 patients were excluded due to acute
inflammatory conditions. The inclusion criteria were adult
CKD patients, aged >21 years old and agreed to participate
in this study. The diagnosis of CKD was confirmed by
National Kidney Foundation Kidney Disease Outcomes Quality Initiative (NKF K-DOQI) criteria based on Chronic Kidney Disease Epidemiology Collaboration (CKD-EPI)
equation (estimated glomerular filtration rate (eGFR) ≤60
mL/min/1.73 m2, urine albumin >300 mg/day, albumin to
creatinine ratio (ACR) >250 mg/g for men and >355 mg/g for women). Exclusion criteria were overt infection, fever
in the last 3 days, signs of infection, acute inflammatory
disease and malignancy.
Anthropometric Measurement
Anthropometric measurements, included body weight, height, BMI, BFP, skinfold thickness (SKF) of triceps and biceps were performed by trained physician. Body weight was measured to the nearest 0.1 kg in balance-beam scale. Height was measured to the nearest 0.5 cm while patients standing erect with their head in plane. BMI was calculated using formula of body weight (kg) divided by square of height (m2). SKF was measured using Lange
skinfold caliper on the left arm or on the arm contrary to
arteriovenous fistule for patients underwent hemodialysis.
BFP was calculated using Kwok’s Formula:
(14,15,16) The objective of this study was to assess the association between body fat percentage (BFP) with serum hs-CRP level in CKD patients. This study compared the ability of BFP with widely used body mass index (BMI) to predict the value of serum hs-CRP in CKD patients.
Considering these findings that link body fat with the presence of inflammation, we hypothesized that higher
Indones Biomed J. 2018; 10(2): 184-91 DOI: 10.18585/inabj.v10i2.397
BFP = -27.149 + 6.137(SexB) + 1.120(BMI) + 17.308 log10(Sum 2).
Notes: SexB, female=2, male=1; Sum 2, triceps + biceps.(17)
Laboratory Parameters
Blood and urine samples were collected early in the morning. Measurement of kidney function parameters
(estimated glomerular filtration rate (eGFR), urine ACR,
serum creatinine, serum cystatin-C) were performed using routine laboratory methods. High-sensitivity CRP was measured by Particle enhanced Turbidimetry (Roche Diagnostic, California, USA)
Statistical Analysis
Normality test was performed using Shapiro Wilk. For normally distributed variables, data were shown as mean±SD. For skewed variables, data were shown as median and interquartile range (1st quartile-3rd quartile). Correlation between variables was performed using Pearson correlation test. Receiver operating characteristic (ROC) curve were plotted using absolute value of BFP and hs-CRP value (high hs-CRP >3 mg/L). Optimal cut-off
was defined as BFP value with highest cumulative value of sensitivity and specificity.
All testing were two-tailed at the 0.05 significance
level. The statistical analyses were performed using XLSTAT software version 2016.02.28451.
Results
Characteristic of Study Participants
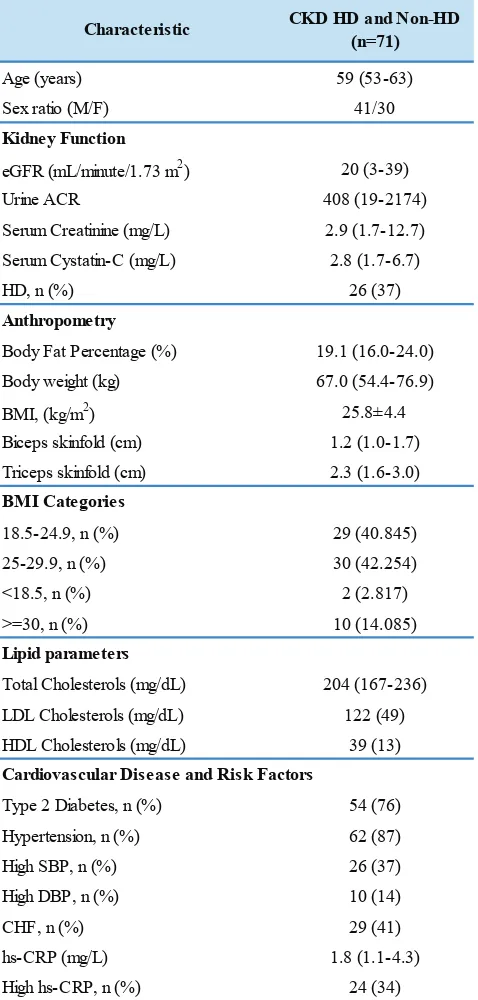
Seventy one patients were evaluated in this study (median age 59, 41 male). The baseline characteristics of study participants were depicted in Table 1. The median of
eGFR was 20 mL/minute/1.73 m2. From anthropometric
data, it was shown that the averaged BMI of our subjects was 25.8±4.4. Overweight and obesity prevalence were 42% and 14% respectively. Only 2 (3%) subjects were undernourished. The majority of subjects had some cardiometabolic diseases, such as 73% have type 2 diabetes mellitus, 87% percents have hypertension and 41% have congestive heart failure (CHF).
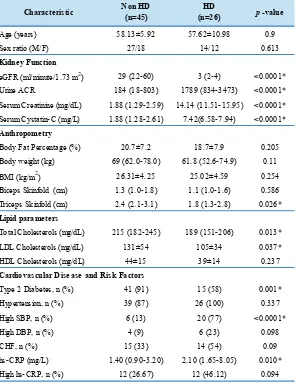
Comparison of Characteristic between Non-HD and HD Patients
The comparison between non-HD and HD patients characteristic was depicted in Table 2. There were no
significant differences in age and sex ratio between non-HD and non-HD patients. There were significant differences
Characteristic CKD HD and Non-HD
(n=71)
Age (years) 59 (53-63)
Sex ratio (M/F) 41/30
eGFR (mL/minute/1.73 m2) 20 (3-39)
Urine ACR 408 (19-2174)
Serum Creatinine (mg/L) 2.9 (1.7-12.7)
Serum Cystatin-C (mg/L) 2.8 (1.7-6.7)
HD, n (%) 26 (37)
Body Fat Percentage (%) 19.1 (16.0-24.0)
Body weight (kg) 67.0 (54.4-76.9)
BMI, (kg/m2) 25.8±4.4
Biceps skinfold (cm) 1.2 (1.0-1.7)
Triceps skinfold (cm) 2.3 (1.6-3.0)
18.5-24.9, n (%) 29 (40.845)
25-29.9, n (%) 30 (42.254)
<18.5, n (%) 2 (2.817)
>=30, n (%) 10 (14.085)
Total Cholesterols (mg/dL) 204 (167-236)
LDL Cholesterols (mg/dL) 122 (49)
HDL Cholesterols (mg/dL) 39 (13)
Type 2 Diabetes, n (%) 54 (76)
Hypertension, n (%) 62 (87)
High SBP, n (%) 26 (37)
Cardiovascular Disease and Risk Factors BMI Categories
Table 1. Characteristics of study participants.
in kidney function parameters for eGFR, urine ACR,
serum creatinine, serum cystatin-C between two groups.
Those were, eGFR (<0.0001), urine ACR (<0.0001),
serum creatinine (<0.0001), serum cystatin-C (<0.0001). Anthropometry measurement results mostly demostrated no
significant differences. Those were for body fat percentage,
body weight, BMI, and biceps skinfold. However, triceps
skinfold of HD patients was significantly lower than non-HD
patients (p<0.05). Our study showed that the HD patients
had significantly higher hs-CRP level than non-HD patients
Characteristic Non HD (n=45)
HD
(n=26) p-value
Age (years) 58.13±5.92 57.62±10.98 0.9
Sex ratio (M/F) 27/18 14/12 0.613
eGFR (ml/minute/1.73 m2) 29 (22-60) 3 (2-4) <0.0001*
Urine ACR 184 (18-803) 1789 (834-3473) <0.0001*
Serum Creatinine (mg/dL) 1.88 (1.29-2.59) 14.14 (11.51-15.95) <0.0001*
Serum Cystatin-C (mg/L) 1.88 (1.28-2.61) 7.42(6.58-7.94) <0.0001*
Body Fat Percentage (%) 20.7±7.2 18.7±7.9 0.205
Body weight (kg) 69 (62.0-78.0) 61.8 (52.6-74.9) 0.11
BMI (kg/m2) 26.31±4.25 25.02±4.59 0.254
Biceps Skinfold (cm) 1.3 (1.0-1.8) 1.1 (1.0-1.6) 0.586
Triceps Skinfold (cm) 2.4 (2.1-3.1) 1.8 (1.3-2.8) 0.026*
Total Cholesterols (mg/dL) 215 (182-245) 189 (151-206) 0.013*
LDL Cholesterols (mg/dL) 131±54 105±34 0.037*
HDL Cholesterols (mg/dL) 44±15 39±14 0.237
Type 2 Diabetes, n (%) 41 (91) 15 (58) 0.001*
Hypertension, n (%) 39 (87) 26 (100) 0.337
High SBP, n (%) 6 (13) 20 (77) <0.0001*
High DBP, n (%) 4 (9) 6 (23) 0.098
CHF, n (%) 15 (33) 14 (54) 0.09
hs-CRP (mg/L) 1.40 (0.90-3.20) 2.10 (1.65-8.05) 0.010*
High hs-CRP, n (%) 12 (26.67) 12 (46.12) 0.094
* : significant correlation Kidney Function
Anthropometry
Lipid parameters
Cardiovascular Disease and Risk Factors
Table 2. Comparison of characteristic between non-HD and HD patients.
p-value Correlation
Coefficient p-value
Correlation Coefficient
BFP 0.025* 0.266 0.006* 0.324
BMI 0.448 0.092 0.117 0.188
Total Cholesterol 0.129 0.182 0.728 0.042
LDL Cholesterol 0.099 -0.197 0.117 -0.188
HDL Cholesterol 0.004* -0.341 0.001* -0.378
Ratio of Total/HDL Cholesterol <0.0001* 0.637 0.004* 0.339
* : significant correlation
hs-CRP log hs-CRP
Parameters
Table 3. Pearson’s matrix of association between BFP and hs-CRP.
proportion of patients with high hs-CRP between non-HD and HD patients.
hs-CRP Concentration in CKD Patients
Positive correlation was found between BFP and hs-CRP (r= 0.266; p<0.05) as shown in Table 3. However there was
no significant correlation between BMI and hs-CRP.
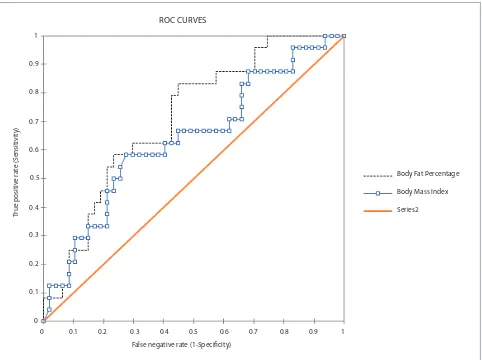
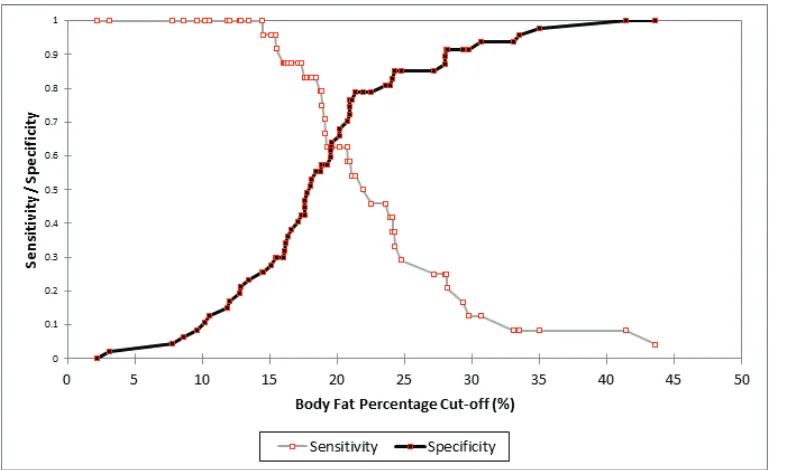
Comparison for BMI and BFP to Predict High hs-CRP
BFP and BMI may predict inflammation in our CKD
patients with cut off point 18.4% (Figure 1, Figure 2). The BFP value above 18.4% were positively associated with
high hs-CRP, indicated by significant crude and adjusted
odd ratio (OR) (4.705 and 5.056 respectively). The crude
Indones Biomed J. 2018; 10(2): 184-91 DOI: 10.18585/inabj.v10i2.397
Body Fat Percentage
Body Mass Index
Series2
ROC CURVES
0 0.1 0.2 0.3 0.4 0.5 0.6 0.7 0.8 0.9 1
False negative rate (1-Specificity) 0
0.1 0.2 0.3 0.4 0.5 0.6 0.7 0.8 0.9 1
True positiv
e r
a
te (S
ensitivit
y)
Figure 1. ROC curve of BFP and BMI to predict high hs-CRP (p-value= 0.001).
Discussion
Since there were no significant differences in age, sex,
BMI, BFP, and the prevalence of high hs-CRP between non-HD and HD groups, we combined HD and non-HD
groups in the sensitivity and specificity analysis of BFP and
BMI to predict high hs-CPR. In this observational study, we demonstrated positive correlation between BFP and hs-CRP in CKD populations.
CRP is an established marker of systemic
inflammation in the general population as well as patients with CKD. Inflammation plays fundamental role in
pathophysiology of CKD and has beed linked with cardiovascular disease, protein energy wasting and
mortality in CKD patients.(18) Our study showed that the HD
patients group with significantly lower kidney function had significantly higher hs-CRP level than the non HD patients.
Several studies has shown predictive values of hs-CRP in CKD. Persistently elevated hs-CRP level is associated with all cause mortality in ESRD. It is also considered as a predictor for malnutrition and cardiovascular disease in hemodialysis patients.(14)
The most prevalent nutritional status in our study was
overweight (BMI 25-29.9). This was in line with the finding
of a large cohort study conducted by Herrington, et al., which concluded that BMI >25 kg/m2 was associated with
a progressively increased risk of CKD stages 4-5.(19) Prior studies also found high prevalence of overweight and obesity in predialysis and CKD patients.(20,21) However, our study could not show correlation between BMI and hs-CRP level. Several literatures have stated that BMI is less than ideal metric for obesity in CKD population.(22) Others
also highlight the limitations of BMI as a reflection of body It remained significant after adjusted by age (3.487). The
Figure 2. Sensitivity and
specificity of body fat
percentage for predicting high hs-CRP.
Test Value CI 95% Test Value CI 95%
AUC 0.71 (0.592-0.828) 0.637 0.501-0.774
Sensitivity 0.833 (0.634-0.938) 0.583 0.388-0.755
Specificity 0.553 (0.412-0.686) 0.723 0.581-0.831
Odds Ratio (Unadjusted) 4.705 (1.560-14.192) 3.447 1.247-9.530
Odds Ratio (Adjusted by Age) 5.056 (4.343-5.885) 3.487 3.046-3.992
BFP BMI
Table 4. AUC, specificity, sensitivity, and OR (CI 95%) of high hs-CRP value using BFP’s optimal cut-off 18.4% and BMI cut-off 27.3 kg/m2.
composition (21), since it is unable to discriminate fat and muscle mass as well as hydration status which often alter in CKD patients.(23,24) Therefore we also included BFP as anthropometric parameter other than BMI.
The correlation between BFP and hs-CRP in this study was concordance with previous study which demonstrate association between CRP and BFP measured by bioimpedance method in non dialysis stage 3-5 CKD
patients. Inflammatory cytokines in CKD are produced not
only by lymphocytes, but also by adipose tissue, which becomes dysfunctional in CKD (25) characterized by increased hs-CRP production (26). Additionally, this study observed that the hs-CRP also correlate negatively with HDL cholesterol and positively with total/HDL cholesterol ratio. Some previous extensive studies have shown that the impaired cholesterol metabolism was strongly correlated
with increased inflammatory state in CKD patients.(27) The cholesterol profile was also correlated well with BMI
and BFP, although not at the same degree of association compared to triglycerides.(27) Therefore theoretically,
greater BFP and BMI would reflect as a higher cholesterol
levels. In this study, the total/HDL cholesterol ratio was the strongest factor associated with hs-CRP levels compared to others lipid parameters as well as anthropometric parameters. However, this study failed to observe the association between laboratory lipid parameters with either BMI and BFP (data not shown).
Indones Biomed J. 2018; 10(2): 184-91 DOI: 10.18585/inabj.v10i2.397
The finding of this study should be viewed with some
limitation. The small sample size of this study might not
reflect accurately the predictive ability of BFP and BMI to estimate the value of hs-CRP. Specificity of hs-CRP was considered to be low since many factors may influence its
measurement i.e., diabetes, infection, smoking, chronic diseases, sleep disorders, malnutrition, anemia, old age, alcohol consumption, CVD, hypertension, vascular access, pregnancy, pharmacological therapy, dialysis and CRP gene polymorphism, which this study did not estimate in the statistical analysis. Additionally, the relatively narrow range of BFP and BMI among the study participants may limit the ability of statistical analysis to generate prediction model for hs-CRP. Therefore, this study could demonstrate some degree of association between anthropometric-based BFP and hs-CRP but with poor correlation and predictive value. Another limitation regarding this study is its applicability aspect. The relatively poor correlation between BFP and
hs-CRP has limited the usability of the specificity, sensitivity,
and predictive value generated from this study in the daily clinical practice. However, the association of BFP and hs-CRP showed in this study might indicate a potential relationship between the two variables, particularly when a
significantly bigger sample size is introduced.
Conclusion
In overall, this study emphasized the need to regularly assess nutritional status in CKD using BFP rather than BMI alone since it demonstrated better association with hs-CRP in our study. It needs further study to evaluate larger and more heterogenous samples to explore malnutrition as a risk
factor for chronic inflammation as well as cardiovascular
complications in CKD patients.
References
1. Jha V, Garcia-Garcia G, Iseki K, Li Z, Naicker S, Plattner B, et al. Chronic kidney disease: global dimension and perspectives. Lancet. 2013; 382: 260-72.
2. Levin A, Tonelli M, Bonventre J, Coresh J, Donner JA, Fogo AB, et al. Global kidney health 2017 and beyond: a roadmap for closing
gaps in care, research, and policy. Lancet. 2017; 390: 1888-917.
3. Andrassy KM. Comments on'KDIGO 2012 clinical practice guideline
for the evaluation and management of chronic kidney disease'. Kidney Int. 2013; 84: 622-3.
4. Kovesdy CP, Furth S, Zoccali C. Obesity and kidney disease: hidden consequences of the epidemic. JEMDSA. 2017; 22: 5-11.
5. Ejerblad E, Fored CM, Lindblad P, Fryzek J, McLaughlin JK, Nyrén O. Obesity and risk for chronic renal failure. J Am Soc Nephrol. 2006; 17: 1695-702.
6. Arroyo-Johnson C, Mincey KD. Obesity Epidemiology Worldwide.
Gastroenterol Clin North Am. 2016; 45: 571-9.
7. Kelly T, Yang W, Chen C, Reynolds K, He J. Global burden of obesity
in 2005 and projections to 2030. Int J Obes. 2008; 32: 1431-7.
8. Ng M, Fleming T, Robinson M, Thomson B, Graetz N, Margono
C, et al. Global, regional, and national prevalence of overweight
and obesity in children and adults during 1980–2013: a systematic
analysis for the Global Burden of Disease Study 2013. Lancet.
2014; 384: 766-81.
9. Caballero B. The global epidemic of obesity: an overview. Epidemiol Rev. 2007; 29: 1-5.
10. Popkin BM, Gordon-Larsen P. The nutrition transition: worldwide
obesity dynamics and their determinants. Int J Obes Relat Metab Disord. 2004; 28 (Suppl 3): S2-9.
11. Carvalho LK, Barreto Silva MI, da Silva Vale B, Bregman R, Martucci RB, Carrero JJ, et al. Annual variation in body fat is associated with
systemic inflammation in chronic kidney disease patients Stages
3 and 4: a longitudinal study. Nephrol Dial Transplant. 2012; 27: 1423-8.
12. Nihi MM, Manfro RC, Martins C, Suliman M, Murayama Y, Riella MC, et al. Association between body fat, inflammation and
oxidative stress in hemodialysis. J Bras Nefrol. 2010; 32: 11-7. 13. Witasp A, Carrero JJ, Heimburger O, Lindholm B, Hammarqvist F,
Stenvinkel P, et al. Increased expression of pro-inflammatory genes
in abdominal subcutaneous fat in advanced chronic kidney disease patients. J Intern Med. 2011; 269: 410-9.
14. Abraham G, Sundaram V, Sundaram V, Mathew M, Leslie N, Sathiah
V. C-Reactive protein, a valuable predictive marker in chronic kidney disease. Saudi J Kidney Dis Transpl. 2009; 20: 811-5. 15. Tsai YW, Lu MC, Lin YH, Lee YC, Li WC, Chen JY, et al. Combined
body mass index with high-sensitivity C-reactive protein as independent predictors for chronic kidney disease in a relatively healthy population in Taiwan. Eur J Clin Nutr. 2016; 70: 766-72.
16. Lacson E, Levin NW. Poor nutritional status and inflammation:
C-reactive protein and end-stage renal disease. Semin Dial. 2004; 17: 438-448.
17. Chambers AJ, Parise E, McCrory J, Cham R. A comparison of prediction equations for the estimation of body fat percentage in non-obese and obese older Caucasian adults in the United States. J Nutr Health Aging. 2014; 18: 586-90.
18. Akchurin OM, Kaskel F. Update on inflammation in chronic kidney
disease. Blood Purif. 2015; 39: 84-92.
19. Herrington WG, Smith M, Bankhead C, Matsushita K, Stevens
S, Holt T, et al. Body-mass index and risk of advanced chronic kidney disease: Prospective analyses from a primary care cohort of 1.4 million adults in England. PloS one. 2017; 12: e0173515. doi: 10.1371/journal.pone.0173515.
20. Silva MIB, da Silva Lemos CC, Torres MRSG, Bregman R.
Waist-to-height ratio: an accurate anthropometric index of abdominal adiposity and a predictor of high HOMA-IR values in nondialyzed chronic kidney disease patients. Nutrition. 2014; 30: 279-85. 21. Johansen KL, Lee C. Body composition in chronic kidney disease.
Curr Opin Nephrol Hypertens. 2015; 24: 268-75.
22. Mallamaci F, Tripepi G. Obesity and CKD progression: hard facts
on fat CKD patients. Nephrology Dialysis Transplantation. 2013; 28(Suppl 4): iv105-8.
23. Mafra D, Guebre-Egziabher F, Fouque D. Body mass index, muscle
24. Cuppari L. Diagnosis of obesity in chronic kidney disease: BMI or body fat? Nephrology Dialysis Transplantation. 2013; 28(Suppl 4): iv119-21.
25. Akchurin M, Kaskel F. Update on inflammation in chronic kidney
disease. Blood Purif. 2015; 39: 84-92.
26. Lin CC, Kardia SL, Li CI, Liu CS, Lai MM, Lin WY, et al. The relationship of high sensitivity C-reactive protein to percent body fat mass, body mass index, waist-to-hip ratio, and waist circumference in a Taiwanese population. BMC Public Health. 2010; 10: 579. doi: 10.1186/1471-2458-10-579.
27. Reiss AB, Voloshyna I, De Leon J, Miyawaki N, Mattana J. Cholesterol metabolism in CKD. Am J Kidney Dis. 2015; 66: 1071-82.
28. Kwok T, Woo J, Lau E. Prediction of body fat by anthropometry in older Chinese people. Obes Res. 2001; 9: 97-101.