Drago Ilišinović
Biophysical characterisation of LL-37-derived
antimicrobial peptides
DIPLOMA THESIS
Submitted to University of Zagreb Faculty of Pharmacy and Biochemistry
This thesis has been registered in the course Molecular Biology with Genetic Engineering of University of Zagreb Faculty of Pharmacy and Biochemistry. The experimental work was performed at the Institute of Molecular Biosciences of Karl-Franzens University of Graz, Austria under the expert guidance of Assoc. Prof. Karl Lohner, PhD and co-supervision of Assoc. Prof. Gordana Maravić-Vlahoviček, PhD.
I would like to thank Assoc. Prof. Karl Lohner, PhD for giving me the chance to work at the Institute of Molecular Biosciences and for his expert advice and care during my stay in Graz and in writing this thesis.
I would also wish to thank Nermina Malanović, PhD for her irreplaceable help with the experiments, advice given during the writing of this thesis and for helping me to get to know Graz. Hvala Ti!
Many thanks to my supervisor Assoc. Prof. Gordana Maravić-Vlahoviček for her support, advice and expediteness. Profesorice, hvala Vam!
My gratitude goes to all the professors, assistants and employees of University of Zagreb Faculty of Pharmacy and Biochemistry who gave me the necessary knowledge and skills and who are always here to support all students.
I am thankful to my friends and colleagues for their support, understanding and encouragement. Without your friendship and help I would never make it this far. Hvala vam! Na kraju, najviše zahvaljujem svojoj obitelji, svojim roditeljima i bratu, koji su mi najveća podrška i oslonac u svemu. Zbog vas je sve ovo bilo moguće. Hvala vam!
CONTENTS
1. INTRODUCTION ... 1
1.1. ABOUT AMPs IN GENERAL AND THEIR APPLICATION AS THERAPEUTIC AGENTS IN TREATMENT OF BIOFILM ASSOCIATED INFECTIONS ... 2
1.2. MEMBRANE COMPOSITION AS A KEY FACTOR OF PEPTIDE SPECIFICITY: MODEL MEMBRANES ... 3
1.3. MECHANISM OF ACTION OF AMPs: THE CASE OF OP-145 – MEMBRANE INTERACTION ... 5
1.4. RATIONALE BEHIND DESIGN OF AMPs BASED ON OP-145 ... 6
1.5. P148 AND P276: NOVEL PEPTIDES WITH IMPROVED PROPERTIES ... 7
2. RESEARCH OBJECTIVES ... 9
3. MATERIALS AND METHODS ... 10
3.1. MATERIALS AND INSTRUMENTS ... 10
3.2. METHODS: PRINCIPLES OF TECHNIQUES USED IN EXPERIMENTS ... 12
3.2.1. DIFFERENTIAL SCANNING CALORIMETRY (DSC) ... 12
3.2.2. CIRCULAR DICHROISM (CD) ... 13
3.2.3. DYNAMIC LIGHT SCATTERING (DLS) ... 13
3.2.4. FLUORESCENCE SPECTROPHOTOMETRY (FLUOROMETRY) ... 14
3.3. EXPERIMENTAL PROCEDURES... 15
3.3.1. PREPARATION OF PEPTIDE SOLUTIONS ... 15
3.3.2. PREPARATION OF LIPOSOMES ... 15
3.3.3. COMPUTER-BASED MODELLING: IN SILICO PREDICTION OF PEPTIDE PROPERTIES ... 17
3.3.4. SECONDARY STRUCTURE DETERMINATION OF PEPTIDES ... 17
3.3.5. CALORIMETRIC MEASUREMENTS ... 18
3.3.6. SIZE MEASUREMENT OF LIPOSOMES ... 19
3.3.7. VESICLE LEAKAGE ASSAY - FLUOROMETRY ... 20
3.3.8. PEPTIDE-LIPID AFFINITY ASSAY ... 23
4. RESULTS ... 24
4.1. IN SILICO STRUCTURAL PROPERTIES OF AMPS ... 24
4.1.1. OP-145 ... 24
4.1.2. P148 ... 25
4.1.3. P276 ... 26
4.2.1. OP-145 ... 27
4.2.2. P148 ... 29
4.2.3 P276 ... 31
4.3. SIZE MEASUREMENT OF LIPOSOMES ... 33
4.4. CALORIMETRIC MEASUREMENTS: INTERACTION OF AMPS WITH BACTERIAL AND MAMMALIAN MODEL MEMBRANES... 36
4.5. VESICLE LEAKAGE ASSAY: IMPACT OF PEPTIDES UPON MEMBRANE PERMEATION ... 42
4.5.1. IMPACT OF SERUM ON MEMBRANE PERMEABILITY ACTION OF AMPs ... 44
4.5.2. EFFECT OF BSA ON MEMBRANE PERMEABILITY ACTION OF AMPs .... 45
4.6. PEPTIDE-LIPID AFFINITY ASSAY: AMPs’ DISCRIMINATION BETWEEN MEMBRANES ... 46
5. DISCUSSION ... 48
6. CONCLUSION ... 52
7. REFERENCES ... 53
8. SUMMARY ... 58
9. SAŽETAK (in Croatian) ... 59
9.1. UVOD ... 59
9.2. OBRAZLOŽENJE TEME ... 59
9.3. MATERIJALI I METODE ... 60
9.4. REZULTATI, RASPRAVA I ZAKLJUČAK ... 60
1 1. INTRODUCTION
In September 2016, world leaders have met at the United Nations (UN) to discuss the problem of antimicrobial resistance (AMR) (www.who.int). It was only the fourth time ever a health issue had been discussed at the UN General Assembly Combined with the fact that the World Health Organisation (WHO) has warned that “antimicrobial resistance threatens the very core of modern medicine and the sustainability of an effective, global public health response to the enduring threat from infectious diseases” (WHO, 2015), there are strong indications that antimicrobial resistance will be a major problem in future. Simultaneously, World Bank has reported that the worldwide increase of health system costs caused by AMR could cause similar effects on global economy to those of the 2008 financial crisis (World Bank, 2016). Therefore, it is clear that measures need to be taken to rationalise the use of currently known antimicrobial drugs, as well as to develop new antimicrobials, in particular new antibiotics which could cure multiple drug resistant (MDR) bacterial infections. One class of chemical compounds that have antibiotic properties are antimicrobial peptides (AMPs), which are naturally occurring defence mechanisms against pathogens of most living organisms. These peptides act against a wide range of microorganisms, including positive and Gram-negative bacteria, mostly by disrupting the plasma membrane, which leads to cell lysis (Reddy et al., 2004). These peptides can then be used as models for synthesis of new peptides with different, new or enhanced properties.
2 1.1. ABOUT AMPs IN GENERAL AND THEIR APPLICATION AS THERAPEUTIC AGENTS IN TREATMENT OF BIOFILM ASSOCIATED INFECTIONS
Antimicrobial peptides offer protection to various organisms against pathogens such as viruses, bacteria and fungi. Considering their antibacterial activity, the majority of peptides do not target a single target as conventional antibiotics, but instead act directly on the cytoplasmic membrane. Therefore, their activity is independent of bacterial metabolic activity. They act as microbicides within minutes of contact and, since they have no specific target on which they act, bacterial resistance is less likely to be developed (Zasloff, 2002). They are also biodegradable.
In addition to having antimicrobial properties, some of these peptides also possess other properties, such as immunomodulatory and anti-inflammatory action, bacterial cell components–neutralising activity and biofilm–eradicating properties (Hancock and Sahl, 2006). Considering their structure, they are usually short (up to 40 amino acid residues), cationic, amphipathic and often helical. (www.bali-consortium.eu)
It has been found that certain AMPs have anti-biofilm properties (Batoni et al., 2016). Biofilms are aggregates of microorganisms in which cells are embedded within a self-produced matrix of extracellular polymers and in which they adhere to each other and/or the surface (Vert et al., 2012). Infections involving biofilms are very hard to eradicate as the biofilm offers protection against both the host’s immune system and conventionally applied antibiotics. Biofilms can form on prosthetic medical devices that are surgically implanted into a patient’s body, such as artificial heart valves, artificial hips, joints etc. It can be especially dangerous if an infection occurs with a resistant or multiple-resistant bacterial strain, such as methicillin-resistant Staphylococcus aureus (MRSA). This can cause chronic, severe infections.
An international consortium called Biofilm Alliance (BALI) has been established with the goal of developing antimicrobial peptides that would be coated on prosthetic implants with controlled release in hope of preventing biofilm-associated infections and improving patients’ quality of life (www.bali-consortium.eu). Biofilm Alliance (BALI) project uses OP-145 as a model for the development of novel AMPs with better properties to fight against biofilm-associated infections (www.bali-consortium.eu). OP-145 (previously known as P60.4Ac) is
3 an antimicrobial peptide that was developed from LL-37 (Nell et al., 2006). LL-37 belongs to a family of the naturally occurring peptides called cathelicidins (Zanetti et al., 1995). It is a 37-residue product of proteolytic degradation of the human cathelicidin hCAP-18 (Sørensen et al., 1997). LL-37 is an amphipathic, α-helical peptide found throughout the body with antibacterial, immunomodulatory and lipopolysaccharide (LPS)-neutralising activity (Bucki et al., 2008; Dürr et al., 2006).
1.2. MEMBRANE COMPOSITION AS A KEY FACTOR OF PEPTIDE SPECIFICITY: MODEL MEMBRANES
As mentioned before, most antimicrobial peptides manifest their effect by acting upon the cell membrane Therefore, membranes and their composition are of special interest when discussing AMPs.
Prokaryotic and eukaryotic membranes have different lipid composition. Indeed, even different bacterial species may differ in lipids present in their membranes. It is this composition that is crucial to AMPs activity, in addition to the nature of the peptide, as they may be more selective towards certain kinds of lipids because of their charge or hydropathicity (Koller and Lohner, 2014; Lohner, 2009).
Gram-negative cell envelope consists of two lipid bilayers, the outer membrane and the inner membrane. The outer membrane is highly asymmetrical, with lipopolysaccharides located exclusively on the outer side, and phospholipids, most of which phosphatidylethanolamine (PE), on the inner side. On the other hand, the inner membrane is composed mostly of PE and, to a lesser extent, negatively charged lipids such as phosphatidylglycerol (PG). In between them lies a layer of peptidoglycan (PGN). Gram-positive bacteria have only the inner membrane of similar composition, but with more PG than PE and with a thick layer of PGN and lipoteichoic acid (LTA) on the outside (Lohner et al., 2008).
Eukaryotic cell membranes show high asymmetry, with amino phospholipids such as PE and phosphatidylserine (PS) occupying almost exclusively the inner side, while the outer side is rich in choline phospholipids, mostly zwitterionic phosphatidylcholine (PC) and sphingomyelin (SM). This asymmetry is maintained by an ATP-dependent translocase. In
4 physiological conditions, PS presence on the surface of a cell membrane is an apoptotic signal for the immune system to get rid of the cell. However, PS is present on cell surface also in certain pathological conditions, primarily in cancerous cells. Therefore, it has been investigated as a target for anticancer therapy (Riedl et al., 2015). A high content of cholesterol of around 25% is also characteristic for animal membranes (Lohner et al., 2008). It is also worthy to note that bacterial and mammalian membranes alike are a complex mixture not just of various lipids, but of different peptides and polysaccharides also. While lipid composition is the main factor, other membrane components may add or subtract to AMP’s activity. Membrane domains are also something worth describing. An AMP may prefer to interact with one lipid species over the other. Therefore, in a membrane composed of various lipids, it may happen that a membrane domain composed only of one lipid species is formed beneath the peptide, such as in a carpet model. Such lipid segregation may lead to membrane destabilisation and consequently disruption because of, for example, changed surroundings of membrane proteins or different curvature of the membrane (Lohner et al., 2008).
Bacterial cell envelope also needs to be taken into consideration. It has recently been discussed that the PGN layer of Gram-positive bacterial cells does not have an influence on antimicrobial activity, whereas interaction with LTA diminishes the concentration of peptide on the membrane itself, possibly by the mostly positive AMPs binding to the negatively charged LTA (Malanovic and Lohner, 2016).
Given the complexity of biological membranes, there is a need for their simplification in biophysical research. In this thesis, the membrane activity of peptides was studied on prokaryotic and eukaryotic model membranes. PG liposomes were used to mimic Gram-positive bacterial cell membranes, and PC liposomes to mimic mammalian cell membranes. These lipids were prepared in such a way that they formed liposomes. Liposomes can come in the form of multilamellar vesicles (MV), oligolamellar vesicles (OV) and unilamellar vesicles (UV), depending on the number of lipid bilayers inside one vesicle. For certain experiments it is vital that the liposomes are unilamellar, so they need to be extruded through membrane filters (Zweytick et al., 2011). SDS and DPC micelles, which are good approximations of bacterial and mammalian model membranes, respectively, were used too (Manzo et al., 2013). However, care needs to be taken when results taken from research on model systems are
5 compared to the activity on real cells as the role of individual lipid species and the affinity with which AMPs bind to them is not yet fully understood (Lohner et al., 2008).
1.3. MECHANISM OF ACTION OF AMPs: THE CASE OF OP-145 – MEMBRANE INTERACTION
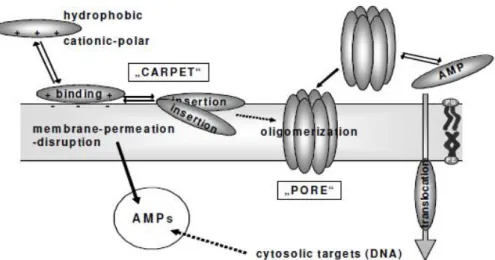
It has been shown that AMPs exert their action mostly by acting upon bacterial cytoplasmic membrane, causing it to destabilise and disrupt (Lohner, 2009; Reddy et al., 2004). Two major models are discussed in literature: the carpet mechanism and transmembrane pore-forming mechanism (Lohner et al., 2008). In the carpet mechanism, peptides gather on the membrane surface because of electrostatic interactions and, upon reaching a critical concentration, exert their action by either a detergent-like effect or some other destabilising mechanism. In the other model, peptides arrange themselves through the membrane in a way a pore is formed which causes cell content leakage, whereas the membrane itself might stay intact, although membrane thinning through mechanisms such as interdigitation or trans-gauche isomerisation might precede pore formation (Koller and Lohner, 2014; Lohner et al., 2008). An overview of these modes of action is given on Figure 1. It is the phenomenon of interdigitation that is of special interest as it has been shown that OP-145 interacts with model membranes in such a way. In essence, in a lipid bilayer, lipids are oriented with their hydrocarbon chains towards one another to form a hydrophobic core. When interdigitation occurs, lipids are pushed towards each other vertically so that long hydrocarbon chains of lipids from opposite sides are intertwined, either partially or completely. This causes membrane thinning and destabilisation (Smith and Dea, 2013). A graphical representation of this process is provided on Figure 2. Other mechanisms may be involved, too, and it is suggested that these different mechanisms are gradual steps in the process of membrane destabilisation (Lohner and Prenner, 1999).
6 Figure 1. An overview of AMPs modes of action (retrieved from www.bali-consortium.eu).
Figure 2. A simplified scheme of interdigitation process.
1.4. RATIONALE BEHIND DESIGN OF AMPs BASED ON OP-145
OP-145 is a 24-residue peptide developed at the Leiden University Medical Center (LUMC), Leiden, The Netherlands (Nell et al., 2006) with the sequence acyl-LKRVWKRVFKLLKRYWRQLKKPVR-amide. It has been shown that OP-145 possesses activity against Gram-positive bacteria such as methicillin-resistant S. aureus (MRSA) (Haisma et al., 2014) and that it has low toxicity towards mammalian cells (Malanovic et al., 2015). Moreover, it has anti-inflammatory and biofilm-eradicating properties (Nell et al., 2006) and has been shown to be safe and efficient in the treatment of chronic otitis media in clinical Phase I and II trials (Peek et al., 2009). It has been suggested for use in prosthetic implants as a coating which would protect both against infection and biofilm formation (de Breij et al., 2016). However, it also has certain disadvantages, such as propensity towards bacterial enzymatic degradation and, especially, considerably low level of activity in presence
7 of blood plasma. LC99.9 (the lowest concentration that kills 99.9% of bacteria) of OP-145 in
phosphate-buffered saline (PBS) was determined to be 1.6 μM, whereas in 50% plasma in PBS it was about 204.8 μM (Nibbering, 2015).
As mentioned earlier, BALI project aims to develop new, improved AMPs based on OP-145 with better properties: greater specificity for prokaryotic membranes, resistance to degradation, improved antimicrobial, antibiofilm and immunoorchestrating activities, lower cytotoxicity, resistance to proteolysis by bacterial enzymes, larger level of activity in presence of blood plasma and improved safety and efficacy. Among the peptides developed by this consortium are P148 and P276, whose characterisation is the main subject of this thesis.
1.5. P148 AND P276: NOVEL PEPTIDES WITH IMPROVED PROPERTIES
P148 and P276 are peptides derived from OP-145 with following sequences: P148: acyl-LKRVWKRVFKLLKRYWRQLKKPVR-amide and
P276: acyl-LKRVWKAVFKLLKRYWRQLKKPVR-amide.
They differ mutually only in the 7th amino acid residue (alanine in P276 instead of arginine found in P148), as P276 was developed from P148 via alanine scanning (Nibbering, 2015). P148 and P276 were designed to fold into an alpha helix with all the hydrophobic residues on one side of the helix and the cationic ones on the other – an amphipathic helix (Nibbering, 2015). In comparison to OP-145, both novel peptides are characterized by higher net positive charge and higher total hydrophobicity, which is considered to be important for initial binding to anionic membrane phospholipids and higher partitioning into membrane. This certainly would lead to stronger membrane disruption.
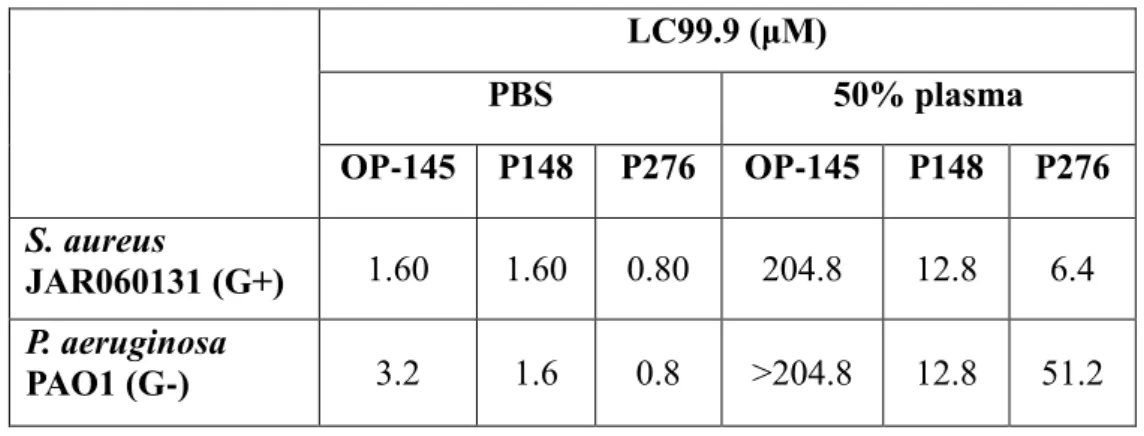
Both novel peptides, P148 and P276, exhibit similar antimicrobial activity in PBS as tested in comparison to OP-145 (Nibbering, 2015). Interestingly, they show significant increase in killing of both Gram-positive and Gram-negative bacteria in the presence of 50% plasma. This is an advantage of the novel peptides compared to OP-145 which loses its activity in presence of blood plasma. Their haemolytic activity on human erythrocytes (experiments were performed in a cooperating laboratory: Anna de Breij, Leiden University Medical
8 Centre, Leiden, The Netherlands) is higher than for OP-145, but they are not haemolytic at the concentration where they exert antimicrobial activity. In conclusion, this observation suggests the novel peptides as better candidates for applications in humans.
Table 1. OP-145, P148 and P276 activity against Staphylococcus aureus and Pseudomonas aeruginosa. The results are expressed as a lethal concentration (LC99.9) that kills 99.9%
bacterial cells within 2 h.
LC99.9 (μM) PBS 50% plasma OP-145 P148 P276 OP-145 P148 P276 S. aureus JAR060131 (G+) 1.60 1.60 0.80 204.8 12.8 6.4 P. aeruginosa PAO1 (G-) 3.2 1.6 0.8 >204.8 12.8 51.2
Table 2. OP-145, P148 and P276 haemolytic activity. Results are presented as median maximal non-haemolytic concentration (MMNHC).
Median maximal non-haemolytic concentration (μM)
PBS 50% plasma
OP-145 1.6 (0.8-3.2) 51.2 P148 0.3 (0.2-0.8) 12.8 (6.4-25.6)
9 2. RESEARCH OBJECTIVES
Resistance to antimicrobial drugs is an ever-growing problem in modern healthcare. Since the introduction of penicillin in 1943, nearly every antibiotic has seen at least one bacterial strain develop a resistance (http://www.cdc.gov). Therefore, there is a need for research of new antibiotics. One approach in this area is researching novel antimicrobial peptides (AMPs) (Lohner, 2009). These peptides are often derivatives of naturally occurring peptides, which exhibit action against microorganisms. One such peptide is a human cathelicidin LL-37 derivative, OP-145 (Malanovic et al., 2015; Nell et al., 2006), whose derivatives P148 and P276 were studied in this thesis.
The goal of this thesis was to study the biophysical properties of P148 and P276 and the way they interact with bacterial and mammalian model membranes, simulating their action on prokaryotic and eukaryotic cell membranes. These properties were then compared with those of OP-145. In addition, the purpose was to deepen the knowledge of antimicrobial peptides and to contribute to the global fight against microbial antibiotic resistance.
10 3. MATERIALS AND METHODS
3.1. MATERIALS AND INSTRUMENTS
The experiments that laid foundation for this thesis were performed using the following equipment:
Heidolph MR 3001 K magnetic stirring hotplate, Heidolph Instruments GmbH & Co. KG, Germany
Heidolph Reax top shaker/vortex, Heidolph Instruments GmbH & Co. KG, Germany Heraeus VTR5022 vacuum oven, Heraeus Holding GmbH, Germany
Binder ED-53 and Binder FD-53 drying ovens, Binder GmbH, Germany Techne Dri-Block® DB200/3 sample concentrator, Bibby Scientific Ltd, UK Malvern Zetasizer Nano ZEN5600, Malvern Instruments Ltd, UK
VP-DSC microcalorimeter, Microcal Inc., USA
NanoDrop® spectrophotometer ND-1000, NanoDrop Technologies Inc., USA J-715-150S spectropolarimeter, JASCO Corp., Japan
Cary Eclipse fluorescence spectrophotometer, Varian Australia Pty Ltd, Australia Electronic balance ABJ 220-4M, KERN & Sohn GmbH, Germany
FiveEasy™ FE20 pH meter, Mettler-Toledo AG, Switzerland
Avanti Mini Extruder with 0.1 µm polycarbonate membrane filters, Avanti Polar Lipids, Inc., USA
Whatman™ 0.1 µm pore size nylon syringe filter, GE Healthcare Life Sciences, UK PIPETMAN® pipettes, Gilson S.A.S., France
Elga LabWater PURELAB UHQ water purification system, Veolia Water, France.
Data was processed using the following software:
Origin®, versions 7E and 9.3, OriginLab™, Microcal Inc., USA Zetasizer Software 7.02, Malvern Instruments Ltd, UK
NanoDrop® ND-1000 v3.5.2, Coleman Technologies, Inc. for NanoDrop Technologies, Inc., USA
11 Cary Eclipse Kinetics Applicaton v1.1 (133), Varian Australia Pty Ltd, Australia WebLab ViewerPro 4.0, Molecular Simulations Inc., USA
DichroWeb, Institute of Structural and Molecular Biology, Birkbeck College, University of London, UK.
Following chemicals were used in the experiments:
OP-145, P148 and P276, peptides (Nell, et al., 2006; Nibbering, et al., 2015) Sodium dihydrogen phosphate monohydrate p.a., Merck KGaA, Germany
Disodium hydrogen phosphate ≥99% p.a., Carl Roth GmbH & Co. KG, Germany 4-(2-Hydroxyethyl)piperazine-1-ethanesulfonic acid (HEPES) min. 99.5%,
Sigma-Aldrich Co., USA
1,2-dipalmitoyl-sn-glycero-3-phosphocholine (DPPC), Avanti Polar Lipids, Inc., USA 1,2-dipalmitoyl-sn-glycero-3-phospho-rac-(1-glycerol) sodium salt (DPPG),
Sigma-Aldrich Co., USA
1-palmitoyl-2-oleoyl-sn-glycero-3-phosphocholine (POPC), Avanti Polar Lipids, Inc., USA
1-palmitoyl-2-oleoyl-sn-glycero-3-phospho-rac-(1-glycerol) sodium salt (POPG), Sigma-Aldrich Chemie GmbH, Germany
8-aminonaphthalene-1,3,6-trisulfonic acid, disodium salt (ANTS) and p-xylene-bis-pyridinium bromide (DPX), Molecular Probes™, Thermo Fisher Scientific, USA Sephadex™ G-75, GE Healthcare Life Sciences, UK
Cholesterol, Sigma Grade, ≥99%, Sigma-Aldrich Co., USA
Peptidoglycan (PGN) from Bacillus subtilis, Sigma-Aldrich Co., USA Triton™ X-100, laboratory grade, Sigma-Aldrich Co., USA
Dodecylphosphocholine (DPC), Avanti Polar Lipids, Inc., USA
Sodium lauryl sulfate (SDS) ≥99%, for biochemistry, Carl Roth GmbH & Co. KG, Germany
Sodium lauryl sulfate ≥98.5%, BioReagent, suitable for electrophoresis, for molecular biology, Sigma-Aldrich Chemie GmbH, Germany
2-propanol ROTIPURAN® ≥99.8% p.a., ACS, ISO, Carl Roth GmbH & Co. KG, Germany
12 Chloroform HPLC grade, J.T. Baker®, Mallinckrodt Baker B.V., Holland
Bovine serum, Sigma-Aldrich Handels GmbH, Austria
Bovine serum albumin (BSA) standard, Thermo Scientific, USA.
3.2. METHODS: PRINCIPLES OF TECHNIQUES USED IN EXPERIMENTS
In biophysical research of peptides and their interactions with model membranes a number of techniques are used. These include, but are not limited to, differential scanning calorimetry (DSC) (Smith and Dea, 2013), dynamic light scattering (DLS) (Stano et al., 2005), circular dichroism (CD) (Malanovic and Lohner, 2016) and fluorescent spectroscopy (Zweytick et al., 2011). These techniques were used to conduct experiments for this thesis and an overview of principles of their action is given below.
3.2.1. DIFFERENTIAL SCANNING CALORIMETRY (DSC)
DSC is a versatile thermoanalytical technique that can be used to analyse both solid and liquid samples in order to detect phase transitions. In analyses of liposomes, it can easily detect phase transitions and thermodynamic behaviour of pure lipids and lipid mixtures, including lipids organised into liposomes (Smith and Dea, 2013). DSC measures the difference in the amount of heat required to maintain both the sample and the reference at the same temperature. As phase transitions are either endothermic or exothermic processes, they require additional or reduced energy to keep the sample at the same temperature as the reference, and this difference is recorded in the thermogram. Both transition temperature and heat capacity can be determined this way (Atkins and de Paula, 2006).
Disaturated lipids organised in bilayers exhibit two different transitions: the so-called pre-transition in which they pass from the planar gel phase into the rippled gel phase and the main transition, when lipids pass from the gel phase into the fluid phase. The temperature range of the pre-transition is quite broad and is characterized by a lower enthalpy change than the main transition, which occurs at a higher temperature, is much sharper and more prominent on the thermogram and has higher enthalpy. Both pre-transition and main transition are affected
13 when lipids, i.e. liposomes interact with peptides: there can be a shift in temperature, an increase or a decrease in enthalpy and/or peak splitting, the last change indicating that different lipid domains have formed (Lohner and Prenner, 1999).
3.2.2. CIRCULAR DICHROISM (CD)
CD is the difference in the absorption of left- and right-hand polarised light. The difference is due to the properties of optically active molecules and to the three-dimensional structure of the polymer, if it is a polymer’s such as a peptide’s CD spectrum that is measured. Most notable use of this technique is the determination of secondary structure of peptides. Different secondary structures give different spectra in the UV region; therefore, from the relevant spectra of protein or peptide samples, their secondary structure can be determined (Atkins and de Paula, 2006). The results are usually expressed as mean residue molar ellipticity, [θ]MR,
which is defined as ellipticity of the resultant polarised light vector per concentration of sample, cell pathlength and number of peptide bonds in the molecule (www.photophysics.com). Since it has been shown that the secondary structure of peptides influences the way peptides interact with membranes, it is often useful to determine secondary structure of AMPs in the presence and absence of lipid membranes in order to assess their activity (Arouri et al., 2013).
3.2.3. DYNAMIC LIGHT SCATTERING (DLS)
DLS, also known as quasi-elastic light scattering (QELS), is a technique used for measuring the size and size distribution of particles in the submicron range. It measures the hydrodynamic (Stokes) diameter of a given particle, meaning the diameter of a perfect sphere that diffuses in the same manner as the particle being measured. It takes into account solvatisation of the particle. DLS measuring results are expressed as Z-Average size, which is defined as the “harmonic intensity averaged particle diameter” (www.malvern.com) and given by default as intensity distribution. Polydispersity index (PDI) is a number between 0 and 1 and defines the measure of size distribution width, with lower values indicating a more uniform particle size distribution (www.malvern.com).
14 3.2.4. FLUORESCENCE SPECTROPHOTOMETRY (FLUOROMETRY)
This assay is based upon the principle of measurement of fluorescence from a fluorescent molecule (a fluorophore) when excited by exterior electromagnetic radiation. The exciting photons are generally from the UV range, while emission typically occurs in the visible part of spectrum (Watson, 1999).
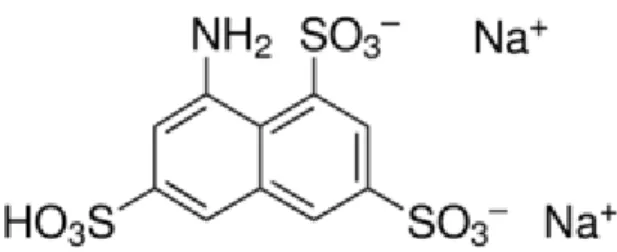
One well-established assay uses 8-aminonaphthalene-1,3,6-trisulfonic acid (ANTS) as a fluorophore and p-xylene-bis-pyridinium bromide (DPX) as a quencher. A quencher is a molecule that shortens the lifetime of the excited state of a fluorophore, that is, quenches fluorescence (Atkins and de Paula, 2006). ANTS and DPX are present together in a liposome that is to be analysed; therefore, the fluorescence is quenched. When the liposome is degraded or its contents leak through the membrane, ANTS and DPX are diluted in such a way that the quencher’s concentration is not sufficient to quench the fluorescence anymore, and the increase in fluorescence is quantitatively interpreted as leakage from liposomes, that is, liposome disintegration (Ellens et al., 1985). ANTS and DPX structures are shown on Figures 3 and 4, respectively.
Figure 3. ANTS (fluorophore) structure (retrieved from www.sigmaaldrich.com)
15 3.3. EXPERIMENTAL PROCEDURES
3.3.1. PREPARATION OF PEPTIDE SOLUTIONS
First, two buffers were prepared: 20 mM phosphate + 130 mM sodium chloride, pH=7.4 phosphate-buffered saline (PBS) and 10 mM HEPES (salt-free), pH=7.0 (HEPESSF). OP-145,
P148 and P276 were available in pre-weighed quantities in small cuvettes. The appropriate buffer, depending on further use, was added to achieve a peptide concentration of 10 mg/ml (OP-145) or 2 mg/ml (P148 and P276). Unless otherwise indicated, all subsequent experiments were performed using all three peptides separately.
3.3.2. PREPARATION OF LIPOSOMES
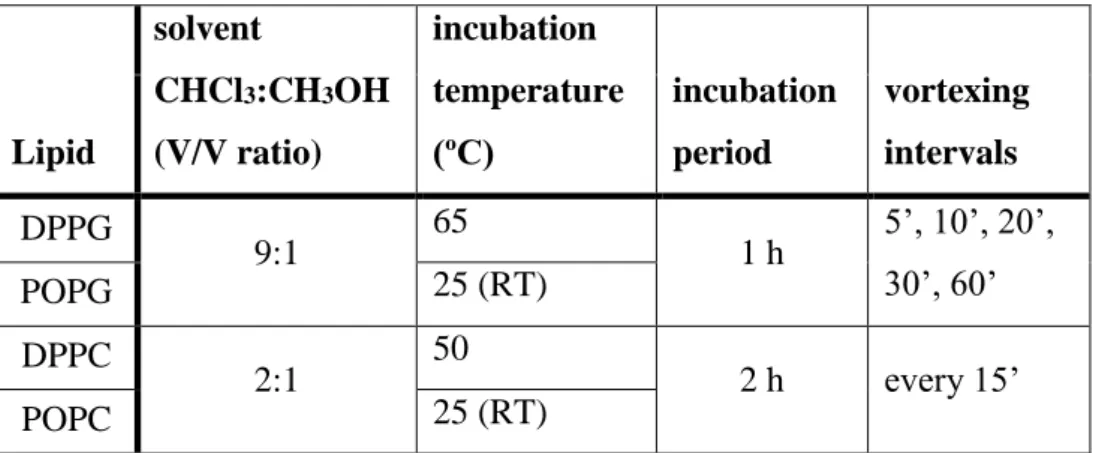
DPPG and DPPC films used in DSC assays were prepared by first dissolving separately 10 mg each in 1 ml of the appropriate solvent. 100 μl aliquots of these solutions were then transferred to glass vials and the solvent was evaporated under a stream of nitrogen. POPG and POPC films used in CD and size measurements were prepared by dissolving separately 26 mg and 24 mg of lipid, respectively, in 1 ml of the appropriate solvent and subsequent evaporation of the solvent under a stream of nitrogen. Prepared films were kept overnight under vacuum at room temperature and afterwards stored at 4ºC. When ready to use, films were hydrated by adding 1 ml of buffer and vortexing at maximum speed for 1 min, incubated at temperature about 10 ºC above the main transition temperature for the given period of time and vortexed at maximum speed at given intervals for 1 min during the incubation period. Thus prepared liposomal suspensions were allowed to cool and used in further experiments. POPG and POPC liposomes were extruded 15 times through a 0.1 µm pore size membrane filter to gain unilamellar vesicles and size homogeneity. Prior to all further handling the suspensions were briefly vortexed to resuspend the liposomes. The necessary parameters for liposome preparation are given in Table 3. An overview of buffers and types of lipids used in different analytical methods is given in Table 4.
16 Table 3. Liposomes preparation parameters; RT = room temperature
Lipid solvent CHCl3:CH3OH (V/V ratio) incubation temperature (ºC) incubation period vortexing intervals DPPG 9:1 65 1 h 5’, 10’, 20’, 30’, 60’ POPG 25 (RT) DPPC 2:1 50 2 h every 15’ POPC 25 (RT)
Table 4. Lipids and buffers used in different methods. PBS – phosphate-buffered saline; HEPESSF – salt-free HEPES; HEPESF, HEPESE – see section 3.3.7.1.
Lipid Technique
DSC DLS CD fluorometry
DPPG PBS - - -
POPG - PBS HEPESSF HEPESF/HEPESE/PBS
DPPC PBS - - -
POPC - PBS HEPESSF HEPESF/HEPESE/PBS
For DSC analyses DPPG and DPPC were used because they form lipid bilayers that are in the planar gel phase at room temperature. Therefore, by heating them, both pretransition and main transition can be observed. These multilamellar vesicles were prepared both without and with the analysed peptides. Peptides were dissolved in PBS prior to film hydration, with the combined volume of peptide solution and buffer being 1 ml. Different peptide concentrations were prepared, as described in paragraph 3.3.5. In other assays, peptides were added to pre-formed liposomes.
On the other hand, POPG and POPC were used in other experiments because they form bilayers that are fluid already at room temperature, so they mimic real biological membranes in a better fashion.
For leakage assay, 20 mg of lipids or lipid mixtures was used per film. POPC vesicles were prepared both with and without cholesterol (25% molar cholesterol relative to POPC amount;
17 cholesterol was added during the film formation stage), while POPG vesicles were prepared both with and without peptidoglycan (PGN was added after liposomes formation), both using fluorescent buffer, as described in paragraph 3.3.7.1.
3.3.3. COMPUTER-BASED MODELLING: IN SILICO PREDICTION OF PEPTIDE PROPERTIES
The following programmes were used to model OP-145, P148 and P276 and to predict their properties based on their amino acid sequences:
1. PEP-FOLD 2.0 (Shen et al., 2014; Néron B, 2009), used to predict secondary structure and make a 3D model of peptide and
2. WebLab ViewerPro to visualise data generated by PEP-FOLD 2.0.
3.3.4. SECONDARY STRUCTURE DETERMINATION OF PEPTIDES
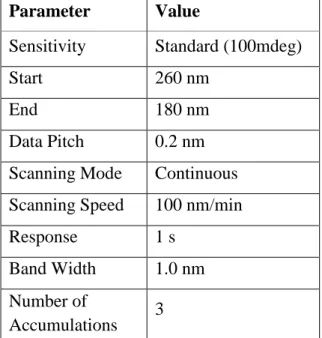
Secondary structure of peptides alone and in membrane mimetic systems was determined by measuring circular dichroism (CD) in a spectropolarimeter at room temperature. 10 mM HEPES buffer was first measured as a blank in a 0.02 cm quartz cuvette with parameters defined in Table 5. Samples were then measured under same conditions in five groups, peptide concentration being kept constant at 200 μM:
1. Sole peptides in HEPES: OP-145, P148 and P27;
2. Peptides with SDS in 100:1, 25:1 and 6.25:1 SDS:peptide molar ratios; 3. Peptides with DPC in 100:1, 25:1 and 6.25:1 DPC:peptide molar ratios; 4. Peptides with POPG in 100:1, 25:1 and 6.25:1 POPG:peptide molar ratios and 5. Peptides with POPC in 100:1, 25:1 and 6.25:1 POPC:peptide molar ratios.
Samples were measured at 0, 15, 30 and 60 minutes from adding peptides. Blank signal was subtracted from the respective sample spectra. Data obtained from CD measurements was expressed as mean residue molar ellipticity, [θ]MR. Such data files were uploaded to
DichroWeb server for analysis in order to determine secondary structure of peptides (Whitmore and Wallace, 2004). CDSSTR programme was used to analyse data (Compton and Johnson, 1986) with Set 4 as a reference set. Results were expressed as percentage of
18 particular secondary structure in total peptide. Data was processed using JASCO’s Spectra Manager and DichroWeb.
Table 5. Parameters for CD scans Parameter Value
Sensitivity Standard (100mdeg)
Start 260 nm
End 180 nm
Data Pitch 0.2 nm Scanning Mode Continuous Scanning Speed 100 nm/min
Response 1 s
Band Width 1.0 nm Number of
Accumulations 3
3.3.5. CALORIMETRIC MEASUREMENTS
DPPG and DPPC multilamellar liposomes suspended in PBS were subjected to differential scanning calorimetry (DSC) analysis in a microcalorimeter, both alone and with different concentration of peptides that were added during the film hydration stage. PBS was used as reference. Scan parameters are shown in Table 6. Sample preparation is specified in Table 7. After measurements, thermogram baseline was corrected and normalised to the mass of phospholipid. The phase transition temperature was defined as the temperature at the peak maximum. Phase transition enthalpies were calculated by integration of the peak areas. Data was processed using Origin software.
Table 6. Parameters for DSC scans
Number of Scans 6 (3 heating and 3 cooling) Starting Temperature 10 ºC
Final Temperature 55 ºC
Scan Rate 30 ºC/min
Prescan Equilibration 15 min Postscan Thermostat 0 min
19 Table 7. Samples analysed with DSC.
Sample (V=1 ml) lipid concentration (mg/ml) lipid concentration (µmol/ml) peptide concentration (µmol/ml) lipid-to-peptide molar ratio DPPG pure 1 1.34 - - DPPG + OP-145 2% 0.027 50:1 DPPG + OP-145 4% 0.054 25:1 DPPG + P148 1% 1 1.34 0.013 100:1 DPPG + P148 2% 0.027 50:1 DPPG + P148 4% 0.054 25:1 DPPG + P276 1% 0.013 100:1 DPPG + P276 2% 0.027 50:1 DPPG + P276 4% 0.054 25:1 DPPC pure 1 1.36 - - DPPC + OP-145 4% 0.054 25:1 DPPC + P148 4% 0.054 25:1 DPPC + P276 4% 0.054 25:1
3.3.6. SIZE MEASUREMENT OF LIPOSOMES
Liposomes size was measured using dynamic light scattering (DLS) with Zetasizer Nano at automatic mode. POPG and POPC liposomes in concentrations of 1 mg/ml of PBS buffer were extruded through 0.1 µm membranes prior to measurement to reduce them to unilamellar vesicles. 1 ml of PBS filtered through a 0.1 µm filter was put in a quartz cuvette. 50 µl of liposome suspension, with or without peptide, was added to the cuvette, mixed by pulling the liquid in and out of the pipette and the sample was measured. Both types of vesicles were analysed alone and with all three peptides at different concentrations (100:1, 25:1 and 6.25:1 lipid:peptide molar ratios). Measurements were made at 0, 15, 30 and 60 minutes from adding peptides at room temperature.
20 3.3.7. VESICLE LEAKAGE ASSAY - FLUOROMETRY
A modified assay by Ellens et al. was performed to establish the degree of vesicle leakage induced by the peptides (Ellens et al., 1985).
3.3.7.1. PREPARATION OF FLUORESCENT DYE-CONTAINING VESICLES
20 mg POPC, POPC/cholesterol and POPG films were hydrated with 1 ml of 12.5 mM ANTS, 45 mM DPX, 68 mM sodium chloride, 10 mM HEPES, pH=7.4 buffer (HEPESF) and
incubated for 1.5 h at 30 ºC with intermittent vortexing at 5, 10, 25, 40, 55, 75 and 85 minutes from start. After cooling to room temperature fluorescent dye-containing liposomes were extruded 15 times through a 0.1 µm pore size membrane filter to achieve unilamellarity and subjected to gel filtration (size-exclusion chromatography – stationary phase: Sephadex™ G-75; eluent: 10 mM HEPES, 140 mM sodium chloride, 1 mM EDTA, pH=7.4 buffer (HEPESE)). First 40 drops were discarded; subsequently, every 10 drops were separately
collected into fractions. These fractions were subjected to a Cary Eclipse fluorescence spectrophotometer with excitation at 360 nm and emission at 530 nm to determine which ones have the highest concentration of liposomes. The most adequate fractions were combined and used thereafter. Exact phospholipid concentration was determined by phosphate analysis (Bartlett, 1959).
3.3.7.2. FLUORESCENCE MEASUREMENT – VESICLE LEAKAGE ASSAY
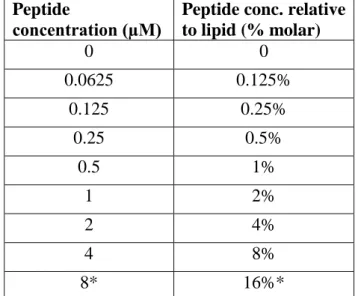
All measurements were performed at 37 ºC with magnetic stirring at constant speed. Required volume of liposome sample was added into 2 ml of PBS in a quartz cuvette to achieve a final lipid concentration of 50 µM and measured using an excitation wavelength of 360 nm, emission wavelength of 530 nm and a 10 nm slit width for both excitation and emission monochromators to determine initial fluorescence. Next, increasing concentrations of different peptides were added and fluorescence was measured after 15 min of incubation. At the end, 10 µl of 10% Triton™ X-100 detergent was added to determine total fluorescence. Peptide concentrations are specified in Table 8. Fluorometry results were expressed in arbitrary units. To show the degree of fluorophore leakage from vesicles, data was presented
21 in terms of fluorescence intensity and expressed as percentage according to the following formula (Zweytick et al., 2011):
𝑰𝑭 =
𝑭 − 𝑭𝟎 𝑭𝒎𝒂𝒙− 𝑭𝟎
∙ 𝟏𝟎𝟎%
where F is the measured fluorescence, F0 is initial fluorescence (without peptides) and Fmax is
total fluorescence after liposome disintegration with detergent.
To prepare POPG vesicles with peptidoglycan, PGN was first dissolved in PBS, heating it for 15 min at 95 ºC, to a concentration of 0.5 mg/ml. Heating is used to deactivate proteases that have previously been found in commercial PGN samples, so as not to degrade the peptides. 4 µl of this solution was added together with the required volume of POPG sample into 2 ml of PBS to a final concentration of 50 µM POPG and 0.01% weight PGN. It was then proceeded as described earlier.
Table 8. Peptide concentrations in leakage assays. (*only certain measurements) Peptide
concentration (µM)
Peptide conc. relative to lipid (% molar) 0 0 0.0625 0.125% 0.125 0.25% 0.25 0.5% 0.5 1% 1 2% 2 4% 4 8% 8* 16%*
3.3.7.3. VESICLE LEAKAGE ASSAY IN PRESENCE OF BOVINE SERUM
POPC and POPG fluorescent dye-containing vesicles were subjected to a leakage assay in the presence of selected concentrations of peptides and two different concentrations of bovine serum: 10% and 25% (V/V), whereas the total volume was kept at 2 ml. Procedure was as described in section 3.2.7.2. Peptide concentrations are given as follows:
22 1. OP-145 was analysed with POPC and POPG in the presence of 10% and 25% serum
through all concentrations as specified in Table 8;
2. P148 was analysed with POPC in the presence of 10% and 25% serum through all concentrations as specified in Table 8. With POPG, only concentrations of 0.0625, 0.5 and 4 µM were analysed in the presence of 10% serum as it was shown that bovine serum alone causes near complete leakage from POPG vesicles.
3. P276 was not analysed.
3.3.7.4. VESICLE LEAKAGE IN PRESENCE OF BOVINE SERUM ALBUMIN
In order to examine the effect of bovine serum albumin (BSA) on membrane permeability properties of AMPs, leakage experiments were performed with BSA concentrations ranging from 0 to 9 % molar on POPG and POPC vesicles. Fluorescent dye-containing POPG and POPC vesicles were separately diluted in a quartz cuvette containing 1.85 ml of PBS to a total concentration of 50 μM and initial fluorescence was measured. Increasing amounts of BSA standard were consecutively added and fluorescence measured when the signal had been stabilised. In the end 10 µl of 10% Triton™ X-100 was added to determine total fluorescence. BSA concentrations are given in Table 9.
Table 9. BSA concentration in fluorometry assays BSA concentration
(µM)
peptide conc. relative to lipid (% molar) 0 0 0.0625 0.125% 0.125 0.25% 0.25 0.5% 0.5 1% 1 2% 2 4% 4 8% 4.5 9%
23 3.3.8. PEPTIDE-LIPID AFFINITY ASSAY
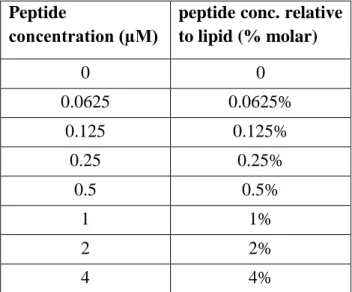
Fluorescent dye-containing POPG vesicles were mixed at the same concentration with non-dye containing POPC unilamellar vesicles and vice-versa and added into 2 ml PBS in a quartz cuvette to a total lipid concentration of 100 µM. It was then processed as described in section 3.2.7.2. Peptide concentrations are given in Table 10.
Table 10. Peptide concentration in peptide-lipid affinity leakage assays Peptide
concentration (µM)
peptide conc. relative to lipid (% molar) 0 0 0.0625 0.0625% 0.125 0.125% 0.25 0.25% 0.5 0.5% 1 1% 2 2% 4 4%
24 4. RESULTS
4.1. IN SILICO STRUCTURAL PROPERTIES OF AMPS
4.1.1. OP-145
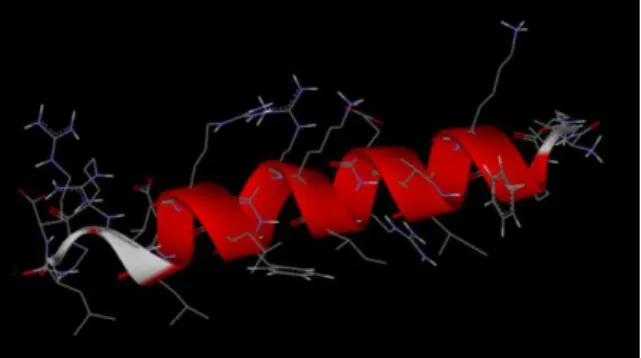
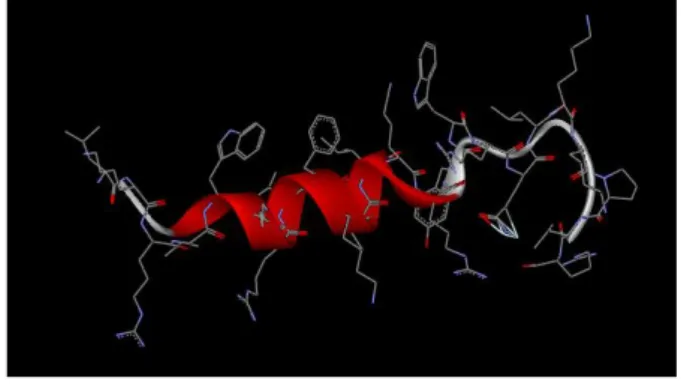
Secondary structure predicted by PEP-FOLD 2.0 for OP-145 was mostly alpha helical as depicted on Figures 5-7. Hydrophobic residues of the predicted alpha helix are segregated on the one side and hydrophilic regions on the other side, forming an ideal amphipathic helix (Figure 8).
Figure 7. OP-145 model alpha helix backbone displayed as a ribbon.
Figure 8. Hydrophilic (left) and hydrophobic (right) domains of OP-145 model alpha helix (in yellow).
Figure 6. OP-145 alpha helix viewed along the main axis (N to C terminus). Figure 5. Side view of OP-145
25 Figure 9. Computer-generated model of P148
secondary structure. Alpha helix shown as red ribbon. 4.1.2. P148
Secondary structure predicted by PEP-FOLD 2.0 for P148 was slightly less alpha helical than the one of OP-145 (Figure 9), however hydrophilic and hydrophobic domains were located opposite one another to form an amphipathic helix, as with OP-145 (Figure 10). In addition, P148 exhibit large non-flexible tail on C terminus which does not fold into a helix.
26 4.1.3. P276
Secondary structure predicted by PEP-FOLD 2.0 for P276 was very similar to P148 (Figure 11), both in helicity and hydropathic domains (Figure 12) again showing an unordered C-terminus tail.
Figure 12. P276 hydrophilic (left) and hydrophobic (right) alpha helix domains (in yellow). Figure 11. Computer-generated model of P276 secondary
27 4.2. SECONDARY STRUCTURE DETERMINATION OF PEPTIDES
In order to validate the data from prediction analysis CD spectroscopy has been performed. CD spectra of analysed AMPs have been recorded in presence of HEPES buffer, negatively charged SDS micelles and POPG vesicles as well as zwitterionic DPC micelles POPC vesicles mimicking bacterial and mammalian membrane, respectively. In addition, time-dependent measurements between 0 and 60 min upon incubation with membrane mimics have been performed in order to follow secondary structure formation/development on lipid membranes.
4.2.1. OP-145
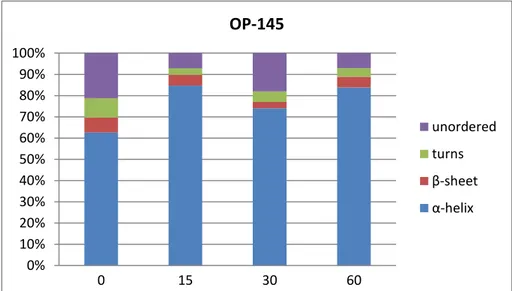
CD measurements and subsequent data processing have shown that OP-145 takes a mostly alpha helical secondary structure both in buffer and in contact with POPC and DPC that seems to be stable over time (Figures 13, 16 and 17). On the other hand, in interaction with POPG and SDS, the alpha helicity of the secondary structure of OP-145 diminishes over time and with the increase of the peptide’s concentration, falling from around 60-80% alpha helix in a lipid to peptide ratio of 100:1 to around 10% at 60 minutes at a ratio of 6.25:1 (Figures 14 and 15).
Figure 13. OP-145 time-dependent secondary structure in buffer. Time is expressed in min. 0% 10% 20% 30% 40% 50% 60% 70% 80% 90% 100% 0 15 30 60 OP-145 unordered turns β-sheet α-helix
28 Figure 14. OP-145 time-dependent secondary structure in interaction with SDS at different
molar ratios. Time is expressed in minutes. (*data is lacking)
Figure 15. OP-145 time-dependent secondary structure in interaction with POPG at different molar ratios. Time is expressed in minutes.
Figure 16. OP-145 time-dependent secondary structure in interaction with DPC at different molar ratios. Time is expressed in minutes. (*data is lacking)
0% 10% 20% 30% 40% 50% 60% 70% 80% 90% 100% 0 15 30 60 0 15 30 60 0 15 30 60 SDS 100:1 SDS 25:1 SDS 6.25:1 OP-145+SDS unordered turns β-sheet α-helix * 0% 10% 20% 30% 40% 50% 60% 70% 80% 90% 100% 0 15 30 60 0 15 30 60 0 15 30 60
POPG 100:1 POPG 25:1 POPG 6.25:1
OP-145 + POPG unordered turns β-sheet α-helix 0% 10% 20% 30% 40% 50% 60% 70% 80% 90% 100% 0 15 30 60 0 15 30 60 0 15 30 60 DPC 100:1 DPC 25:1 DPC 6.25:1 OP-145+DPC unordered turns β-sheet α-helix *
29 Figure 17. OP-145 time-dependent secondary structure in interaction with POPC at different
molar ratios. Time is expressed in minutes.
4.2.2. P148
Results show that P148 does not take an alpha helical secondary structure when measured in buffer (Figure 18). However, in contact with both prokaryotic and eukaryotic model membranes, at lower peptide concentrations, it has a rather large proportion of alpha helix in its secondary structure. With an increase in peptide concentration, the portion of alpha helix diminishes, especially in contact with POPC membranes (Figures 19-22).
Figure 18. P148 time-dependent secondary structure in buffer. Time is expressed in min. 0% 10% 20% 30% 40% 50% 60% 70% 80% 90% 100% 0 15 30 60 0 15 30 60 0 15 30 60
POPC 100:1 POPC 25:1 POPC 6.25:1
OP-145 + POPC unordered turns β-sheet α-helix 0% 10% 20% 30% 40% 50% 60% 70% 80% 90% 100% 0 15 30 60 P148 unordered turns β-sheet α-helix
30 Figure 19. OP-145 time-dependent secondary structure in interaction with SDS at different
molar ratios. Time is expressed in minutes.
Figure 20. P148 time-dependent secondary structure in interaction with POPG at different molar ratios. Time is expressed in minutes.
Figure 21. OP-145 time-dependent secondary structure in interaction with DPC at different molar ratios. Time is expressed in minutes. (*data is lacking)
0% 10% 20% 30% 40% 50% 60% 70% 80% 90% 100% 0 15 30 60 0 15 30 60 0 15 30 60 SDS 100:1 SDS 25:1 SDS 6.25:1 P148+SDS unordered turns β-sheet α-helix 0% 10% 20% 30% 40% 50% 60% 70% 80% 90% 100% 0 15 30 60 0 15 30 60 0 15 30 60
POPG 100:1 POPG 25:1 POPG 6.25:1
P148 + POPG unordered turns β-sheet α-helix 0% 10% 20% 30% 40% 50% 60% 70% 80% 90% 100% 0 15 30 60 0 15 30 60 0 15 30 60 DPC 100:1 DPC 25:1 DPC 6.25:1 P148+DPC unordered turns β-sheet α-helix * * *
31 Figure 22. P148 time-dependent secondary structure in interaction with POPC at different
molar ratios. Time is expressed in minutes.
4.2.3 P276
Measurement results show that P276 does not take an alpha helical conformation in buffer (Figure 23). The proportion of alpha helix is quite high in SDS and DPC micelles, around 60% (Figures 24 and 26), while in contact with POPG and POPC membranes secondary structure again seems to diminish with the increase of peptide’s concentration, especially with POPC (Figures 25 and 27). However, results seems to be unstable over time, so it cannot be estimated how precise they are, especially for POPG.
Figure 23. P276 time-dependent secondary structure in buffer. Time is expressed in min. 0% 10% 20% 30% 40% 50% 60% 70% 80% 90% 100% 0 15 30 60 0 15 30 60 0 15 30 60
POPC 100:1 POPC 25:1 POPC 6.25:1
P148 + POPC unordered turns β-sheet α-helix 0% 10% 20% 30% 40% 50% 60% 70% 80% 90% 100% 0 15 30 60 P276 unordered turns β-sheet α-helix
32 Figure 24. P276 time-dependent secondary structure in interaction with SDS at different
molar ratios. Time is expressed in minutes.
Figure 25. P276 time-dependent secondary structure in interaction with POPG at different molar ratios. Time is expressed in minutes.
Figure 26. P276 time-dependent secondary structure in interaction with DPC at different molar ratios. Time is expressed in minutes. (*data is lacking)
0% 10% 20% 30% 40% 50% 60% 70% 80% 90% 100% 0 15 30 60 0 15 30 60 0 15 30 60 SDS 100:1 SDS 25:1 SDS 6.25:1 P276+SDS unordered turns β-sheet α-helix 0% 10% 20% 30% 40% 50% 60% 70% 80% 90% 100% 0 15 30 60 0 15 30 60 0 15 30 60
POPG 100:1 POPG 25:1 POPG 6.25:1
P276 + POPG unordered turns β-sheet α-helix 0% 10% 20% 30% 40% 50% 60% 70% 80% 90% 100% 0 15 30 60 0 15 30 60 DPC 100:1 DPC 25:1 P276+DPC unordered turns β-sheet α-helix * *
33 Figure 27. P276 time-dependent secondary structure in interaction with POPC at different
molar ratios. Time is expressed in minutes. (*data is lacking)
4.3. SIZE MEASUREMENT OF LIPOSOMES
Dynamic light scattering measurements were performed to measure the size of liposomes in contact with different concentrations of peptides in order to determine the impact of vesicle size on secondary structure of peptides and to check the stability of liposomes over time. Results are shown in Figures 28 and 29 as POPG and POPC liposomes size dependent on peptide concentration and time. Data obtained from dynamic light scattering measurements was expressed as Z-average diameter.
The size of POPG liposomes in interaction with OP-145 has increased nearly three-fold over time with the increase of peptide concentration, from around 150 nm to about 450 nm. Further, size of POPG liposomes in combination with P148 and P276 does not change with the addition of 1% peptide. It then seems to increase mildly, roughly by 15%, with peptide concentration 4 times higher than the starting one; further addition of peptide to a concentration 16 times higher than the starting one seems to decrease the size slightly by around 10% from the pure liposome size.
The size of POPC liposomes seems to be stable regardless of peptide concentration and passage of time. Pure liposome sizes of both POPG and POPC have shown to be stable over time and are given for reference.
Polydispersity indices (PDIs) that show the width of size distribution are shown in Tables 11 and 12. Values between 0.1 and 0.4, such as the ones obtained from these measurements, indicate an intermediate or moderate size distribution (www.malvern.com).
0% 10% 20% 30% 40% 50% 60% 70% 80% 90% 100% 0 15 30 60 0 15 30 60 0 15 30 60
POPC 100:1 POPC 25:1 POPC 6.25:1
P276 + POPC unordered turns β-sheet α-helix * *
34 Figure 28. POPG liposomes size dependent on peptides concentration (given as lipid:peptide
molar ratio) and time (given in min)
Figure 29. POPC liposomes size dependent on peptides concentration (given as lipid:peptide molar ratio) and time (given in min)
0 50 100 150 200 250 300 350 400 450 500 POPG 0 15 30 60 0 15 30 60 0 15 30 60 100:1 25:1 6.25:1 Z-av e rag e d iam e te r (n m )
POPG vesicle size
POPG OP-145 P148 P276 0 20 40 60 80 100 120 140 160 POPC 0 15 30 60 0 15 30 60 0 15 30 60 100:1 25:1 6.25:1 Z-av e rag e d iam e te r (n m )
POPC vesicle size
POPC OP-145 P148 P276
35 Table 11. Particle size polydispersity indices (PDIs) of POPG vesicles.
POPG pure 0.087 PDI
Time (min) OP-145 P148 P276
100:1 0 0.205 0.215 0.168 15 0.223 0.206 0.212 30 0.166 0.204 0.241 60 0.365 0.213 0.244 25:1 0 0.332 0.147 0.138 15 0.271 0.127 0.158 30 0.206 0.138 0.141 60 0.34 0.161 0.143 6.25:1 0 0.276 0.126 0.123 15 0.176 0.198 0.164 30 0.171 0.136 0.139 60 0.203 0.144 0.138
Table 12. Particle size polydispersity indices (PDIs) of POPC vesicles.
POPC pure 0.059 PDI
Time (min) OP-145 P148 P276
100:1 0 0.07 0.068 0.144 15 0.089 0.049 0.051 30 0.066 - 0.052 60 0.053 0.195 0.052 25:1 0 0.063 0.079 0.09 15 0.039 0.086 0.157 30 0.064 - 0.076 60 0.027 0.021 0.041 6.25:1 0 0.051 0.077 0.109 15 0.027 0.038 0.1 30 0.061 0.078 0.101 60 0.045 0.059 0.089
36 4.4. CALORIMETRIC MEASUREMENTS: INTERACTION OF AMPS WITH BACTERIAL AND MAMMALIAN MODEL MEMBRANES
In order to assess the interaction of AMPs with model membranes, differential scanning calorimetry measurements were performed of liposomes composed of DPPG and DPPC. Both phospholipids have characteristic phase transition behaviour (Figure 30 and 31) that can be described by typical parameters, e.g. phase transition temperature, transition enthalpy and half width summarized in Table 13 and 14.
Upon interaction of OP-145 with DPPG, the phase transition temperature of DPPG increased in heating scans by about 1 °C. DPPG transition temperatures in contact with other peptides at different concentrations are largely unaffected, except for P276 at a 25:1 lipid:P276 ratio which shifts the transition towards a lower value by 0.7 °C. Transition enthalpies are to a great extent unaffected; the highest concentration of P148 (25:1 lipid:peptide ratio) stands out as the only concentration at which enthalpy has decreased by more than 10% from the pure lipid value. Pretransitions have completely disappeared in lipid:peptide ratios of 50:1 and lower (meaning higher concentration of peptides).
On the other hand, cooling scans are showing strong shifts in transition temperatures of DPPG at high peptide concentration, with OP-145 and P276 causing mutually comparable shifts of nearly 2 °C towards lower values and P148 showing a weaker, but still highly prominent shift of 0.7 °C. Lower concentrations seem to cause no effect on the phase transition temperature, except the 100:1 lipid:P148 ratio, which causes a peak splitting. This indicates a formation of two different domains, a peptide-rich DPPG domain and peptide-poor domain. Enthalpies also seem to differ from the reference value, but it cannot be assessed if those differences are of any significance.
37 Figure 30. Heating DSC thermograms of DPPG combined with peptides in different molar
ratios. *pretransition
Table 13. Specific enthalpies and transition temperatures of DPPG vesicles combined with peptides in different molar ratios (heating scans).
* PRETRANSITION MAIN TRANSITION Tm (°C) ΔHmpre (kcal/mol) ΔT1/2 Tm (°C) ΔHm (kcal/mol) ΔT1/2 pure DPPG 33.6 1.5 3.90 40.9 10.0 0.42 OP-145 50:1 - - - 41.7 10.3 0.87 OP-145 25:1 - - - 41.7 9.8 0.52 P148 100:1 33.3 0.4 2.59 41.0 9.2 0.69 P148 50:1 - - - 41.0 10.4 1.04 P148 25:1 - - - 41.0 8.8 1.05 P276 100:1 32.6 0.5 5.08 41.0 9.6 0.90 P276 50:1 - - - 40.9 9.6 0.73 P276 25:1 - - - 40.2 9.7 1.30
38 Figure 31. Cooling DSC thermograms of DPPG combined with peptides in different molar
ratios.
Table 14. Specific enthalpies and transition temperatures of DPPG vesicles combined with peptides in different molar ratios (cooling scans). MAIN TRANSITION Tm (°C) ΔHm (kcal/mol) ΔT1/2 pure DPPG 40.5 8.6 0.35 OP-145 50:1 40.6 10.2 0.53 OP-145 25:1 38.7 9.1 0.75 P148 100:1 40.5 6.3 0.59 P148 50:1 40.8 11.2 0.70 P148 25:1 39.8 7.6 0.53 P276 100:1 40.7 9.0 0.72 P276 50:1 40.6 8.5 0.58 P276 25:1 38.6 9.3 0.68
39 DPPC thermograms show a strong influence of peptides on the thermotropic phase behaviour of DPPC (Figures 32 and 33 and Tables 15 and 16). All three peptides, at the single analysed concentration, i.e. ratio of 25:1 lipid:peptide, cause the main transition peak to split into three smaller, but much broader peaks (with much higher ΔT1/2 values), one below, one at and the
third above the DPPC main transition temperature. As with DPPG, the pretransition peak disappears in interaction with all three peptides. The cooling scans show quite a similar profile. In both cases, transition enthalpies are significantly lower, more pronounced in the case of addition of P148 and P276 than for OP-145.
40 Figure 32. Heating DSC thermograms of DPPC combined with peptides in molar ratio of
25:1. +pretransition, *peptide rich domain, #peptide poor domain
Table 15. Specific enthalpies and transition temperatures of DPPC vesicles combined with peptides in molar ratio of 25:1 (heating scans). *peptide rich domain, #peptide poor domain
PRETRANSITION MAIN TRANSITION Tm (°C) ΔHmpre (kcal/mol) ΔT1/2 Tm (°C) ΔHm (kcal/mol) ΔT1/2 DPPC 35.7 1.1 1.92 41.8 8.2 0.18 OP-145 25:1 - - - 40.9 2.1 1.10 * --> 41.9 0.9 0.73 --> 43.0 2.9 2.29 # P148 25:1 - - - 40.6 1.8 1.47 * --> 42.3 2.4 2.36 # P276 25:1 - - - 40.5 1.9 1.49 * --> 42.3 2.6 2.54 # + * * * # # #
41 Figure 33. Cooling DSC thermograms of DPPC combined with peptides in molar ratio of
25:1. *peptide rich domain, #peptide poor domain
Table 16. Specific enthalpies and transition temperatures of DPPC vesicles combined with peptides in molar ratio of 25:1 (cooling scans).
* * # * # # *peptide rich domain #peptide poor domain Tm (°C) ΔHmr (kcal/mol) ΔT1/2 Tm (°C) ΔHmp (kcal/mol) ΔT1/2 DPPC 41.4 8.1 0.11 OP-145 25:1 40.7 2.1 0.79 41.9 3.7 1.88 P148 25:1 40.4 2.0 1.67 42.1 2.6 2.43 P276 25:1 40.2 1.8 1.70 41.5 2.3 2.47
42 4.5. VESICLE LEAKAGE ASSAY: IMPACT OF PEPTIDES UPON MEMBRANE PERMEATION
Membrane-disturbing properties of AMPs have been tested on liposomes composed of POPG and POPC with entrapped fluorescent dye ANTS/DPX. The degree of release of fluorescent dye from the vesicles upon incubation with peptides was measured.
Results of leakage assay indicate that all three tested peptides exert a strong activity on POPG membrane (Figure 34). OP-145 may show a bit lower level of activity at lower concentrations, but at 2 μM concentration all peptides have caused a near 100% leakage. The same holds for POPG liposomes with PGN added as there is virtually no difference in comparison to pure POPG (Figure 335). OP-145’s activity at lower concentrations seems to have increased a bit, but the significance of this increase is questionable.
As for POPC, OP-145 shows a dramatically lower level of activity with less than 10% leakage caused at the same concentration at which P148 and P276 cause more than 90% leakage (Figure 36). Even at 8 μM OP-145 caused only 40% leakage. With the addition of 25% cholesterol into the membrane, OP-145’s activity did not change, while P276 and especially P148 show a slight decrease in their activity, but it was still significantly larger than for OP-145 (Figure 37).
Figure 34. Fluorescent dye leakage from POPG vesicles in interaction with peptides. 0 20 40 60 80 100 120 0 1 2 3 4 5 6 7 8 9 Leakag e (% ) Peptide concentration (μM) POPG OP-145 P148 P276
43 Figure 35. Fluorescent dye leakage from POPG vesicles in presence of PGN in interaction
with peptides
Figure 36. Fluorescent dye leakage from POPC vesicles in interaction with peptides
Figure 37. Fluorescent dye leakage from POPC/cholesterol vesicles in interaction with peptides 0 20 40 60 80 100 120 0 1 2 3 4 5 6 7 8 9 Leak ag e (% ) Peptide concentration (μM) POPC/CHOLESTEROL OP-145 P148 P276 0 20 40 60 80 100 120 0 1 2 3 4 5 6 7 8 9 Leak ag e (% ) Peptide concentration (μM) POPC OP-145 P148 P276 0 20 40 60 80 100 120 0 1 2 3 4 5 6 7 8 9 Leak ag e (% ) Peptide concentration (μM) POPG/PGN OP-145 P148 P276
44 4.5.1. IMPACT OF SERUM ON MEMBRANE PERMEABILITY ACTION OF AMPs
In order to discern more closely the correlation between AMP’s action on model membranes and living cells, leakage assay was also performed in the presence of bovine serum to mimic real organism conditions.
Addition of serum greatly diminishes activity of both tested peptides on POPC membranes (Figure 38), more so of OP-145 than of P148, and the decrease is greater with the increase of serum content. On the other hand, POPG vesicles show complete leakage when serum is added (Figure 39).
Figure 38. Leakage from POPC vesicles in interaction with peptides in presence of 10% and 25% bovine serum. 0.0 10.0 20.0 30.0 40.0 50.0 60.0 70.0 80.0 90.0 100.0 0 1 2 3 4 5 6 7 8 9 Leakag e (% ) Peptide concentration (μM) POPC OP-145 + 10% serum P148 + 10% serum OP-145 + 25% serum P148 + 25% serum
45 Figure 39. Leakage from POPG vesicles in interaction with peptides in presence of 10% and
25% bovine serum. All values are at 100%.
4.5.2. EFFECT OF BSA ON MEMBRANE PERMEABILITY ACTION OF AMPs
Leakage experiments were performed with bovine serum albumin (BSA) in different concentrations in order to examine the effect of BSA on membrane permeability of AMPs. Dependence of POPG vesicles leakage on concentration of BSA is nearly linear. Complete leakage is achieved around 5 μM BSA. Contrary to POPG, POPC vesicles show negligible leakage when exposed to pure BSA. Results are shown on Figure 40. Linear fit was calculated using the least squares method. R-squared values are given for reference.
Figure 40. POPG and POPC vesicles leakage in interaction with BSA 0.0 10.0 20.0 30.0 40.0 50.0 60.0 70.0 80.0 90.0 100.0 0 1 2 3 4 5 6 7 8 9 Leak ag e (% ) Peptide concentration (μM) POPG OP-145 + 10% serum P148 + 10% serum OP-145 in 25% serum y = 19.781x + 4.5415 R² = 0.9695 y = 0.9388x + 0.346 R² = 0.9504 0.0 10.0 20.0 30.0 40.0 50.0 60.0 70.0 80.0 90.0 100.0 0 0.5 1 1.5 2 2.5 3 3.5 4 4.5 5 Leak ag e (% ) BSA concentration (μM) POPG/POPC + BSA POPG POPC
46 4.6. PEPTIDE-LIPID AFFINITY ASSAY: AMPs’ DISCRIMINATION BETWEEN MEMBRANES
In order to determine peptides’ relative affinity towards PG and PC, an experiment was performed that would show which lipid species is preferred for the peptide to act upon in the presence of both vesicle types.
This experiment showed that OP-145 induces stronger leakage from POPG vesicles even in the presence of POPC. If both species are present in equal concentrations, one labelled and the other not, OP-145 would preferably target POPG (Figure 41). In contrast to this, P148 and P276 show no such selectivity as all leakages from all combinations of liposomes are similar (Figures 42 and 43). It is noteworthy that the total concentration of lipids in mixed POPG/POPC experiments is 100 μM, while in single liposome species experiment it is 50 μM. Therefore, peptide concentrations and molar ratios need to be taken into account when interpreting this data.
Figure 41. OP-145’s affinity towards POPG and POPC vesicles and their combinations (lab.=fluorescent dye-containing vesicles)
0 20 40 60 80 100 120 0 0.5 1 1.5 2 2.5 3 3.5 4 4.5 Leakag e (% ) Peptide concentration (μM) OP-145 POPC/POPG lab. POPG/POPC lab. POPG lab. POPC lab.
47 Figure 42. P148’s affinity towards POPG and POPC vesicles and their combinations
(lab.=fluorescent dye-containing vesicles)
Figure 43. P276’s affinity towards POPG and POPC vesicles and their combinations (lab.=fluorescent dye-containing vesicles)
0 20 40 60 80 100 120 0 0.5 1 1.5 2 2.5 3 3.5 4 4.5 Leakag e (% ) Peptide concentration (μM) P148 POPG/POPC lab. POPC/POPG lab. POPG lab. POPC lab. 0 20 40 60 80 100 120 0 0.5 1 1.5 2 2.5 3 3.5 4 4.5 Leak ag e (% ) Peptide concentration (μM) P276 POPG/POPC lab. POPC/POPG lab. POPG lab. POPC lab.