How to cite:
Cahyani DI, Puryatni A, Permatasari N (2017) Cysteine, Malondyaldehide (MDA) and Glutathione (GSH) Levels in Marasmic Type Malnutrition and Well-Nourished Children in Saiful Anwar Hospital. J. Trop. Life. Science 7 (2): 151 – 157. *Corresponding author:
Dwi Indah Cahyani
Department of Pediatrics, Faculty of Medicine, Brawijaya University
Jalan Veteran, Malang, Indonesia 65145 E-mail: mamaracha82@gmail.com
Cysteine, Malondyaldehide (MDA) and Glutathione (GSH) Levels in Marasmic Type Malnutrition
and Well-Nourished Children in Saiful Anwar Hospital
Dwi Indah Cahyani 1, 4*, Anik Puryatni 2, 5, Nur Permatasari 3
1 Department of Pediatrics, Faculty of Medicine, Brawijaya University, Malang, Indonesia
2 Department of Nutrition and Metabolic Disease Division-Pediatric, Faculty of Medicine, Brawijaya University, Malang, Indonesia 3 Department of Biomedics, Faculty of Medicine, Brawijaya University, Malang, Indonesia
4 Department of Pediatrics, Saiful Anwar Public Hospital,Malang, Indonesia
5 Department of Nutrition and Metabolic Disease Division-Pediatric, Saiful Anwar Public Hospital, Malang, Indonesia
ABSTRACT
Micronutrien deficiency in severe malnutrition will reduce antioxidant capacity that needed for oxidative stress defense. Cysteine, a non-essential amino acid, is one of an important component for reduced gluthatione (GSH). This study aims to prove the difference between the levels of cysteine, MDA and GSH levels in children with marasmic malnutrition and well-nourished children and prove whether there is a relationship between those param-eters. Fiftysix patients participated in this study were grouped into two groups of samples that were marasmic type malnutrition group (28 patients) and control groups that were well nourished group (28 patients). Examination begins with a complete laboratory screening, followed by examination of cysteine, MDA and GSH level. Of the 28 patients included in marasmic type malnutrition group consisting of 15 male patients (53.6%) and 13 female patients (46.4%), while the well-nourished group consisted of 13 male patients (46.4%) and 15 female patients (53.6%). The average age is 54.61±56.35 months in the group of marasmic type malnutrition and 48.25±45.34 months in the well-nourished group. By using the Mann Whitney test, there were significant difference between the levels of cysteine and GSH in marasmic malnutrition and control group (p=0.000 and p=0.000 respectively). Spearman correlation test between cysteine and GSH levels, cysteine and MDA levels, MDA and GSH levels in marasmic malnutrition children shows no significant correlation (R = -0.206, p = 0.294; R = -0.036, p = 0.856; R = 0.210, p = 0.284 respec-tively). In well-nourished group Spearman correlation test between cysteine and GSH levels, cysteine and MDA levels, MDA and GSH levels also shows no significant correlation (R = 0.053, p=0.789; R = 0.146, p = 0.458; R = -0.079, p = 0.688 respectively). From this study it can be concluded that there are significant differences of the levels of cysteine and GSH between severe malnutrition groups compared with the control one. But this study shows no significant correlation between the levels of cysteine and GSH levels in marasmic type malnutrition and well-nour-ished children.
Keywords: Ganoderma lucidum, selectivity, colon cancer, COX-2
INTRODUCTION
Marasmic type malnutrition is one of significant health problem in developing countries. It contributes to 300.000 death among under-five children per year in developing countries and 50% mortality of children around the world. Significant morbidity related to im
tioxidant intake in diet (vitamin A, C and E) will also directly reduce antioxidant capacity in malnutrition chil-dren.4 Another micronutrient deficiency that occurred in malnutrition children are cuprum, zinc, selenium, glutathione and glutathione peroxidase [5, 6]. Prolonged infection or inflammation related with malnutrition pro-duced excessive free radicals. This condition will lead to oxidative stress [7]. Free radicals will promote lipid pe-roxidation that impact directly to tissue damage such as skin lesion and change of hair color. Then free radicals also act on protein or circulating lipoprotein that will induce sustainable liver injury to fatty liver. Malondyal-dehide (MDA), as one of lipid peroxidation product, then excessively produced. This oxidative stress lead to apoptotic acceleration that worsen patient prognosis.8
Cysteine is important source of sulphur compound in human and one of the important precursor of gluta-thione [9] Cysteine is one of amino acid that contribute to patomechanism of oxidative stress in malnutrition. Decrease of erythrocyte glutathione synthesis in malnu-trition children related with low concentration of cyste-ine and methioncyste-ine [10]. Malnourished children with infection has low concentration of cysteine that caused by decrease of proteolysis [11]. Cysteine also regulate redox state of skin and mucous membrane so that re-lated with evidence of hair damage, skin erosion, and intestinal mucous membrane atrophy and mucin deple-tion [12]. Glutathione (GSH) is a tripeptide that consists of glutamate, cysteine and glycine. It is a potent antiox-idant that also contribute for maintaining redox state of the cells [13, 14].
The purpose of this study is to prove the difference between the cysteine, MDA and GSH levels in children with marasmic type malnutrition than well-nourished ones, and verify whether there is a relationship between cysteine, MDA and GSH levels in both of the group.
MATERIALS AND METHODS Definitions used in this study
The dependent variable in this study is cysteine and GSH levels. Cysteine Levels measured in plasma using Enzyme Immuno Assay (ELISA). Cysteine levels nor-mally expressed in micromole/liter, which for men 43 µmole/liter (average 20 - 91 µmole/liter), for women 38 µmole/liter (average 19 - 96 µmole/liter) [15]. GSH lev-els in serum were analyzed by ELISA using a Human Glutathione (GSH) ELISA kit OXIS by units of mg/mL. Glutathione levels normally expressed in mg/dL, which for well-nourished children is 55.56 mg/dL, while for
marasmic type malnutrition is 46.62 mg/dL. Malondyal-dehide levels normally expressed in nmol/mL, which for wellnourished children 1.3 nmol/mL, while for maras-mic type malnutrition is 1.9 nmol/mL [16].
Independent variables used in this study is nutri-tional state that are marasmic type malnutrition and well nourished. Marasmic type malnutrition is defined as the measurement of weight compared to height/body length of less than -3 SD (standard deviation) or less than 70% or more below the average for the reference value of the National Center for Health Statistics, a child with clini-cal signs of malnutrition such as the xylophone ribs and old man face. Well nourish is defined as the measure-ment of weight compared to height between 90% to 110% (percentile), or between -2 SD (standard devia-tion) up to +2 SD for the reference value of the National Center for Health Statistics [3].
Study design and study population
This is an observational and analytic methods using cross sectional design study. The population were all children diagnosed with marasmic type malnutrition. Affordable population were children suffering from ma-rasmic type malnutrition and hospitalized in the pediat-ric ward General Hospital dr. Saiful Anwar Malang. Samples were children suffering from marasmic type malnutrition of stabilization phase and hospitalized at the General Hospital dr. Saiful Anwar Malang and met the inclusion criteria. All respondents in this study re-ceived an explanation of the research and parents are asked to sign the consent (informed consent). The sam-ple size used in this study was calculated using the for-mula sample calculation [16] and the results minimum number of samples was 28 for each group.
Inclusion and exclusion criteria
This study uses both inclusion and exclusion criteria in the sample and the control. In the sample inclusion criteria used were diagnosed with marasmic type malnu-trition, aged between 1 month to 14 years, and allow parents with children enrolled in the study after being given an explanation (informed consent). While exclu-sion criteria were used in the sample is suffering from an autoimmune disease, kidney disease, liver disease and suffering from malignant disease.
an autoimmune disease, kidney disease, liver disease and suffering from malignant disease.
Ethical consideration
The study was approved by the research ethics com-mittee of the Medical Faculty of Brawijaya University-dr. Saiful Anwar hospital. (Ethical Clearance no. 400/109/K.3/302/2016). Informed consent was obtained from mothers or legal guardians of all children.
Methods laboratory tests
Examination of Cysteine level. Cysteine level exam-ination using Creative Diagnostic Human ELISA kit cat No. DEIA5203 (ng/mL). The sample used in the form of plasma and can be stored longer at -20°C.
Examination of GSH level. Glutathione level exam-ination using Human GSH ELISA kit cat No 21040 (mg/dL). The sample used in the form of plasma and can be stored longer at -20°C.
Examination of MDA level. Malondialdehyde level examination using Bioxytech MDA-586 cat No 21044 (nmol/mL). The sample used in the form of plasma and can be stored longer at -20°C.
Statistical analysis
Initially the data cysteine, MDA and GSH levels were performed normality test (to determine the nor-mality of data) by using the Kolmogorov-Smirnov test and test variant (to determine the variant of data). If the distribution of data is normal and variants of data are
same, then used the unpaired t test. If data is abnormal, data will be transformed. If the new variable transfor-mation results are normally distributed, we used the un-paired t test. If the new variable transformation result is not normally distributed, the Mann-Whitney test was used. Pearson correlation test was used to examine the relationship between cysteine levels and GSH levels. Data were analyzed using a 95% confidence level (α= 0.05). All data were analyzed using the software Statisti-cal Package for the Social Sciences (SPSS 17.0) for Win-dows.
RESULTS AND DISCUSSION Baseline characteristic of sample
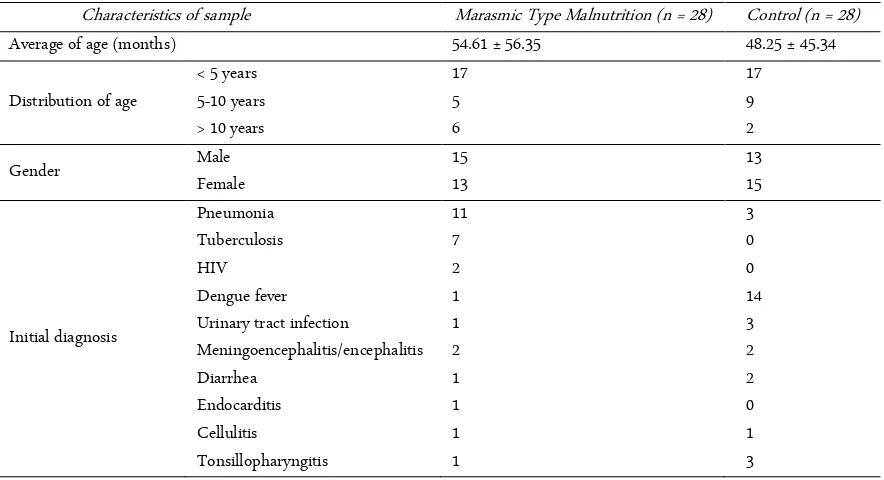
This is a cross-sectional study involving 56 samples that divided into two groups, namely marasmic type malnutrition group of 28 people and a control group of 28 people. Characteristics of the sample are shown in Table 1.
The average of age in marasmic type malnutrition the group is 54.61 ± 56.35 and the control group 48.25 ± 45.34. The lowest age of the marasmic type malnutri-tion group is 1 months and the highest age is 13 years old. The lowest age in the control group was 1 months and the highest age is 12 years old. Marasmic type mal-nutrition group consisted of 15 boys and 13 girls, while the control group consisted of 13 boys and 15 girls. Ma-jority infection in marasmic type malnutrition group was pneumonia and tuberculosis, while in the control group dengue fever was predominant. Laboratory data Table 1. Characteristics of sample
Characteristics of sample Marasmic Type Malnutrition (n = 28) Control (n = 28)
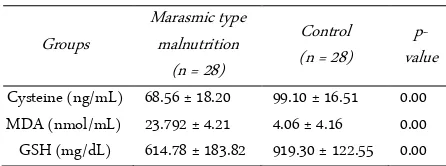
Table 2. Laboratory data Table 3. Cysteine, MDA and GSH levels in marasmic type
mal-nutrition and control group Groups
for the characteristics of the study sample are shown in Table 2.
According to the test of Shapiro-Wilk, cysteine, MDA and GSH levels in the two groups of samples ob-tained p-value less than 0.05, so it can be concluded that the data in this study were not normally distributed. Dif-ferent test conducted later in the levels of cysteine, MDA and GSH of the two groups using Mann-Whitney U test, and produce significant differences between groups of marasmic type malnutrition with the control group (p = 0.000, p = 0.000, p = 0.000 respectively) (Table 3).
Based on Pearson correlation results obtained in pa-tients with marasmic type malnutrition cysteine levels not significantly correlated with GSH levels (p = 0.294; r = 0.206), cysteine levels not significantly correlated with MDA levels (p = 0.856; r = -0.036) and also MDA levels not significantly correlated with GSH levels (p = 0.284; r = 0.210) (Figure 1-3). Thus it can be concluded that there is no significant correlation between the cys-teine and GSH levels, cyscys-teine and MDA levels and also MDA and GSH levels in marasmic type malnutrition group
Based on Pearson correlation results obtained in well-nourished patients cysteine levels not significantly correlated with GSH levels (p = 0.789; r = -0.053), cyste-ine levels not significantly correlated with MDA levels (p = 0.458; r = -0.146) and also MDA levels not signifi-cantly correlated with GSH levels (p = 0.688; r = -0.079)
(Figure 4-6). Thus it can be concluded that there is no significant correlation between the cysteine and GSH levels, cysteine and MDA levels and also MDA and GSH levels in the well-nourished group.
This study involved 56 samples that divided into two groups, namely marasmic type malnutrition group (28 samples) and a control group (28 samples). Group of marasmic type malnutrition characterized by the pres-ence of clinical symptoms like wasted, xylophone ribs, changes in hair color and hair that is easily removed, skin dermatoses, baggy pant, by measurement of anthro-pometric status where weight/height < -3 SD or percent-age of ideal body weight < 70%. Both marasmic type malnutrition group and the control group receiving treatment in hospital, with predominant concomitant diseases in marasmic type group was pneumonia and lung tuberculosis and dengue fever in the control group. Sample characteristics revealed that the age range is 1 month to 13 years old. From 28 samples of marasmic type malnutrition-patients, as many as 17 (17/28) sam-ples aged < 5 years. This is consistent with epidemiolog-ical data of malnutrition in the world, where the inci-dence of malnutrition, especially in Asian countries aged less than 5 years [17].
By sex or gender of the sample, it showed that num-ber of the male is greater than the female patient. The prevalence of children who suffer from malnutrition based on gender is different. The study conducted by Rahman et al. (2010) explain that the incidence of mal-nutrition is greater in male, as well as research that has been done by Hirani (2012) in Pakistan [17, 18]. While the research conducted by Jamro et al. (2012) in Paki-stan and Kuntari (2013) get different results where fe-male is greater than fe-male [19, 20].
trient deficiency [24, 25].
Levels of albumin obtained in this study showed
dif-ferences between groups of subject’s marasmic
malnu-trition than the control group. A study conducted by Muller et al. (2005) showed a decrease of albumin levels in malnutrition [24]. Research conducted by Avram et al. (2006) found that serum albumin can be used as an indicator of a person's nutrition [26]. Gupta and Lis (2010) explains that the most common indicators can be used to assess the nutritional status of a person is the serum albumin. Malnutrition and inflammation will suppress protein synthesis [27]. Low albumin levels in malnutritional condition occurs because of an imbalance between intake and protein needs.
Based on the levels of AST and ALT, this study found no differences between the two groups. A study conducted by Hyder et al. (2013) explain that the levels of AST and ALT increased on condition of viral hepatitis infection, alcohol use, and cirrhosis of the liver [28]. While the research conducted by Crawdury et al. (2007) get different results, which found elevated levels of AST and ALT in marasmic malnutrition patients [29]. In this research that we had excluded patients with liver disease and autoimmune diseases, so there were no differences between the two of groups.
This study also found no significant difference be-tween ureum and creatinine levels of marasmic malnu-trition group and the control group. Research conducted by Hary et al. (2007) found that decreased levels of se-rum creatinine in patients with malnutrition [30]. Im-paired renal function as exclusion criteria in this study might be done because renal dysfunction may be one factor confounding the results, which can influence lev-els of protein in patients.
Cysteine levels in this study showed significant dif-ferences between the samples of marasmic malnutrition compared to well-nourished controls. It is the same as research conducted by Jahoor et al. (2012) which explain decreased levels of cysteine in malnutritional condition. It also explained that the condition of malnourished children and infected then cysteine production is slower than the recovery period due to a decrease in protein breakdown [31]. The decline would actually appear larger on the type of kwashiorkor malnutrition [32].
In this study, glutathione level in marasmic type malnutrition group showed a significant difference com-pared to the control group. This concordance with a study conducted by Une (2013) that showed a decrease of antioxidant capacity in marasmic type malnutrition [33]. The decrease of glutathione level may be caused by
the decrease of synthesis or increase of antioxidant de-mand. The decrease of synthesis may be caused by amino acid deficiency. Glutathione composed by tripep-tide, glutamate, cysteine and glycine that catalyzed by glutathione synthetase [34]. As the antioxidant, gluta-thione will eliminate reactive oxygen and nitrogen spe-cies by direct interaction with reactive spespe-cies such as ROS, RNS, HO, HOCl, RO, RO2, 1O2 and ONOO- and form thiyl radicals (GS) [35]. Glutathione also act as the antioxidant on detoxification of lipid oxidation product that induced by ROS such as malondialdehyde and 4-hydroxy-2-nonenal [36, 37].
In this study, there was no significant association between cysteine and GSH levels in marasmic type mal-nutrition patients. Thus can be explained because cyste-ine was not the only precursor for GSH, the other amino acid such as glycine and glutamate might influence the GSH levels. The other condition might influence the GSH levels, such as level of NADPH that produced during pentose phosphate pathway. These parameters should be considered [35, 38]. According to Figure 1, although not significant, the relationship between cyste-ine and GSH was negative. This fact might be caused by the potency of cysteine to produce another toxic radical (hydroxyl radical) due to activation of arginase because of reaction between cysteine and Fe. As we know that during acute infection, oxidative hemolysis process will increase so that free Fe will be released to the circulation. The more end product of increment free radical produc-tion releasing to the circulaproduc-tion the more GSH con-sumption occurred [39].
CONCLUSION
Cysteine and GSH levels in marasmic malnutrition patients was significantly lower compared than well-nourished ones. There was no significant relationship between cysteine and GSH levels in marasmic type mal-nutrition patients.
ACKNOWLEDGMENT
We are grateful to the nurses, resident doctors, all of the biomedic and clinical pathology laboratory staff in the Department of Pediatrics, Faculty of Medicine, Brawijaya University-Saiful Anwar Public Hospital Ma-lang, who participated in the management of these chil-dren and data collection.
REFERENCES
and children. Zurich, UNICEF.
2. Departemen Kesehatan Republik Indonesia Direktorat Jen-deral Bina Kesehatan Masyarakat Direktorat Bina Gizi Masyarakat (2011) Buku Bagan Tatalaksana Anak Gizi Bu-ruk, Departemen Kesehatan RI, Jakarta.
3. Susanto, JC, Mexitalia, M, Nasar, SS (2011) Malnutrisi akut berat dan terapi nutrisi berbasis komunitas. buku ajar nu-trisi pediatrik dan penyakit metabolik Jilid I, Cetakan ke-1. Ikatan Dokter Anak Indonesia, Jakarta.
4. Catal F, Avci A, Karadag A et al. (2007) Oxidant and anti-oxidant status of Turkish marasmic children: A single cen-ter study.Journal of Trace Elements in Medicine and Biol-ogy 21 (2): 108–112. doi: 10.1016/j.jtemb.2007.01.003 5. Khare M, Mohanty C, Das BK et al. (2014) Free radicals
and antioxidant status in protein energy malnutrition. In-ternational Journal of Pediatrics 2014 (2014). doi: 10.1155/2014/254396.
6. Une L, Gupta S (2013) Micronutrient and antioxidant sta-tus in children with protein energy malnutrition. Asian Journal of Biomedical and Pharmaceutical Sciences 3 (20): 38-40.
7. Bosnak M, Kelekci S, Yel S et al. (2010) Oxidative stress in marasmic children: Relationship with leptin. European Journal of General Medicine 7 (1): 1-8.
8. Perampalli T, Swami SC, Kumbar KM et al. (2010) Possible role of oxidative stress in malnourished children. Current Pediatric Research 14 (1): 15-17.
9. Piste P (2013) Cysteine –Master antioxidant. International Journal of Pharmaceutical, Chemical and Biological Sci-ences 3 (1): 143-149.
10. Jahoor F (2012) Sulfur amino acids and severe childhood undernutrition. Nutrition Review 70 (3): 176-187. doi: 10.1111/j.1753-4887.2011.00462.x.
11. Jahoor F, Badaloo A, Reid M, Forrester T (2006) Sulfur amino acids metabolism in children with severe childhood undernutrition: Cysteine kinetics. The American Journal of Clinical Nutrition 84 (6): 1393-1399.
12. Badaloo A, Hsu JW, Bryan CT et al. (2012) Dietary cysteine is used more efficiently by children with severe acute mal-nutrition with edema compared with those without edema. The American Journal of Clinical Nutrition 95 (1): 84-90. doi: 10.3945/ajcn.111.024323.
13. Cooper AJL, Pinto JT, Callery PS (2011) Reversible and irreversible protein glutathionylation: Biological and clini-cal aspects. Expert Opinion on Drug Metabolism and Tox-icology 7 (7): 891–910. doi: 10.1517/17425255.2011.5777 38.
14. Jones DP, Park Y, Gletsu-Miller N (2011) Dietary sulfur amino acid effects on fasting plasma cysteine/cystine redox potential in humans. Nutrition 27 (2): 199–205. doi: 10.10
16/j.nut.2010.01.014.
15. Nimni ME, Han B, Cordoba F (2007) Are we getting enough sulfur in our diet?. Nutrition and Metabolism 4: 24. 16. Anuradha J, Meena V, Bal Khrisna A (2008) Serum zinc and malondialdehyde concentrations and their relation to total antioxidant capacity in protein energy malnutrition. Journal of Nutritional Science and Vitaminology 54 (5) 392-395. doi: /10.3177/jnsv.54.392.
17. Hirani SA (2012) Malnutrition in young Pakistani children. Journal of Ayub Medical College Abbottabad-Pakistan 24 (2): 150-153.
18. Rahman T, Hidayati SN, Hidajat B (2010) Role of free rad-icals in children with malnutrition. Folia Medica Indone-siana 46 (1): 7-14.
19. Jamro B, Junejo AA, Lal S et al. (2012) Risk factors for se-vere acute malnutritionin children under the age of five year in Sukkur. Pakistan Journal of Medical Research 51 (4): 111-113.
20. Kuntari T, Jamil NA, Sunarto, Kurniati O (2013) Faktor risiko malnutrisi pada balita. Jurnal Kesehatan Masyarakat Nasional 7 (12): 572-576.
21. Bhoite R, Lyer U (2011) Magnitude of malnutrition and iron deficiency anemia among rural school children: An ap-praisal. Asian Journal of Experimental Biological Sciences 2 (2): 354-361.
22. Frempong MA, Minkah B, Quaye L et al. (2012) Evaluation of changes in pro-inflammatory cytokines in malnourished children: A Ghanaian case study. Journal of Medical and Biomedical Sciences 1 (3): 21–28.
23. Yang W, Li X, Li Y et al. (2012) Anemia, malnutrition and their correlations with socio-demographic characteristics and feeding practices among infants aged 0-18 months in rural areas of Shaanxi province in Northwestern China: A cross-sectional study. BMC Public Health 12: 1127. doi: 10.1186/1471-2458-12-1127.
24. Muller O, Krawinkel M (2005) Malnutrition and health in developing countries. CMAJ 173 (3): 279-286. doi: 10.1503/cmaj.050342.
25. Shashidar HR (2014) Malnutrition. http://emedicine.med-scape.com/. Accessed: 17 May, 2014.
26. Avram MA, Chattopadhyay J, Fein PA, Mittman M (2006) Monitoring albumin level as an indicator of nutrition in uremia therapy. Nefrologia i Dializoterapia Polska 10 (4): 163-165.
27. Gupta D, Lis CG (2010) Pretreatment serum albumin as a predictor of cancer survival: A systematic review of the ep-idemiological literature. Nutrition Journal 9: 1-16. doi: 10.1186/1475-2891-9-69.
European Journal of Experimental Biology 3: 280-184. 29. Crawdury SI, Rahman Z, Haque M (2007) Serum aspartate
aminotransferase (AST) and alanine aminotransferase (ALT) levels in different grades of protein energy malnutri-tionJournal of Bangladesh Society of Physiologist 2: 17-19. doi: 10.3329/jbsp.v2i0.978.
30. Hary P, Bagga A, Mahajan P, Lakshmy R (2007) Effect of malnutrition on serum creatinine and cystatin C level. Pe-diatric Nephrology 22: 1757-1761. doi: 10.1007/s00467-007-0535-x.
31. Jahoor F (2012) Sulfur amino acids and severe childhood undernutrition. Nutrition Review 70 (3): 176-187. 32. Badaloo A, Hsu JW, Bryan CT et al. (2012) Dietary cysteine
is used more efficiently by children with severe acute mal-nutrition with edema compared with those without edema. The American Journal of Clinical Nutrition 95 (1): 84-90. doi: 10.3945/ajcn.111.024323.
33. Une L, Gupta S (2013) Micronutrient and antioxidant sta-tus in children with protein energy malnutrition. Asian Journal of Biomedical and Pharmaceutical Sciences 3 (20): 38-40.
34. Makarov P, Kropf S, Wiswedel I et al. (2006) Consumption of redox energy by glutathione metabolism contributes to
hypoxia/reoxygenation-induced injury in astrocytes. Mo-lecular and Cellular Biochemistry. 286 (1): 95–101. doi: 10.1007/s11010-005-9098-y.
35. Lushchak VI (2012) Glutathione homeostasis and func-tions: Potential targets for medical interventions. Journal of Amino Acid 2012 (2012): 1-26. doi: 10.1155/2012/736837. 36. Zhu X, Gallogly MM, Mieyal JJ et al. (2009) Covalent
cross-linking of glutathione and carnosine to proteins by 4-oxo-2-nonenal. Chemical Research in Toxicology. 22 (6): 1050–1059.doi: 10.1021/tx9000144.
37. Siems W, Crifo C, Capuozzo E et al. (2010) Metabolism of 4 hydroxy-2-nonenal in human polymorphonuclear leuko-cytes. Archives of Biochemistry and Biophysics 503 (20): 248–252. doi: 10.1016/j.abb.2010.08.018.
38. Lushchak VI (2011) Adaptive response to oxidative stress: bacteria, fungi, plants and animals. Comparative Biochem-istry and Physiology Part C: Toxicology & Pharmacology 153 (2): 175-90. doi: 10.1016/j.cbpc.2010.10.004.