QUALITY ASSESSMENT AND CONTROL OF OUTPUTS OF A NATIONWIDE
AGRICULTURAL LAND COVER MAPPING PROGRAM USING LIDAR: PHIL-LIDAR 2
PARMAP EXPERIENCE
H. M. Pagkalinawan1, N. B. Gatdula1, R. P. Jose1, T. M. Rollan1, E. M. Tañada1, S. Y. Magtalas1, D. G. Dela Torre1, P. A. Dela Cruz1, J. L. Aves1, G. D. Tan1, R. A. Apura1, C. P. Dimalanta1, A. C. Blanco1, 2
1Phil-LiDAR 2 Project 1 Agricultural Resources Extraction from LIDAR Surveys (PARMap) Training Center for Applied Geodesy and Photogrammetry, National Engineering Center
University of the Philippines - Diliman, Quezon City
2Department of Geodetic Engineering, College of Engineering, University of the Philippines - Diliman, Quezon City [email protected]
KEY WORDS: Agricultural Land Cover, Nationwide Mapping, Quality Assessment and Control, LiDAR, Object Based Image Analysis
ABSTRACT:
The Agricultural Resources Extraction from LiDAR Surveys (PARMAP) project component of the Nationwide Detailed Resources Assessment using LiDAR (Phil-LiDAR 2) Program aims to produce detailed agricultural maps using LiDAR. Agricultural land cover at crop level was classified through object based image analysis using Support Vector Machine as classifier and LiDAR derivatives from point cloud (2 points per sq.m.) and orthophoto (0.5-meter resolution) as inputs. An accuracy of at least 90%, assessed using validation points from the field and through image interpretation, was required before proceeding to post-processing and map lay-out. Knowledge sharing and capacity development facilitated by the University of the Philippines Diliman (UPD) enabled partner universities across the Philippines to produce outputs for their assigned region. Considering output layers were generated by multiple teams working on different landscape complexities with some degree of data quality variability, quality checking is crucial to ensure accuracy standards were met. UPD PARMap devised a centralized and end-to-end scheme divided into four steps – land classification, GIS post-processing, schema application, and map lay-out. At each step, a block is reviewed and, subsequently, either approved or returned with documentation on required revisions. Turnaround time of review is at least one block (area ranging from 10 to 580 sq. km.) per day. For coastal municipalities, an additional integration process to incorporate mapped coastal features was applied. Common problems observed during quality checking include misclassifications, gaps between features, incomplete attributes and missing map elements. Some issues are particular to specific blocks such as problematic LiDAR derivatives. UPD addressed these problems through discussion and mentoring visits to partner universities. As of March 2017, a total of 336 municipal agricultural maps have been turned-over to various stakeholders. For the remaining months of the program, an additional 360 maps are expected to be distributed.
1. INTRODUCTION
For the last three years, the Nationwide Detailed Resources Assessment using LiDAR (Phil-LiDAR 2) Project 1 Agricultural Resources Extraction from LiDAR Surveys (PARMap) was able to develop algorithms and workflows for extracting agricultural features from LiDAR point cloud data. The end-to-end workflow from land cover classification of LiDAR blocks to map lay-out undergoes rigorous processing and quality checking. Quality checking is crucial to ensure accuracy standards are met across outputs of all partner state universities and colleges (SUCs) and higher education institutions (HEIs). Given that output layers were generated by multiple teams working on different landscape complexities with some degree of data quality variability, the University of the Philippines Diliman (UPD), the lead agency in implementing the project, devised a centralized and monitored quality assessment scheme.
2. THE PHIL-LIDAR 2 PROGRAM AND PARMAP
The Philippines launched its Phil-LiDAR 2 Program in 2014 with the goal of providing accurate and detailed resource maps for national agencies and local government units, complementing existing programs. The Program was funded by
the Department of Science and Technology (DOST) and jointly managed by UPD and the DOST Philippine Council for Industry, Energy, and Emerging Technology Research and Development (DOST-PCIEERD). It aims to develop methodologies for extracting resource features from LiDAR data. The Program is a collaboration between fifteen (15) SUC/HEIs led by UPD. UPD is primarily assigned to spearhead the development of workflows and algorithms and capacitate partner SUC/HEIs through knowledge sharing in order to implement resource mapping in their assigned area (Blanco, Tamondong, Perez, Ang, & Paringit, 2015; Blanco et al., 2016; Pagkalinawan et al., 2017).
PARMap is one of the five project components of the Phil-LiDAR 2 Program. It aims to provide an updated and detailed inventory of agricultural resources in the Philippines by developing methodologies for mapping such resources using LiDAR and other geospatial technologies such as optical
imagery. Two of the project’s specific objectives are to develop
algorithms and workflows for extracting and characterizing agricultural features (various crops, trees, etc.) from LiDAR data and other remotely-sensed data, and field measurements and to produce detailed maps of agricultural resources as well as those facilities related to agriculture (Blanco et al., 2015; Blanco et al., 2016; Pagkalinawan et al., 2017). Production of agricultural land cover maps is divided into four (4) processes namely land cover classification, GIS post-processing, schema application and map lay-out.
2.1 Land Cover Classification
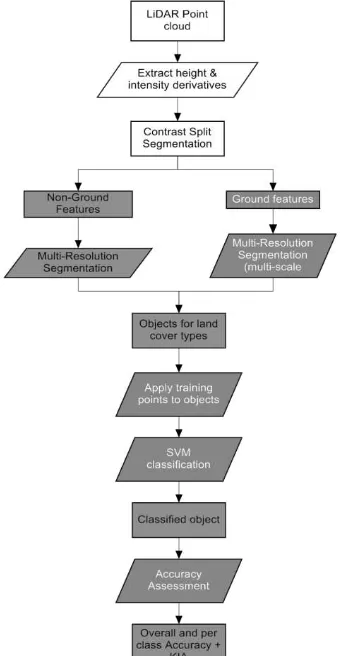
Extraction of agricultural classes and other land cover types from LiDAR dataset was performed by applying object based image analysis (OBIA) using LiDAR point cloud with a density of 2 points per meter and orthophoto with resolution of 0.5 meter (depending on data availability). Analysis was carried out in eCognition, a specialized software for object based image analysis (Carranza, Tañada, Jerez, & Blanco, 2015; Rollan, Carranza, Jerez & Blanco, 2015). Figure 1 shows the general flowchart used by PARMAP in classifying LiDAR data.
Figure 1. General Flowchart of LiDAR Data Classification
Unlike traditional pixel based classification, object based image analysis starts by segmenting the data into objects. An object is a group of several pixels with similar properties and is assigned a single class. Creation of meaningful objects can be achieved
by different segmentation types. Inherent size of the objects is considered in selection of the segmentation scheme performed (Blaschke, 2010). Training points are then selected and imported into eCognition. Spectral, textural and geometric characteristics of objects were used for classification. Supervised classification was used using different characteristics of the objects from the different image layers. Accuracy of results was assessed by a separate set of validation points that was also assigned to the objects created (Carranza at al., 2015).
Classification was run using support vector machine classifier. Support vector machine (SVM) belongs to a class of machine learning algorithms based on the concept of decision planes that define decision boundaries. In feature extraction, a decision plane is a plane that separates between a set of objects having different class memberships. Points closest to the margin are called support vectors and are used for the training phase of classification (Huang & Townshend, 2002; Mountrakis & Ogole, 2011; Pal & Mather, 2005).
Figure 2. Principle behind Support Vector Machine
2.2 GIS Post-Processing
After land cover classification using LiDAR datasets, post processing procedures were implemented to create agricultural land cover maps. A minimum mapping unit (MMU) was determined based on the smallest recognizable feature in the classification. There were a number of factors that should be considered in order to determine the appropriate MMU. These include data resolution, map scale, classification, print size, pixels per inch (PPI) and viewing distance. Data resolution refers to the corresponding ground dimension of a single pixel while map scale is the ratio between the map distance and its corresponding ground distance (Gatdula et al., 2017).
2.3 Schema Application
Schema pertains to the structure of a dataset or design of a database, documented in a data dictionary that defines the objects in databases, tables, fields in the table, and the relationships between fields and tables. Attribute domain is used to constrain values in a particular table attribute, declaring and limiting acceptable values to ensure data integrity. Providing a standardized schema is important to ensure usability of data for future researchers and applications (Gatdula et al., 2017). Table 1 shows a portion of the reference table of land use/ land cover (LULC) for PARMap Schema
LULC
Corn This type applies to corn grain crops
production of
Banana This type applies to banana
Mango This type applies to mango crops Table 1. Portion of the Reference Table of Land Use/ Land
Cover (LULC) for PARMap Schema
2.4 Map Lay-out
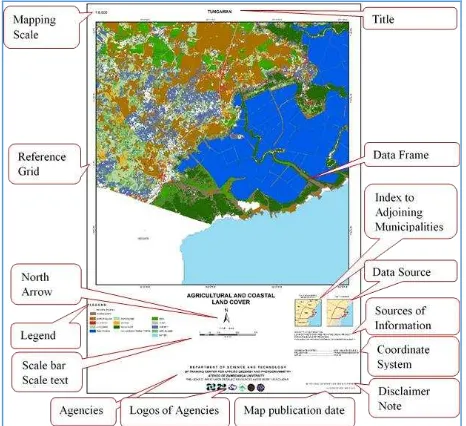
Using an ArcMap file template, a custom-map scale of the municipality can be produced. Maps are exported after elements were modified and completed. In addition, Data Driven Pages (DDP) and ArcPy, a Python scripting module that automate exporting and printing maps, were used to generate a series of 10K extent maps on a single layout by iterating over the index layer or the map extent. Figure 3 shows a sample output map of PARMap.
Figure 3. PARMap Template for Agricultural and Coastal Land Cover Map
3. QUALITY CHECKING AND ASSESSMENT OF OUTPUTS
PARMap created procedures on evaluation of output of each SUC/HEI. For land cover classification, LiDAR derivatives, image segmentation results, use of training and validation points, classification rule sets, and obtained classification accuracies were checked to ensure that the processes implemented by each SUC/HEI are correct. In addition, selection of MMU size, presence of gaps, incomplete schema and mapping elements standards are also checked. Feedbacks are sent to designated focal persons. The SUCs/HEIs are expected to address the comments and adjust their procedures accordingly. A turn-around time of at least one submission review per day per SUCs/HEIs was committed. In addition, a dedicated checker is assigned per SUC/HEI in order to have consistency in reviews. This scheme will give a general idea on whether a particular SUC/HEI has been improving in terms of the quality and quantity of outputs.
3.1 Common and Exceptional Errors
Throughout the duration of quality checking and assessment, errors, both common ones and those particular to certain cases, have been identified. Common errors were provided with derivatives are suitable for non-ground classes. Other useful layers are number of returns, curvature, difference between the first and last return, textural features using gray level co-occurrence matrix and statistical features including mean, mode, quantile and standard deviation. Errors usually arises when these layers are not used accordingly during segmentation and classification. At times, processing takes longer time due to the use of unnecessary additional layers.
Figure 4. Sample Cases of Undersegmentation (top) and Oversegmentation (bottom)
Since training and validation points are pivotal to produce classification within standards, errors in their selection should be avoided (see Figure 5). These include imbalance in the number of points per class, clustering of points within the same location, duplication of training and validation points within the same object and incorrect location or classification. Data collection was done through fieldwork, supplemented by data from orthophoto, satellite images and Google Earth. It is imperative for both field observers and processor to be accurate in assigning location and classification for these points. Quality of validation points should be prioritized over its quantity.
Figure 5. Sample Case of Erroneous Collection and Assignment of Training and Validation Points
Rulesets used in classification can be a combination of classifiers, rule-based algorithms and use of thematic layers. However, each should be used appropriately. Classifiers are primarily used to identify specific land cover such as crops, trees and bare land. Rule-based algorithms are applicable in separating classes with clear boundaries e.g. ground and non-ground classes. Lastly, use of thematic layers is allowed for water, roads and buildings. Manual classification is allowed in extreme cases wherein certain objects are not identifiable using the three aforementioned techniques. The iterative nature of SVM classified can be tedious for some processors which results to them relying heavily on manual classification. This practice is strongly discouraged since it defeats the purpose of unbiased classification.
Figure 6. Sample Rulesets with Numerous Manual Classification and Rule-Based Refinements
To assess the accuracy of classification, accuracy matrix is computed using the selected training points. Overall accuracies and individual accuracies should be greater than 90% unless layers are problematic. Kappa index of agreement (KIA) should also be greater than 0.9. Reporting of accuracies of 100% is avoided since there is no assurance that all corresponding objects of a particular land cover are properly classified. Errors are usually committed when submitted classification have either accuracies below standard or perfect ones. In some cases, a non-ground points are misclassified into non-ground class and vice-versa due to misclassification of validation points.
3.1.2 Exceptional Errors in Land Cover Classification: Some errors are arising from inherent problems of LiDAR derivatives. These problems originate during data acquisition and pre-processing. Solutions specific to this problems are provided on a case-to-case basis and as the need arises. Some of these encountered errors are translational shift between LiDAR derivatives and orthophoto, triangulation error from point cloud
data, misclassification of point cloud data and “overexposed” or
blurry LiDAR derivatives (see Figure 7).
Figure 7. Sample Errors Particular to Certain Blocks; Misclassified Buildings from LiDAR Point Cloud Data (top)
and Blurry LiDAR derivatives (bottom)
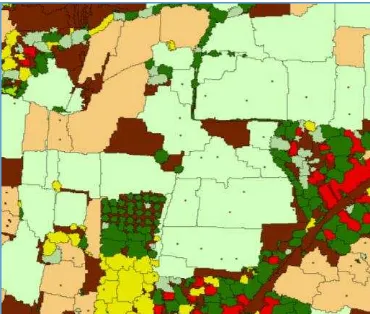
Selection of MMU is dependent on the processor based on the sample cases of significant map feature provided by UPD PARMap. However, there are some instances wherein the selected MMU is either too large or too small (see Figure 8, left). An MMU that is too large will result in overgeneralization of classes whereas a MMU that is too small will not be able to remove insignificant objects. Another common error is the presence of gap when smoothing polygons (see Figure 8, right). This is remedied by lowering the value of the smoothing tolerance.
Figure 8. Common Errors in GIS Post-processing; Insignificant MMU Size (left) and Gaps between Polygons (right)
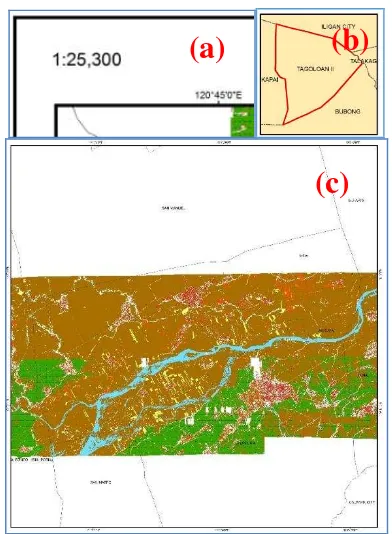
Both schema and map lay-out have been provided with templates to ensure that the content and appearance of map and digital file (shapefiles and KML) outputs of all SUC/HEIs are uniform. Presence of NULL values in attribute table is checked to verify if all the required field columns are properly filled out. Map elements are also checked to guarantee the overall cartographic quality. Figure 9 shows an attribute table with NULL values while Figure 10 shows examples of erroneous map elements.
Figure 9. Sample Schema with NULL Values
Figure 10. Sample Errors in Map Lay-Out (a) Scale Used not a Multiple of 500, (b) Index Map not Showing Adjacent Municipalities, and (c) Data Frame not Showing All Classified
LiDAR Coverage
4. SUC/HEI CAPACITY AND PERFORMANCE EVALUATION
4.1 SUC/HEI CAPACITY
Each partner SUC/HEIs hired researchers who implement the process from land cover classification to map layout. Their backgrounds and experiences include engineering, sciences, information technology, agriculture and forestry (see Figure 11). A total of 111 researchers composed the whole PARMap team, this a mix of those working full time on PARMap tasks and others who are also engaged in other Phil-LIDAR 2 components.
Figure 11. Researchers Background
(a)
(b)
4.2 SUC/HEI PERFORMANCE
From January 2016 to March 2017, a total of 2,886 submissions were recorded in the monitoring sheet of PARMap for quality checking and assessment. These were combinations of land cover classification, post-processing, schema and map lay-out. Spreading across 65 weeks, an average of 9 reviews was sent out per day.
Figure 12. QA/QC Statistics based on Number of Submissions
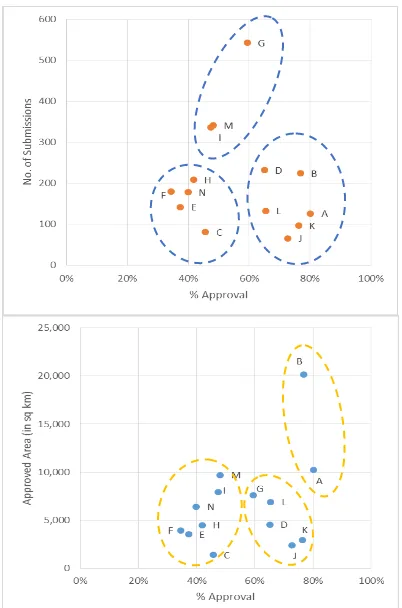
As shown in Figure 12, about 55% or 1,588 submissions were approved while the rest were advised to be reprocessed for revisions. The weekly average number of submissions per SUC/HEI is 3.17 or a total of 206 submissions weekly for the whole project. Only 6 out of 14 SUC/HEIs reached this value. The three universities with the lowest percentage approval are at middle of the ranking based on number of submissions. Interestingly, university A, who had the least number of submissions, ranked 4th in terms of percentage approval while university N, who submitted the most number of blocks, had average percentage approval.
However, block size differs in area coverage and are being subdivided into smaller blocks by some SUC/HEI. Thus, a better indicator of outputs is through area coverage of approved submissions (see Figure 13). These are also classified to the four categories of submissions. In terms of area coverage, three SUC/HEIs have a total approved area greater than 9,000 sq. km. Coincidentally, the three universities with the lowest number of submissions also have the least area approved.
Figure 13. QA/QC Statistics based on Area of Submitted Blocks
Scatterplots of the number of submissions and approved area against the percentage approval showed the quality and quantity of outputs of all SUC/HEI (refer to figure 14). Those at the lower left part of the plot are SUCs/HEIs which have low to average number of output as well as low approval rate. Those at the lower right are characterized by low to average number of outputs but high approval rate. Lastly, those in the upper portion indicate both high number of outputs and percentage approval.
Figure 14. Scatterplot of Percentage Approval vs Number of Submitted Blocks (top) and Percentage Approval vs Approved Area (bottom)
Figure 15. Breakdown of Land Cover Classification Submissions
Correlating the researchers’ background with their respective
SUC/HEI performance, the better faring universities (A, B, I and M) have researchers whose background is from engineering, sciences, and information technology. Among the four, only university M has more than 7 researchers. However, universities C, F and K who also have researchers from the same fields have low to average output generation. On the other hand, universities with researchers who have background in geospatial technologies, e.g. geodetic engineering such as D, E, H, J and L have varying performance from low to average output generation and from low to high approval rate.
4.3 STATUS OF SUC/HEI OUTPUT MAPS
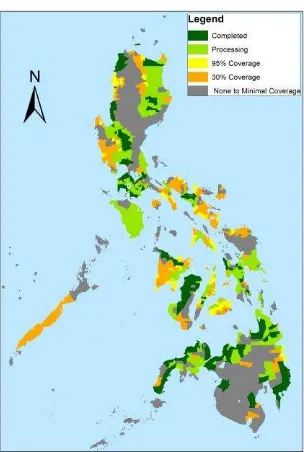
By the end of March 2017, a total of 336 agricultural land cover and agricultural coastal land cover maps have been prepared by the project and turned over to the respective LGUs. 360 more are being processed and are expected to be turned-over before the project ends. An additional 134 municipalities have LiDAR coverage of at least 95% (see Figure 16).
Figure 16. Project Accomplishments and Remaining Target Areas
Comparing outputs on a year-on-year basis, all 14 SUC/HEIs increased their outputs in terms of area by at least 49%. 11 universities produced doubled their outputs on a year-on-year basis. University M showed the largest increase with about 6,000% (refer to Figure 17).
Figure 17. Year 3 vs Year 2 Output
5. SUMMARY AND CONCLUSION
Phil-LiDAR 2 Program is a nationwide detailed resource program in the Philippines utilizing LiDAR. PARMap, one of its five components, aims to provide an updated and detailed inventory of the agricultural resources in the country. Leading a collaboration of 14 SUC/HEIs, UPD developed algorithms and workflows to extract agricultural features from LiDAR data as well as post processing scheme to produce agricultural land cover maps. Similarly, an end-to-end, centralized and monitored scheme for assessing the quality of outputs has been implemented. Common errors have been identified and were provided with suggested solutions. Exceptional errors, on the other hand, have been handled on a case-to-case basis.
Performance of partner SUC/HEIs were evaluated based on the number of submissions as well as area covered. Certain SUC/HEIs have been consistent in submitting the most number of blocks and covering larger areas. In terms of the percentage approval, some SUC/HEIs which have produced lesser outputs have higher percentage of approval. This suggests that they are proficient in processing albeit at a slower pace. Land cover classification, which is deemed as the most critical part of processing, also shows which SUC/HEIs have higher level of proficiency. At the same time, it showed that some outputs requires multiple revisions. Scatterplots of the quantity and quality of their outputs have shown clustering among SUC/HEI, showing which ones are performing better. On a year-on-year basis, eleven (11) SUC/HEIs have made outputs more than
ACKNOWLEDGEMENTS
The authors acknowledge the funding support of the
Philippines’ Department of Science and Technology (DOST)
and the management support of the Philippine Council for Industry, Energy and Emerging Technology Research and Development (DOST-PCIEERD).
REFERENCES
Blanco, A. C., Tamondong, A. M., Perez, A. M. C., Ang, M. R. C. O., and Paringit, E. C. (2015). The Phil-Lidar 2 Program: National Resource Inventory Of The Philippines Using LiDAR And Other Remotely Sensed Data, Int. Arch. Photogramm. Remote Sens. Spatial Inf. Sci., XL-7/W3, 1123-1127, doi: 10.5194/isprsarchives-XL-7-W3-1123-2015
Blanco, A. C., Tamondong, A., Perez, A. M., Ang, M. R. C., Paringit, E., Alberto, R., … Villar, R. (2016). Nationwide Natural Resource Inventory of the Philippines Using LiDAR: Strategies, Progress, And Challenges, Int. Arch. Photogramm. Remote Sens. Spatial Inf. Sci., XLI-B6, 105-109,
doi:10.5194/isprs-archives-XLI-B6-105-2016, 2016
Blaschke, T. (2010). Object based image analysis for remote sensing. ISPRS Journal of Photogrammetry and Remote Sensing, 65(1), 2–16.
http://doi.org/10.1016/j.isprsjprs.2009.06.004
Carranza, C., Tanada, E., Jerez, M.V., Blanco, A.C., (2015) Assessing Segmentation Scale in Object-Based Image Analysis for Mapping Agricultural Crops From LiDAR And Orthophoto Image. 13th South East Asian Survey Congress, Singapore.
Gatdula, N. B., Jerez, M. V., Rollan, T. M., Jose, R. P., Carranza C. U., Laurente, J. A., & Blanco, A. C. (2017). Development of Mapping Design for Agricultural Features Extracted from LiDAR Datasets. 3rd International Conference on Geographical Information Systems Theory, Applications and Management, Portugal.
Huang, C., Davis, L. S., & Townshend, J. R. G. (2002). An assessment of support vector machines for land cover classification. International Journal of Remote Sensing, 23(4), 725–749. http://doi.org/10.1080/01431160110040323
Mountrakis, G., Im, J., & Ogole, C. (2011). Support vector machines in remote sensing: A review. ISPRS Journal of Photogrammetry and Remote Sensing, 66(3), 247–259. http://doi.org/10.1016/j.isprsjprs.2010.11.00
Pagkalinawan, H.M., Gatdula, N. B., Rollan, T. M., Tanada, E.
M., Dela Torre, D.G., Jose, R. P., … Blanco, A. C. (2017). Technical Narrative Report. Phil-LiDAR 2 Program Project 1 Agricultural Resources Extraction from LiDAR Suveys (PARMap)
Pal, M., & Mather, P. M. (2005). Support vector machines for classification in remote sensing. International Journal of Remote Sensing, 26(5), 1007–1011.
http://doi.org/10.1080/01431160512331314083