www.elsevier.nlrlocaterjappgeo
Magnetotelluric study of a plio-quaternary tectonic depression:
ž
/
the Vilaric
¸a basin NE Portugal
Fernando A. Monteiro Santos
a,), Eugenio P. Almeida
a,d, Antonio Mateus
b,
´
´
Hugo C. Matias
a,c,1, Liliana Matos
a, Luıs A. Mendes-Victor
´
aa
Departamento de Fısica da Uni´ Õersidade de Lisboa and Centro de Geofısica da Uni´ Õersidade de Lisboa, R. Escola Politecnica, 58, 1250 Lisbon, Portugal´
b
Departamento de Geologia da UniÕersidade de Lisboa, Edificio C2, Campo Grande, 1700 Lisbon, Portugal c
Instituto Geologico e Mineiro, Estrada da Portela, Zambujal, Apartado 7586, Portugal´ d
Instituto Politecnico de Tomar, Portugal´
Received 7 August 1998; accepted 28 October 1999
Abstract
The Vilaric¸a basin, located northeast Portugal astride a major late-Variscan NNE–SSW reactivated strike-slip fault, is an excellent example of interplate neotectonic activity whose development has been mainly interpreted as a result of left-lateral
Ž
displacement. Thirty magnetotelluric soundings were carried out in the Sta Comba da Vilaric¸arSampaio region northern of
.
the tectonic basin in order to investigate the internal structure of the basin and its relationship with the main tectonic faults. Distortions of the impedance tensors were studied using Groom–Bailey decomposition technique. The predominant regional
Ž .
strike N26E is in good accordance with exposed geology and can be explained for the reactivation of previous structures. Using two-dimensional inversion, three resistivity cross sections were obtained at north, center and south of the studied area.
Ž .
The graben is revealed as a low resistivity 20–100 Vm structure due to the sedimentary filling. The increasing electrical
Ž .
resistivity from 400 to 4000Vm at depths greater than 2 km is related to the Hesperian basement rocks. The main faults, which controlled the formation and evolution of the basin, are revealed by resistivity gradients within the upper crust.
q2000 Elsevier Science B.V. All rights reserved.
Keywords: Magnetotellurics; Tectonic basin; Electrical structure; Portugal
)Corresponding author. Fax:q351-1-395-3327; e-mail: [email protected]
1
Now at Petroprimo, Lisboa.
1. Introduction
The Manteigas– Vilaric
¸
a – Braganc¸
aleft-lateral strike-slip fault zone, usually designated
Ž .
as Vilaric
¸
a Fault Zone VFZ , is one of themajor elements of the late-Variscan fracture
Ž .
network in NW Iberia Fig. 1 . Both geological and geomorphological criteria reveal that most of the fault segments of the VFZ were reacti-vated during Meso and Cenozoic times. A
left-0926-9851r00r$ - see front matterq2000 Elsevier Science B.V. All rights reserved.
Ž .
()
F.A.
Monteiro
Santos
et
al.
r
Journal
of
Applied
Geophysics
44
2000
1
–
14
Ž . Ž . Ž .
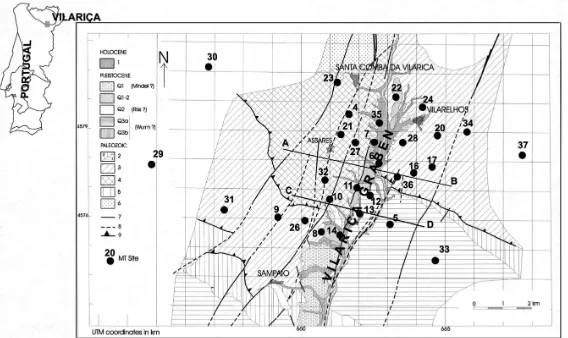
Fig. 1. Tectonic and geological sketch map of Vilaric¸a fault zone and MT sites location. 1 Alluvial sediments; 2 Autochthon domain; 3 Parautochthon domain;
lateral movement with upthrusting of the eastern block towards WNW can be put in evidence in many outcrops, representing the predominant tectonic style of the reactivated VFZ segments in Plio-Quaternary times; fault slip-rates ranging
from 0.2 to 0.5 mmryear are reported by Cabral
Ž1989 for the global Plio-Quaternary seismic.
activity. A historical seismicity record associ-ated to the VFZ demonstrates its present day
Ž .
activity e.g., Ribeiro, 1984; Moreira, 1985 . Ž
The NNE–SSW Vilaric
¸
a depression 20 km.
long and 2–3 km wide , is located astride the
VFZ northern segment at Tras-os-Montes and,
´
according to the available data, it is an excellent example of intraplate neotectonic activity. Given the geometric pattern of the mapped faults seg-ments, as well as the nature and the
distribu-tions of the sedimentary units within the Vilaric
¸
abasin, a pull-apart origin was proposed by Cabral
Ž1989 for this tectonic depression, whose de-.
velopment is related to the VFZ reactivation in Plio-Quaternary times.
The VFZ northern segment has been the sub-ject of several geological studies in the last decades, which enabled the geometric character-isation of different tectonic structures, namely
the Vilaric
¸
a basin and the Bornes push-up alongthe fault zone domain at Tras-os-Montes region.
´
The transition between those two main struc-tures can be observed in the Sta Comba da
Vilaric
¸
arSampaio region, and although theun-questionable scientific importance on delineat-ing the interlinked discontinuities no significant geophysical studies were performed until now. In order to better understand the behaviour of the active faults, as well as to precise the mean-ing and importance of some inferred tectonic
Ž
structures to the Vilaric
¸
a genesis somethingimpossible to do with the available geological .
data , a MT survey was designed.
During 1996 and 1998, 30 magnetotelluric
ŽMT soundings were carried out in the northern.
tip of the Vilaric
¸
a basin in order to obtain animage of the internal electrical resistivity distri-bution of the basin. Three profiles of MT sound-ings were inverted using a 2-D approximation.
The dimensionality of the structures was
anal-Ž .
ysed undertaking Groom–Bailey G-B tensor decompositions.
2. Geological setting
The Sta Comba da Vilaric
¸
arSampaio regionmainly comprises metasedimentary detrital rocks of different lithostratigraphic units that belong to the Autochthon, Parautochthon and Lower Allochthon Domains of the Iberian Terrain in
Ž
NE Portugal Ribeiro, 1974; Ribeiro et al.,
.
1990 . It is also worth noting the presence of syntectonic and late-tectonic granites that in-trude, respectively, the autochthonous and al-lochthonous metasediments; these rocks belong to major igneous bodies known as Vila Real–
Carvic
¸
ais and Sta Comba da Vilaric¸
a batholithsŽRibeiro, 1974; Silva et al., 1989 ..
In this region, it is possible to recognise different tectonic structures that, according to their displacement vectors, orientation, relative chronology and geodynamic evolution, may be grouped in two main systems. The first
com-prises segments of the regional thrusts andror
their subsidiary structures, generated during the earlier Variscan deformation phases; bordering the Parautochthon and Allochthon Domains,
Ž
they generally show a strong dip )608
to-. Ž
wards N or NNE and variable strike NW–SE .
to WNW–ESE due to late-Variscan deforma-tion events. The second system comprises mainly subvertical strike-slip NNE-SSW faults
that bound the northern tip of the Vilaric
¸
a basin.Although the polyphasic nature of the slip vec-tor associated to these late tectonic accidents can be easily identified on most of the mapped fault surfaces, one could point out that a pre-dominant left-lateral component is usually asso-ciated to a vertical displacement, responsible for the relative down throwing of eastern or western blocks. The detrital sediments that fill the
north-ern tip of the Vilaric
¸
a basin can be grouped infour main units of Pliocene to Quaternary age
3. MT data processing and analysis
3.1. Data acquisition
In magnetotellurics, a frequency-dependent transfer function, between electromagnetic field components, is determined using simultaneous
Ž .
measured variations of the electric E and mag-Ž .
netic B fields, on the surface of the earth. This complex transfer function is usually designated the impedance tensor. Apparent resistivity and phase curves are calculated from the impedance
tensor elements Zi j with Zx y and Zy x
repre-senting the two basic components.
The MT data of this study were acquired
Ž .
using a CNRS-GeoInstruments France system with four channels with a recording frequency
ranging from 180 to 1r125 Hz. The
measure-ment directions of the horizontal fields were N26E and N116E, in accordance with the main strike of the geological structures. The time series have been processed and the impedance tensors were obtained using a robust method
Ž .
based on Egbert and Booker 1986 . Data qual-ity was strongly conditioned by the small geo-magnetic activity at the time of the survey and by cultural noise mainly by power lines crossing the depression. Therefore, at some sites the quality of the soundings is rather poor. More-over, in the so-called ‘‘MT dead-band’’, due to the weak signal level, data quality is generally poor.
3.2. Tensor impedance decomposition
Distortions of the electric field by near-surface inhomogeneities can have significant ef-fects on the MT data leading to erroneous inter-pretation. Therefore, those distortions must be recognised and corrected. Several techniques have been proposed to deal with this problem. In this study we applied the Groom–Bailey
ŽG-B method which is one of the most current.
Ž .
methods Groom and Bailey, 1991 . This method
evaluates the fit of the data to a 3D model of galvanic distortion overlying a regional 2D model through the analysis of three decomposi-tion parameters: shear, twist and channeling.
The objective of that decomposition is also to determine the dimensionality of the data, and, if two-dimensional, to obtain a regional strike di-rection. The main steps of the process are as
Ž .
follows: 1 first, a G-B decomposition is per-Ž .
formed without any constraints; 2
subse-Ž .
quently, the shear is constrained and 3 finally, the shear and twist are constrained. Following this procedure, the regional strikes and distor-tion parameters were obtained at each site for all the frequencies. The validity of the model hypothesis for the tensor decomposition was
Ž
tested through the misfit errors Groom and
.
Bailey, 1991 . In general the results indicated
that the 3Dr2D decomposition model is valid in
the period range between 0.1 and 100 s. Below 0.1 s, the misfit is above the acceptable level.
Ž .
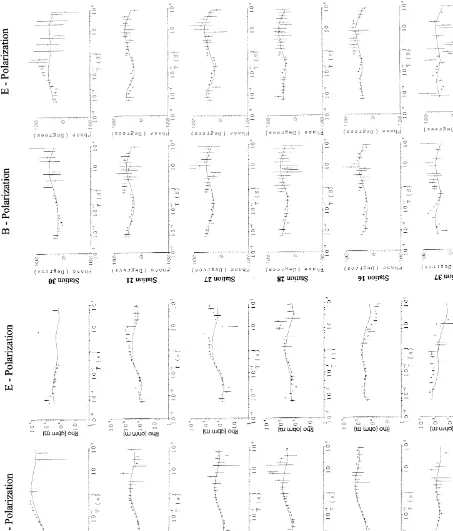
Regional azimuth strike , shear, twist and channeling parameters are given in Fig. 2 for two sites. At site 9, only the strike was con-strained to the measurement direction. The de-composition results show low dede-composition parameters and its roughly independence of the frequency, revealing that the N26E strike is supported by the data. At site 21 all the parame-ters were constrained. As can be noted, the distortion parameters have low-frequency inde-pendent values and the N26E strike gives ac-ceptable errors, for both cases, in the period ranging from 0.1 to 100 s. These results are broadly representative of the data acquired within the graben.
3.3. Regional strike analysis
Vi-Fig. 2. Residual error, strike, twist, shear and channelling current azimuths obtained from Groom–Bailey decomposition of
Ž . Ž .
data from two sites. At site 9 left only the strike was constrained to 268. At site 21 right , all parameters are constrained.
Ž .
Note that directions are referred to field axis N26E; N116E .
laric
¸
a fault. However, at some sites located inŽ
the eastern domain of the basin sites 24, 16, 17 .
and 36 , mainly in the vicinity of the NW–SE
Ž .
thrust fault where 3-D responses are expected , Ž
the strikes are ENE–WSW from N58E to
.
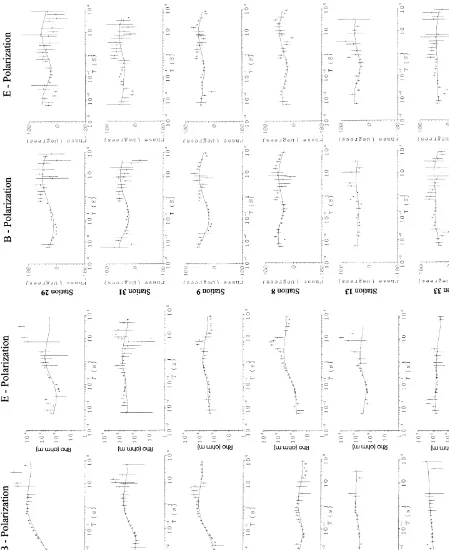
N70E . According to the principal strike the E-and B-polarizations refer to the directions of electric fields parallel and perpendicular to the N26E direction.
The regional strikes at each site can be inter-preted in function of the reactivation of pre-ex-isting structures generated during the late stages of Variscan orogeny. In fact, field data reveals that either the earlier semi-ductile shear zones or the late-Variscan faults were subjected to polyphasic reactivation in the course of the Alpine Cycle. Therefore, ENE–WSW to NE– SW structures are subsidiary to the major
NNE–SSW strike-slip faults, reflecting mainly the local reactivation of earlier shear zones in a low temperature brittle regime of deformation
ŽMateus et al., 1995 . A similar regional direc-.
Ž .
tion was found by Monteiro Santos et al. 1995 in the Chaves basin located 60 km NW from the VFZ, and related to another reactivated
left-lateral strike-slip fault, the Penacova–Regua–
´
Verin fault zone.
4. 2D interpretation and discussion
4.1. InÕersion of phase data
However, more or less severe distortions, in-cluding the static-shift effect, of these curves are common. Fortunately, such static effects do not affect phase data. Therefore, we chose to carry out a first interpretation based completely on the inversion of phases. However, this inter-pretation should be taken with some care and only in a qualitative sense.
Three profiles of MT soundings were in-verted: the first, located northwards and includ-ing sites 30, 23, 4, 35, 22, 24, 20, 34 and 37; one, in the centre, taking into account sites 30, 21, 27, 7, 28, 36, 16, 17 and 37 and the last, southward comprising sites 29, 31, 9, 26, 8, 14, 13, 5, and 33. Stations 30 and 37 are located relatively far from the graben, which is the main target of this investigation. These soundings were considered in the inversion of both, the northern and central profiles, in order to obtain information related to the surrounding struc-tures.
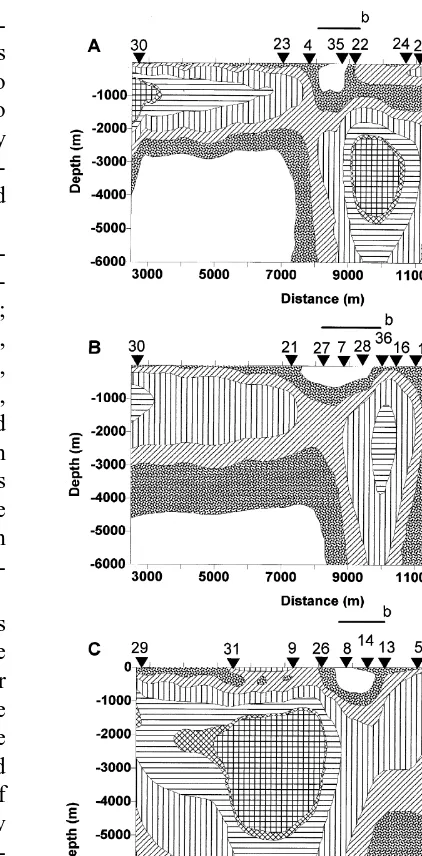
The models obtained from the three profiles are shown in Fig. 3. Only the first 6 km of the crustal models were considered due to the poor quality of the data at the longest periods. The
Ž .
low resistivity zones 25–100 V m in the
Ž
central part of the profiles between km 8 and .
10 are associated with the sedimentary fill of the depression. In the northern profile the low resistivity zone seems to continue subdued east-wards under a more resistive overburden. None of those low resistivity zones extend bellow 1 km. At this depth the models suggest a resistive basement. More specifically beneath sites 35, 22, 24, 20, 28, 36, 18 and 17 in the northern and central profiles well defined resistive structures are revealed at depths greater than 1 km. The east and west boundaries of these high resistiv-ity zones correlate very well with two main
Ž
NNE-SSW faults going through sites 17–34 .
and 7–35, see Fig. 1 .
The models show that there is a significant break in uppermost crustal resistivity: more re-sistive blocks are revealed in the western part of the northern and central profiles, at depths be-tween 0.5 to 2 km. In the southern profile, the
Fig. 3. Resistivity models obtained from inversion of the
Ž . Ž .
phase data. A Northern profile, B Central profile and
Ž .C southern profile. The line marked with a b shows the approximate location of the basin.
corre-Ž . Ž .
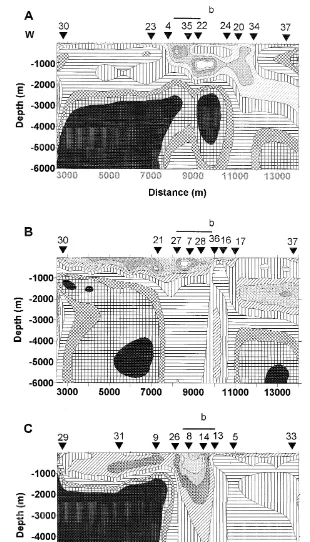
Fig. 4. Resistivity models obtained from joint TE-TM mode data apparent resistivities and phases 2-D inversion along, A
Ž . Ž .
lated with the main geological structures were detected.
4.2. InÕersion of the MT data
Usually, the E-polarisation data vary
smoothly from site to site, whereas the B-polarisation data are discontinuous due to elec-trical resistivity changes, which appear preferen-tially in the W–E direction. In an attempt to correct the data for static-shift we considered the regional levels of the E-polarisation appar-ent resistivity curves at a period that samples deeper than our region of interest in this study; the first 5 km of the crust: we considered 1.3 s as the period for deriving a regional level. The mean value of the E-polarisation apparent
resis-tivity data is about 500 V m. Therefore, both
apparent resistivity curves for each site were simultaneously shifted, so that the
E-polarisa-tion data had a value of 500 V m at 1.3 s. The
static-shift correction is a difficult task that cannot be carried out properly without
addi-Ž
tional geophysical information e.g., from a
.
transient survey . The adopted procedure of de-riving a regional resistivity curve and shifting the data to match this curve has been used by
Ž
several authors e.g., Berdichevsky et al., 1989, . Vanyan et al., 1989; Jones and Dumas, 1993 which is, obviously questionable. Such method-ology was adopted here mainly because the scarcities of geophysical database: any seismic, electrical or gravity information is available.
In order to obtain a better approach to the electrical resistivity distribution in the region the three profiles of MT soundings were
in-Ž
verted considering apparent resistivities
cor-.
rected from static-shift and phases. The inverse models were obtained using the program
pre-Ž .
sented by Mackie et al. 1997 that, according to the authors, find regularised solutions to the 2-D inverse problem using Tikhonov regularisation.
The obtained electrical models are presented in Fig. 4. Detailed interpretation of the models requires independent information, including drill hole data. At present, no drill hole is available in the studied area. Owing to the scarce geo-physical database of the region, the interpreta-tion of the MT data is difficult. Therefore, our interpretation of the resistivity features is mainly supported by the exposed geology. All resistiv-ity models evidence two important domains.
Ž .1 The first one, up to depths of 1–2 km,
comprises mainly the sedimentary filling of the
tectonic basin and the fracturedrweathered
ar-eas of the adjoining metasedimentary rocks. This domain presents strong lateral resistivity con-trasts with the lowest resistivities related to the
Ž .
sedimentary units 20–100 V m . The
resistiv-Ž ity distribution in the shallow domain up to
.
depths of 500 m is strongly affected by the network of tectonic features, distribution and quantity of clay and water content, as well as by stratification of the lithostratigrafic units.
Ž .2 The second domain, related to the older
geological formations at depths greater than 2 km, which are represented by high resistivity structures. The deeper levels of the Au-tochthonous, show an average resistivity
rang-ing from 1000 to 4000 V m. At depths greater
than 2–3 km, the gneissic basement with
resis-tivity greater than 4000 V m, is revealed at the
western part of the profiles.
The low resistivity areas associated with the sedimentary fill of the depression show different expressions: in the northern profile that zone
Žbeneath sites 4 and 35. seems to continue
Ž .
subdued in depth 1 to 2 km between sites 22 and 24, as revealed in the model obtained from phases. However, the characteristics of that con-ductive structure is not well defined due to the lack of data between those sites. The MT model from the central profile suggests that the
sedi-Ž .
mentary filling beneath sites 27, 7 and 28 is
Ž . Ž . Ž .
Fig. 5. MT data for selected sites symbols and model responses solid lines from the inverse models. A From northern
Ž . Ž .
Ž.
Fig.
5
continued
Ž.
Fig.
5
continued
Ž
less thick in that region thickness less than 1 .
km .
In the last model, corresponding to the
south-Ž .
ern profile, a thick -3 km low resistivity
zone is clearly imaged beneath sites 8 and 14. The three resistivity models are also charac-terised by a general increase in resistivity be-neath sites located westwards of the depression
Žsites 30, 23, 21, 29, 31 and 9 and less resistiv-.
ity structures eastwards.
The main faults associated with the
genera-Ž .
tion of the basin see Fig. 1 are well displayed in the models: to the west, at depths greater than 3 km beneath sites 23, 4, 21 and 9; to the east, the faults appear related to the resistivity con-trast evidenced beneath sites 28, 36, 16 and 13. Comparing the resistivity models obtained from phases with those estimated using all MT data, we found the same general behaviour on the low-resistivity connected to the basin and the high resistivity associated with old forma-tions. The joint inversion of the apparent resis-tivities and phases allow a better definition of the depth of the electrical resistivity boundaries. Owing to our results the static-shift correction methodology used in this study seems accept-able.
The models put into evidence the deep three-dimensional geometry already suggested by the complex superficial geology and shows the need of three-dimensional modelling for a better understand of the connection between the structures. This must be the next step in the interpretation of the magnetotelluric data set
acquired in the Vilaric
¸
a region. Thetwo-dimen-sional modelling is clearly a first approach. In Fig. 5, the experimental data and the cor-responding fit of the inverse model responses at representative sites along each of the profiles are displayed. For most sites, the fit is relatively good at shorter periods. However, the misfit observed at some sites in the period range of 0.01 to 0.1 s may exhibit the need for three-di-mensional modelling. At longer periods, how-ever, the data are scattered and the fit is not so good. The global rms for the profiles were 4.9
Žnorthern , 5.2 center and 3.9 southern , re-. Ž . Ž .
spectively.
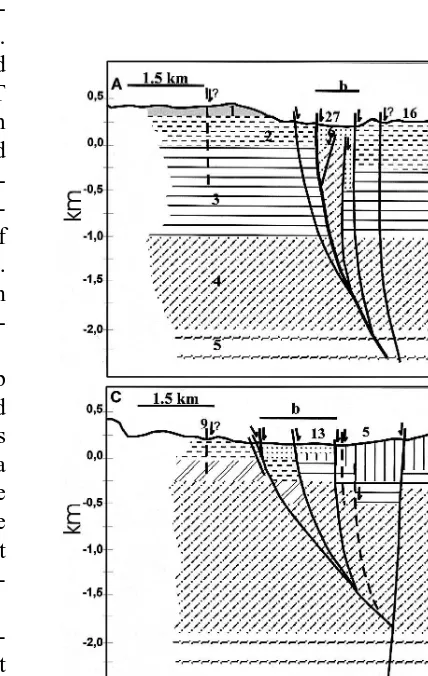
Possible geological interpretations of the main characteristics revealed by the central and south resistivity models are presented in Fig. 6. These interpretations that combine the geophysical and geological available information, put in evi-dence the asymmetric character of the basin,
ascribable to the simultaneous left-lateral
strike-slip and normal displacement of the faults that bound the eastern and western sides of the basin, respectively. According to the transform-normal extension model type, proposed by
Ž .
Ben-Avraham and Zoback 1992 , the basin
subsidence can thus be due to the extension in a direction normal to the regional strike of the fault at the same time that strike-slip movement is taking place. This behaviour can be explained if the far-field maximum principal stress
direc-tion is less than 458relatively to the strike of the
fault zone: in such case a divergent motion can
Ž .
occur Ben-Avraham and Zoback, 1992 . The principal stress pattern, during Plio-Quaternary
Ž .
times in northern Portugal Cabral, 1989 is
consistent with this interpretation.
5. Conclusions
Two-dimensional inversion of MT data col-lected across the VFZ, allowed a characteriza-tion the electrical structure of the main geologi-cal units present in the studied area. Although the 2-D modeling seems to be only a rough approximation to the complex resistivity fea-tures of the region, it can give a first idea of the resistivity distribution within the basin. The general behaviour of the data indicates that a 3-D modeling might explain all the features of the data. The main characteristics of the 2-D estimated models and the interpretation of its features, are as follows.
Ž .1 The uppermost lithologies of the
Pa-rautochthonous show an average resistivity of
100–200 V m.
Ž .2 The transition zone between Lower
Al-lochthonous–Parautochthonous and the
Pa-rautochthonous is represented by a 350 m
thick-ness layer with a resistivity of 200–500 V m.
Ž .3 The autochthonous metasediments domi-Ž
. nated by quartzites, pelites and graywackes , display distinct resistivity values, ranging from
500 to 4000 V m, defining different layers.
Ž .4 The sedimentary filling of the tectonic
basin is a good conductor, presenting average
resistivities of 20–100 V m. The low resistivity
of this zone is mainly due to the water content of the sedimentary units. The models suggest that this conductor is deeper within the
north-eastern part of the basin tilting north and south-wards.
Ž .5 At depths of 2 km, in the western part of
the studied area, the resistivity increases up to
values greater than 4000 V m. We interpret the
deepermost part of this layer as the Iberian gneiss basement.
Ž .6 The resistivity gradients revealed in the
upper crust were associated with the main fault that controls the formation and evolution of the depression in Quaternary times.
Acknowledgements
Ž
This study was supported by FCT Fundac
¸
ao˜
. Ž
para a Ciencia e Tecnologia
ˆ
Project No..
PBICTrCrCTAr2123r95 . The authors thank
Dr. G. Vasseur and an anonymous reviewer for critical and useful review.
References
Ben-Avraham, Z., Zoback, M., 1992. Transform-normal extension and asymmetric basins: an alternative to pull-apart models. Geology 20, 423–426.
Berdichevsky, M.N., Vanyan, L.L., Dimitriev, V.I., 1989. Methods used in the U.S.S.R. to reduce near-surface inhomogeneity effects on deep magnetotelluric sound-ing. Phys. Earth Planet. Int. 53, 194–206.
Cabral, J., 1989. An example of intraplate neotectonic activity, Vilaric¸a Basin, Northeast Portugal. Tectonics 8, 285–303.
Egbert, G., Booker, J.R., 1986. Robust estimation of geo-magnetic transfer functions. Geophys. J. R. Astron. Soc. 87, 173–194.
Groom, R.W., Bailey, R.C., 1991. Analytic investigations of the effects of near-surface three-dimensional gal-vanic scatterers on MT tensor decompositions.
Geo-Ž .
physics 56 4 , 496–518.
Jones, A.G., Dumas, I., 1993. Electromagnetic images of a volcanic zone. Phys. Earth Planet. Int. 81, 289–314. Mackie, R., Rieven, S., Rodi, W., 1997. User’s manual
and software documentation for two-dimensional inver-sion of magnetotelluric data.
Mateus, A., Ribeiro, A., Barriga, F.J.A.S., 1995. Pore fluid and seismogenic characteristics of fault rocks within
Ž .
deep fluid circulation during the uplift of the variscan continental crust. Universidade do Porto-Faculdade de Ciencias,ˆ Museu e Laboratorio´ Mineralogico´ e Geologico, Memoria No. 4, 281–285.´ ´
Monteiro Santos, F.A., Dupis, A., Andrade Afonso, A.R., Mendes-Victor, L.A., 1995. Magnetotelluric
observa-Ž .
tions over the Chaves geothermal field NE Portugal -preliminary results. Phys. Earth Planet. Int. 91, 203– 211.
Moreira, V.S., 1985. Sismotectonics of Portugal and its adjacent areas in the Atlantic. Tectonophysics 117, 85–96.
Ribeiro, A., 1974. Contribuition pour l’etude tectonique de´
Ž .
Tras-os-Montes Oriental. Mem. 24 n.s. , Serv. Geol.´ de Portugal, Lisboa, 168 pp.
Ribeiro, A., 1984. Neotectonique du Portugal. Livro de Homenagem a Orlando Ribeiro, 1q Vol., Centro de Estudos Geograficos, Univ. Lisboa, pp. 173–182.´ Ribeiro, A., Quesada, C., Dallmeyer, R.D., 1990.
Geody-namic evolution of the Iberian Massif. In: Dallmeyer,
Ž .
R.G., Martinez, E. Eds. , Pre-Mesozoic Geology of Iberia, Springer, Heidelberg, pp. 399–411.
Silva, A.F., Rebelo, J.A., Ribeiro, M.L., 1989. Carta Geologica de Portugal, 1:50000. Notıcia Explicativa da´ ´ Folha 11-C: Torre de Moncorvo. Serv. Geol. de Portu-gal, 65 pp.