THREE-DIMENSIONAL DATA AND THE RECORDING OF MATERIAL STRUCTURE
R. Parenti a, P. Gilento a, F. Ceccaroni b
a
Department of Archaeology and Art History, University of Siena, Building Archaeology Laboratory, LAARCH, via Roma 56, 53100, Siena , Italy, parenti@unisi.it, pierogilento@gmail.com
www.laarch.unisi.it b
Menci Software, Arezzo, Italy- Via Lumiere, 19, 52100 Arezzo, Italy, francesca.ceccaroni@menci.com
www.menci.com
KEY WORDS: Photogrammetry, 3d photo scanner, Cultural Heritage, 3D models from images, Building Archaeology, Three-dimensional survey, multi-disciplinary recording.
ABSTRACT:
The “description” of a material structure requires a high degree of objectivity to serve the scientific interests of certain disciplines (archeological documentation, conservation and restoration, safeguarding of cultural assets and heritage). Geometric data and photographic documentation of surfaces are thus the best instruments for efficacious, clear and objective recording of architectural objects and other anthropic manifestations. In particular, the completeness and diachrony of photographic documentation has always proven essential in recording the material structure of historical buildings.
The aim of our contribution is to show the results of several projects carried out with the aid of survey methodologies that utilize digital photographic images to generate RGB (ZScan) point clouds of architectural monuments (urban standing buildings, monuments in archaeological areas, etc.) and art objects.
These technologies allow us to capture data using digital photogrammetric techniques; although not based on laser scanners, they can nonetheless create dense 3D point clouds, simply by using images that have been obtained via digital camera. The results are comparable to those achieved with laser scanner technology, although the procedures are simpler, faster and cheaper.
We intend to try to adapt these technologies to the requirements and needs of scientific research and the conservation of cultural heritage. Furthermore, we will present protocols and procedures for data recording, processing and transfer in the cultural heritage field, especially with regard to historical buildings. Cooperation among experts from different disciplines (archaeology, engineering and photogrammetry) will allow us to develop technologies and proposals for a widely adoptable workflow in the application of such technologies, in order to build an integrated system that can be used throughout the scientific community.
Toward this end, open formats and integration will be taken into account as far as data processing and transfer are concerned.
1. INTRODUCTION
The current state of an historic building is defined by archaeologists as its material structure. The recording of its characteristics, whether it be an architectural complex or an archaeological site, requires instruments capable of providing the greatest possible quantity of data, regardless of the disciplinary uses for which they are intended. Recording must thus be carried out in such a way as to provide elements useful for analyses that may have different purposes: structural analyses, study of construction techniques, restoration, construction evolution, etc. For example, in the specific case of historic buildings damaged by an earthquake, recording is carried out with the aim of grasping all of their characteristics – formal, material and dimensional – while keeping in mind the need to work at a distance and in safety, without having to come into direct contact with the structure.
Today’s technology offers a few possible routes; the choice
depends on numerous factors: economic, technical-practical, social, or simply mental.
With this contribution we intend to present, through a series of experiences undertaken in recent years by the University of Siena Laboratory of Building Archaeology in collaboration with MenciSoftware, one of the possible methods that can be utilized, the results achieved, the problems encountered and, where possible, their solutions. Naturally, we do not intend to promote any one technique over another (laser scanning or photogrammetry), in part because the combined use of such
techniques is almost always the most productive route, but rather to demonstrate, through concrete examples, a methodology of recording of historic heritage created by means of digital images and a software based on the laws of photogrammetry. The instruments generate RGB point clouds and photographic 3D models.
Detailed, photographic-image-based knowledge of the structure must be acquired in its material-dimensional totality, and guaranteeing the unitarity of said operations (Cundari, 1982), in order to allow for different interpretations than those that would be possible from a more superficial examination.
Technological advances have given the scientific community products from which to obtain models that not only have the great attribute of photographically representing surfaces with a very high level of definition, but are also geometrically correct in three dimensions. The documentation of material structure has thus come to be much more complete, and offers the rapidity and wealth of information necessary for in-depth analysis of an object.
The most innovative aspect of the system regards the capacity to carry out methods of three-dimensional recording at different levels of definition; an efficacious and realistic exploration of the 3D model of the structure is also possible. Said model can be considered the product of a series of operations of data recording, processing and cataloging, which must be made available to the largest possible number of research groups with very different aims and purposes, now and in the future. Therefore, we must also deal with the problem of the quantity
and quality of information, as well as its conservation and utilization in the long-term.
2. RECORDING OF MATERIAL DATA
2.1 The Stereometric survey and Building Archaeology
The need to have a quick, relatively economical and precise system is linked to the operational demands of disciplines like Building Archaeology, which have in recent years been increasingly tied to the monitoring and restoration of important architectural assets. Archaeological documentation of architectural heritage is the basis from which to initiate building restorations, research projects (archaeological, historical-constructive, etc.) and safeguarding activities such as the prevention of seismic risk (Parenti, Vecchi, Gilento, 2008) or the monitoring of the state of conservation of entire archaeological sites.
Reconstructing the evolution of an architectural structure over time is often a highly complex operation. In general, a building is the sum total of acts of construction, reconsideration and changes to the initial plan, as well as any collapses and reconstructions due to human factors (demolitions) or natural ones (such as earthquakes). All of this information is recorded in the structure of the building itself and must be meticulously identified and decoded.
The problem of representing the passage of time is of great import in the archeological field, dealing precisely with the decoding of signs left on the horizontal and vertical surfaces of buildings. It is a question of recognizing not only the constructive evolution of a building, but also its structural and functional dynamics. In fact, the constructive history can lead us to a great deal of data useful for an eventual conservation plan.
In investigating wall structures, for example, an accurate survey is necessary not only to document the formal characteristics of a structure, but also to understand the logic that underpinned its construction (Mannoni 1991). Thus, having the capacity to record material data by means of three-dimensional metric data along with chromatic data gives us an ideal instrument to achieve a sufficient degree of in-depth understanding of the construction process of the ancient building.
Building archaeologists attribute fundamental importance to the
material structure, the main source for the “reading” from which
all information recorded by the building springs. Having the opportunity to utilize these types of survey instruments has thus modified the approach to and working practices in archaeological and architectural documentation. After field recording of all building data (walls, attics and roofs, windows and doorways, decorative elements), the archaeologist can work and make observations on a high-resolution three-dimensional surface, reproduced in the laboratory.
Naturally, the quantity of information that can be drawn from available documentation depends on how deep into detail we want to go with our reading of the building, as well as on the researcher’s training and interests. The researcher’s interpretation will guide the development of modes of utilization of data (graphic surveys, surface observations, mechanism of deterioration, verifications of dimensions, etc.). In fact, the possibility of a diachronic utilization of the model by researchers with different cultural baggage and educational paths is one of the advantages of the new technologies, through which, for example, the advancement or successful completion of a consolidation intervention can be mapped and verified years after its execution. For example, a large archaeological site such as Pompei could be monitored quickly and at relatively low cost to determine the need for safety or restoration interventions.
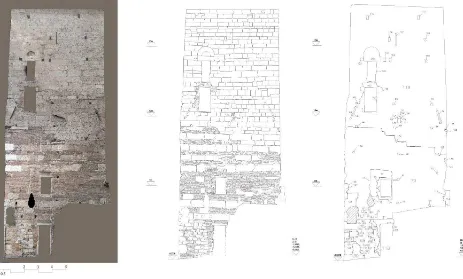
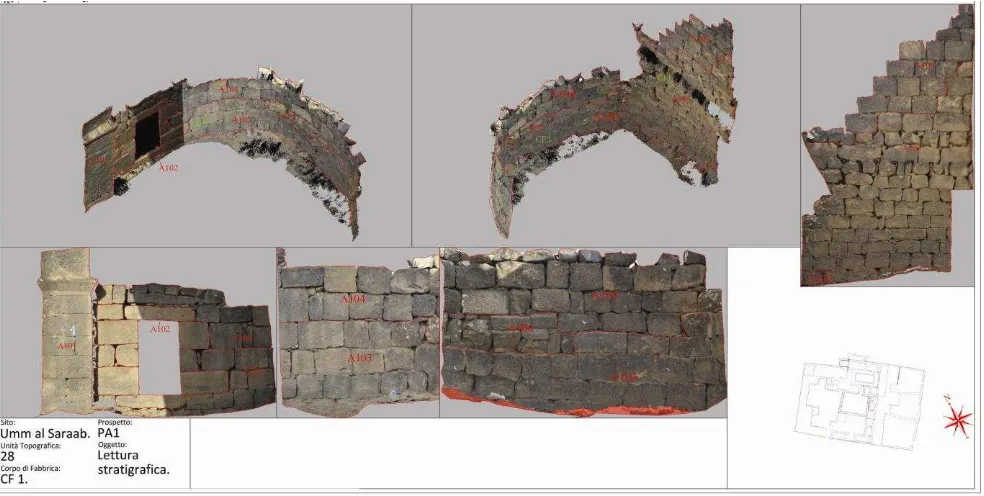
Figure 1. Orthophoto, vectorial drawing of construction materials and “stratigraphic reading.” (elaborated by Rossella Pansini)
3. SURVEY METHODOLOGY
3.1 Fieldwork
The methodology utilized for the recording of material structure involves first and foremost the acquisition of data by means of exhaustive photography of the surfaces and architectural structures that make up the building. The factors that impact the development of the photographic plan can be divided into the categories of objective factors, i.e. the size of the building to be surveyed, the lighting conditions, the general conditions of the site location (urban environment, isolated area, presence of vegetation) and the method of shooting (coplanar sensor, or one
that strongly impacts the building’s surface), and subjective factors, of which that with the strongest influence on fieldwork is the scale of resolution required by the specific type of survey. If a high-resolution model is required, the photographic camera must be closer to the building, and this in turn requires a distance from the object, ranging from 0.50 to 3-4 m (depending on the lens used) that greatly impacts the number of photograms necessary to obtain a complete model. A site visit is the best way to get to know the building and thus lay out a photographic shooting plan.
The photographic shoot is backed up by a topographic survey, which is used to determine the coordinates of targets previously positioned on the surfaces to be surveyed. The carrying out of a topographic survey (although not obligatory) is of determining assistance in all further data processing and presentation work, and serves as the instrument of external control of the program. In the field, three-focal photographs are realized with a digital camera positioned on a slide bar. The calibrated optics we utilize (20mm, 28mm and 60mm) vary depending on the definition required and on objective shooting conditions. Thus, the best solutions must be determined in order to avoid distortions, zones of shadow and high levels of chromatic non-homogeneity. The photographs are accompanied by a paper file sheet on which the researcher indicates shot characteristics (distance on the slide-bar and type of lens) and the portion of the building photographed; this additional but quick bit of work in the field facilitates and speeds up the information reorganization phase in the laboratory.
In fact, we are dealing not with photographs to generate orthophotos or for a more classical monoscopic photogrammetry plan, but with stereoscopic photogrammetry, therefore the position of the photographer and the camera prove fundamental in covering all parts of the structure necessary for model construction.
Figure 2. 3D model of Santa Maria church façade and bell tower. (elaborated by Clara Nerucci)
We must thus be able to grasp the three-dimensionality of the object and to photograph all of its necessary parts. This being the case, it is impossible to set general rules; rather, field recording must be dealt with on a case-by-case basis.
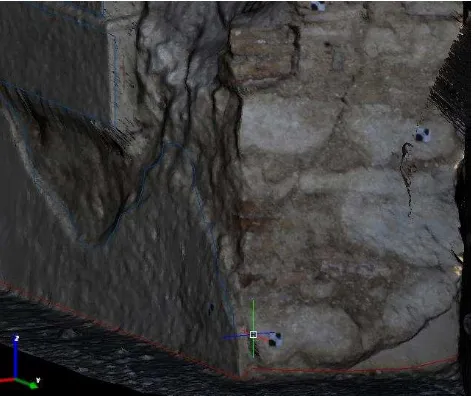
Figure 3. Base of a pilaster from the Church of Sts. Sergio and Silvestro in Castelnuovo (AQ), damaged by the earthquake on
April 6, 2009.
Figure 4. Section view of a wall for structural evaluation.
3.2 Laboratory work
Rendering in the laboratory can be done in two phases. The first involves the processing of data using the Menci Software ZScan program for point cloud generation. After an initial automatic rectification of the three photos, the researcher/technician utilizes the geometric coordinates (check points) to orient each three-focal photograph.
Next, the area to be generated is individuated on the photo, and the point cloud reconstruction step is set based on the gsd (ground sample distance) value.
Gsd is the size in the real world of that part of the subject represented by one pixel of a digital image. English Heritage specifications recommend precise values.
For photogrammetry on typical architectural scales, the following values are recommended (Metric Survey Specification, 2009):
Output scale gsd
1:50 2mm
1:20 1mm
1:10 0.5mm
Table 1. Gsd values from English Heritage Specifications
Figure.5. Position of the target on the point cloud
Figure.6 Model derived from a non-coplanar ground shot
Figure.7. True error of 3 cm between target and geometric coordinates derived from total station, when we have a
non-coplanar ground shot
As already mentioned, the utilization of topographic points is a proven instrument to guarantee a high degree of precision for the model. Even in situations in which the photo is taken from a distance and is not perfectly parallel to the surface, the
utilization of verification points keeps error below three centimeters (fig.7).
The set value of the distance between one point and the other (reconstruction step based on the digital image pixel) is one parameter that can be set based on the result one intends to obtain. For example, the same area can be generated at different resolutions.
Figure.8. Point cloud generated with real gsd of 0.012 m
Figure.9. Detail of point cloud with gsd set at 0.004 m
Lens 28mm, distance 4m
Gsd set in program
Real Gsd on point cloud
Number of points
Time required for generation
0.009 0.012 142.211 8 min. 0.003 0.004 1.247.293 35 min.
Table 2. Values of the point clouds generated from the same shot but with different gsd
The researcher/technician chooses the value of the reconstruction step, based on the type of plan to be realized. As gsd decreases, resolution increases, along with the time required to generate point clouds, and thus laboratory time. In addition, there is the problem of handling large quantities of information, and the question of whether we really need all of the data recorded.
In figures 8 and 9, we generated a point cloud from a three-focal photograph realized using a 28 mm lens from a distance of 4 m. from the wall surface.
Starting with the same photographic base, we also realized one point cloud with gsd 0.009 and a second one with gsd 0.003.
The point clouds are saved in .vtp format and managed by the software program (ZMap). In the phase of exportation into .vtp format, each individual model can be saved in ASCII XYZ and ASCII XYZ RGB format; in this case, the file extension allows for exportability into other point cloud management programs, or into simple viewers. Our experience up to now has delivered excellent results for the handling of RGB point clouds, but not for texture. In fact, the point clouds have been exported into another proprietary program called Geomagic, and onto the web viewer Cortona.
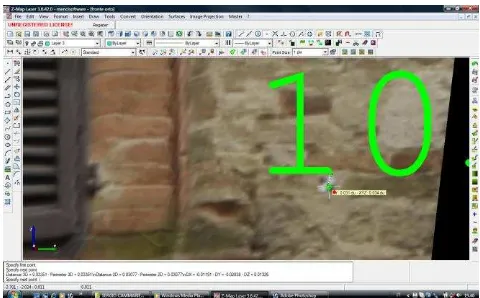
Figure 10. 3D model viewed with Geomagic
Figure 11. 3D model viewed with Cortona
Once models have been generated, they can be managed in
ZMap. This program’s interface is very similar to those of CAD
software, and in fact one of its main functions is to create vectorial drawings directly on the 3D texture. The advantage of this sort of tool is the capacity to make use not only of three-dimensionality but also of the colors of an object in order to record and map its characteristics.
The fully-vectorialized recording of surfaces is a wireframe 3D survey which is not only compatible with CAD surveys *.dxf format) but can also be inserted into on-line data banks or GIS systems that operate on vertical surfaces or are capable of handling three-dimensionality. It is also possible to directly obtain orthophoto quadrangles of vertical walls and generate vectorialized outlines of zones of interest when there is a need for traditional elaborations for plans, front views and sections.
Fig. 12. 3D photographic texture and 3D CAD drawing of material structure (the ashlars of the apses of San Pietro a
Coppito church, (AQ)
Figure 13. 3D model with the texture, the Cad drawing on the surfaces and the related topographical points
But with the possibility of compiling CAD surveys directly on
the 3D model, an “archaeological” type of rendering is required, based on the surveyed elements’ real positions in space, not
mediated or conditioned by the need to obtain representations consistent with the laws of orthogonal projection. Since this type of representation (typical of three-dimensional photogrammetric rendering) is highly innovative in its simplicity, and has rarely been used until now on large projects, it will probably be necessary to compare the working protocol for new point-cloud-based survey systems (laser scanner and RGB points) with the possibilities offered by software.
Figure 14. Complete 3D CAD drawing obtained from 3D realistic model.
3.3 Completeness and quality of recording
The completeness of recording is the result of various factors that come to bear on the rendering, both before and after its generation. The richness of the recording has a great impact on the type of work that can be carried out. In the case of surveys
of historic buildings, Guidelines (Linee Guida, 2007) indicate the standard to adhere to. The Italian Ministry for Cultural Heritage specifications for seismic improvement of historic buildings in fact call for the realization – after an initial rapid survey – of an in-depth analytical survey that gives particular attention to realization techniques and details of construction. The elements of the building to be recorded can be categorized as:
-Building blocks -Construction phases -Structural elements -Lesions and deformations
Deformations of architectural geometry and lesions are an integral part of the survey because they represent one of the most significant structural breakdowns of the building. The method of photogrammetry allows us to survey and reveal this type of damage without abstraction, and thus is one of the best-suited tools for static monitoring of an historic building.
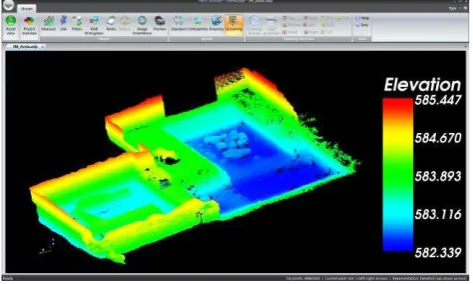
Figure 15. DEM of an archaeological area (Aosta)
A preliminary list of the elaborations we experimented with comprises the dimensional characteristics of the building (also expressed in the more traditional forms of plans, front views and sections), the mapping of cracks and detachments, even small ones (interfaces, in archaeological terms), and the behavior of macro-elements (deformations and off-plumbs can be immediately taken into account, given the ease of outlining horizontal and vertical sections at any point on the surveyed surface), stratigraphic reading limited to the identification of construction phases (with particular reference to models of previous seismic damage and possible reconstruction), and the qualitative characteristics of walls, based on criteria adopted for the drafting of the Atlas of wall construction types of Central Italy for the National Committee for the Protection of Cultural Heritage from Seismic Risk and observations on the behavior of traditional types of walls (Binda et alii, 1999).
We can also carry out further operations on the three-dimensional model of a building thus obtained, geared towards both the behavior of macroelements and details.
3.4 Technical characteristics of the instrumentation
This survey technology is completed with the use of 3D photo scanning (Menci Software) which allows for perfect recording of color on the point cloud extracted by automatic correlation of sequential images.
The ability to integrate images in order to achieve geometric and radiometric continuity makes this a very interesting
instrument for archaeological and architectural documentation. Furthermore, particular software functions can be used to compare surfaces generated at different times. Another interesting aspect is the possibility of working on different scales, utilizing appropriate hardware. In fact, the ZScan system includes hardware in the form of a bar and a digital camera with calibrated lens, as well as a software application for 3D reconstruction by means of image matching.
The hardware may differ in terms of length and capabilities, depending on intended use. In fact, there are various extensions of the basic technology for use in different shooting conditions. The 900 mm bar allows for a minimum baseline of 20 mm and a maximum baseline of 900 mm, thus, adhering to the theoretical ratio of 1:10, the shooting distances of reference are: minimum 200 mm and maximum 9000 mm. The 260 mm micro Zscan bar, on the other hand, is motorized, so its movements are managed by means of software. The minimum baseline 5 microns and the maximum baseline is 260 mm, so, keeping to the same criteria of reference of the theoretical 1:10 ratio, the shooting distances are from 0 to 2600 mm.
Technical characteristics of ZScan:
Planimetric precision inferior to 2 pixels and altimetric precision inferior to 5 pixels.
trinocular reconstruction algorithm, bundle block adjustment on three-focal photo and epipolar rectification. Pyramidal image matching area equalized on histograms. Sub-pixel autocorrelation by means of polynomial
interpolation evaluated simultaneously on 3 photograms. Selective reconstruction by area at different resolutions. Bulk linkage of three-focal photos
Possibility to work with or without GCP Triangulated and texturized rgb point clouds
Calculation times: from 2.000 to 10.000 points per second, depending on computer used and type of subject to be reconstructed
3D models from low-altitude aerial shots. Another interesting prospect for the surveying of archeological and architectural assets is the use of aerial photographs.
Recently, Menci Software has been testing the use of a new proprietary technology for reconstructing dense models based on images from UAVs or low-altitude vectors.
The generation of models is completely automatic.
The zenithal shot favors an homogenous reconstruction with no zones in shadow. Naturally, there must be at least 70% coverage among the photograms.
For archaeological sites and architectural complexes located in impenetrable areas, this is certainly an interesting solution, thanks to the brief time required for the photographic survey and the certainty of access by air.
4. DATA MANAGEMENT
The quantity of information generated and stored during the recording process is enormous. Thus it is fundamental to organize data management according to very precise criteria from the outset (Rodríguez Miranda et alii, 2007).
In fact, the photographs bring with them a wealth of information that must be conserved. In addition to the photos, there are also topographic points, drawings created during the survey and all of the digital data generated by various rendering processes.
The latest Site Manager software is also capable of archiving all digital information regarding a survey: point clouds, images, CAD diagrams and orthophotos, as well as video, audio and web links.
Figure 16. Example of archiving images from an archaeological excavation in SiteManager
In short, we are dealing with a software dedicated to the collection and digital delivery of survey data.
In fact, the software is designed to be provided along with data, and allows for consultation, metric examination, anaglyphic stereoscopic viewing, superimposition of various data in addition to the 3D point cloud model and the viewing of the model in various types of representations.
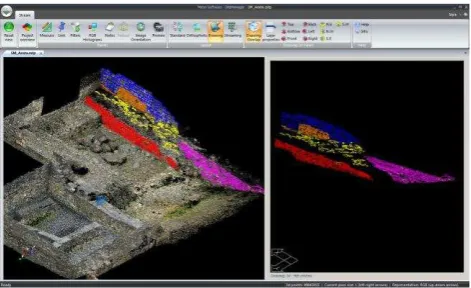
Figure 17. 3D points cloud and the related 3D CAD drawing
CONCLUSIONS
The possibility of integrating currently available technologies, combined with the need to utilized the digital products such technologies can create in the most effective ways, leads us to the common goal of understanding what we are recording so as to best conserve and promote it, in keeping with the idea that today, a monument it no longer an object to observe in and of itself, but is an active part of society, a generator not only of cultural but also economic and social resources.
The challenge for the near future is to create a reliable system for circulating and utilizing said data. Another point to deal with is the codification of standardized work methods applied to the wide range of available digital models, which would allow us to produce a homogeneous documentation of cultural heritage. In addition to data management and organization, another important note is their conservation. We are well aware that we currently utilize only a small percentage of the total problematic. Viewers freely available and downloadable on the web constitute a resource that has yet to be fully exploited.
4.1 References
Metric Survey Specification for Cultural Heritage, Andrews, D.(ed.), 2009. English Heritage, Kemble Drive, Swindon.
Angheluta, L.M., Radvan, R., Ene, D., 2010. Digital mapping of on-site related photonic investigations over a 3-D surface area. Coalition, 20, pp.7-11.
Binda, L., Baronio, G., Penazzi, D., Palma, M., Tiraboschi, C., 1999. Caratterizzazione di murature in pietra in zona sismica: Data-Base sulle sezioni murarie e indagini sui materiali, in Proceedings of IX Convegno Internazionale L’Ingegneria Sismica in Italia, Turin, 20-23 September. CD-Rom.
Cámara, L., 1996. La documentación gráfica: fotogrametría y base de datos. In: Arqueología de la Arquitectura. El método arqueológico aplicado al proceso de studio y de intervención en edificios históricos, Burgos, Spain, pp. 23-40.
Cundari, C., 1982. Fotogrammetria architettonica. Edizioni Kappa, Roma.
Feilden M.B., 1987. Photogrammetry and Earthquakes. In: Between two Earthquakes, ICCROM, pp.66-69.
Mannoni, T., Cagnana, A., Falsini, S., Ghislanzoni, P., Pittaluga, D., 1991. Archeologia ed archeometria dei muri in pietra. Superfici e strutture in Liguria. In: Le pietre
nell’Architettura: strutture e superfici, Bressanone, Italy, pp.
151-162.
Parenti, R., Vecchi, A., Gilento, P. 2008. Archeologia
dell’architettura e rischio sismico. In: Archeologia
dell’Architettura XIII, All’insegna del Giglio, Firenze, Italy, pp.
15-28.
Rodríguez Miranda, A., Valle Melón, J.M., Lopetegi Galarraga, A., 2007. Time transcendence, metadata and future utilization in 3D models of point clouds for heritage elements. In: Proceedings of Virtual Retrospect, Bordeaux, France, pp.115-123.
Valle Melón, J.M., Rodríguez Miranda, A., Sanz Adán F., 2008. Importancia del Proyecto en la Documentación Geométrica del Patrimonio. In: Proceedings of International Congress on Geomatic and Surveying Engineering, Valencia, Spain, pp.445-457.
Figure 18. Aerial view of the archaeological site of Umm-as Surab, Jordan. (from APAAME)
Figure 19. 3D archaeological drawing (interfaces) on wall surface texture (Umm as-Sarab-Jordan), elaborated by Pietro Caciagli.