THE 0.4 ARC-SEC TANDEM-X INTERMEDIATE DEM WITH RESPECT TO THE SRTM
AND ASTER GLOBAL DEMS
D.I. Vassilaki∗, A.A. Stamos
National Technical University of Athens 9 Iroon Polytechniou Str, 15780 Zografos, Athens, Greece
[email protected], [email protected]
KEY WORDS:Global, DEM, Satellite, SAR, TerraSAR-X, TanDEM-X
ABSTRACT:
Recently a preliminary version of the new global DEM collected by the TanDEM-X mission became available to the scientific commu-nity: the TanDEM-X Intermediate DEM (IDEM) version. It is available over selected areas of the globe with a pixel spacing of 0.4, 1 and 3 arc-seconds. This paper presents the TanDEM-X IDEM with respect to global and local elevation data over Aegean Islands with mountainous terrain: the SRTM and ASTER global DEMs, and the national network of triangulation pillars (trig-points) and national archive Digital Terrain Model. Possible systematic 3D translations between global DEMs and local data are also determined and the relative gain in accuracy is assessed. TanDEM-X IDEM is shown to be dramatically enhanced with respect to the other global DEMs although a few jitters exist.
1. INTRODUCTION
Global DEMs are important tools for Earth Observation and they are used extensively in countless applications for both practical and research purposes. The most well-known and used global DEMs are the SRTM and the ASTER. Just recently, a preliminary version of the TanDEM-X DEM became available to the scientific community: the TanDEM-X Intermediate DEM (IDEM) version (DRL, 2013). The TanDEM-X IDEM is provided by the DLR in order to create a first impression of the final DEM to appear, and it is available for specific areas of the world. In this light, this paper presents the TanDEM-X IDEM and studies it with respect to the SRTM and the ASTER global DEMs through visual inspection and more objectively through the computation of the error of all three DEMs with respect to local and more accurate elevation data. The process is applied to extensive areas over a few test sites.
Furthermore, the accuracy of global DEMs is optimised for the whole surface of the Earth, trading local accuracy for global ac-curacy. As a result, a systematic planar translation error between global and local more accurate DEMs usually exists. In this pa-per the systematic planar displacement is computed indirectly through the computation of the RMSE of the global DEM ele-vations with respect to more accurate eleele-vations taken from local DEM data. A combination of the exhaustive search and divide-and-conquer algorithms is used to compute the planar displace-ments of the global DEMs which minimise the RMSE of the el-evations (Vassilaki and Stamos, 2014). A systematic elevation translation error between the DEMs is also computed. The pro-cess is applied to all three global DEMs and the study of the pre-vious paragraph is repeated. The results of the study show that the TanDEM-X IDEM is much denser and more accurate than the other two global DEMs, although a few points exhibit gross error.
2. STUDY SITE
The study area is the area of the Aegean Islands, Greece and more specifically the Northeastern Aegean Islands, the Cyclades and
∗Corresponding author.
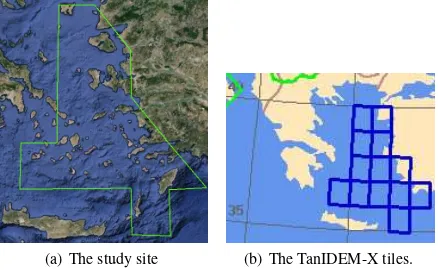
(a) The study site (b) The TanIDEM-X tiles.
Figure 1. Study site and data sets.
the Dodecanese (Figure 1(a)). This study area is a special case of Earth’s surface: large number of scattered islands of various sizes, mountainous terrain, lack of forested areas, absence of tall buildings etc. The study site exhibits geological activity as it is located on the Aegean Sea Plate which is a small plate between the Eurasia plate, the Anatolia plate and the Africa plate. There are also active volcanos in islands such as Santorini and Nisyros (Hellenic volcanic arc). As a result, the terrain is irregular and ragged (not flat). At the same time, this area of the world is one of the sites where the TanDEM-X IDEM (Figure 1(b)) is available at the highest posting class (12m).
3. DATA SETS
The data sets used in this paper are the ASTER and the SRTM global DEMs, the TanDEM-X IDEM and local DEMs and eleva-tion data. The ASTER and the SRTM DEMs were collected from space and are available free of charge. The SRTM DEM was collected using single-pass C-band SAR interferometry (Bam-ler, 1999), while the ASTER DEM was collected using single-pass optical stereo (ASTER GDEM validation team, 2009). Both DEMs have nearly global coverage: The SRTM DEM is available from 56◦S to 60◦N while the ASTER DEM is available from 83◦S to 83◦N. The SRTM DEM until very recently was avail-able only with the resolution of 3 arc-seconds (about 90 m) used
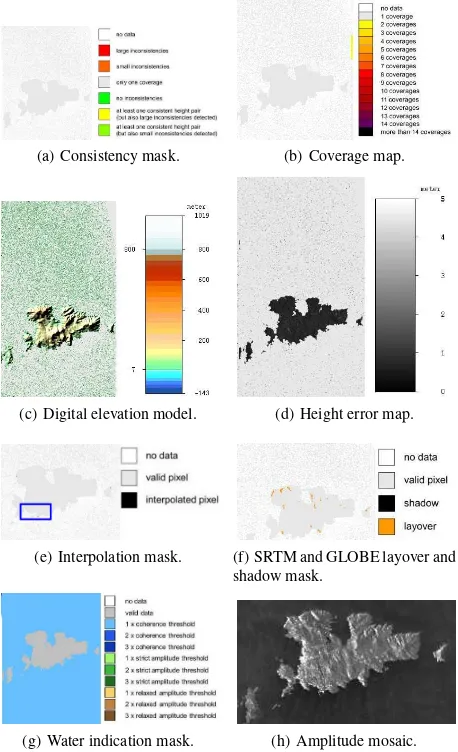
(a) Consistency mask. (b) Coverage map.
(c) Digital elevation model. (d) Height error map.
(e) Interpolation mask. (f) SRTM and GLOBE layover and shadow mask.
(g) Water indication mask. (h) Amplitude mosaic.
Figure 2. Psarrou study site (marked in blue). The TanDEM-X IDEM data, cDLR 2014.
in this paper, but now both the SRTM and the ASTER DEMs are distributed with a resolution of 1 arc-second (about 30 m). The TanDEM-X DEM is collected using X-band SAR sensors on board of the TerraSAR-X and the TanDEM-X satellites (Mor-eira et al., 2004). The two SAR sensors operate practically like a single-pass interferometer configuration, and are currently col-lecting a fully global DEM with a resolution of 0.4 arc second (about 12 m). This paper uses a preliminary version of TanDEM-X DEM, namely TanDEM-TanDEM-X IDEM which is provided to the au-thors by DLR under the scientific proposal IDEM-METH0140. The local elevation data consists of an old archived paper map of intermediate scale (1:5000) compiled photogrammetrically in 1983 and is part of a map series that span the territory of Greece, as well as high accuracy solitary triangulation pillars (trig-points) produced by accurate geodetic triangulation and available all over Greece as national triangulation network. The relative planar ac-curacy of the map is estimated at 1.5 m. The vertical contour in-terval is 4 m and the relative vertical accuracy is estimated at 2 m. The absolute planar accuracy is estimated at 2.5 m and the verti-cal one at 4 m. The map was scanned, rectified and digitised using in house developed software (Stamos, 2007) in order to produce a local DEM. The local DEM is used as continuous control infor-mation while the trig-points are used as solitary control points. All local data provides elevation on the ground, while all three global DEMs are DSMs and they thus provide elevations on top of the trees, buildings and other man-made structures. Although buildings and trees are sparse in the study area, this difference
affects the RMSE between global and local data.
4. METHODOLOGY
The available data sets are heterogeneous and extensive reference system transformations are needed for a uniform study. All three global DEMs are defined with latitude and longitude geographic coordinates, but the ASTER and the SRTM DEMs provide or-thometric elevations while the TanDEM-X IDEM provides geo-metric (ellipsoidal) elevations. All local data is defined in map projection coordinates and orthometric elevation. The control points are defined in the projection of the Hellenic Geodetic Ref-erence System 1987 (HGRS87), while the DEM is defined in an older projection. HGRS87, which is selected as a common ref-erence for all data, is a non-geocentric national refref-erence system based on the GRS80 ellipsoid and the transverse Mercator car-tographic projection suitably adjusted to fit the territory of the country. Each individual geometric elevation is converted to or-thometric elevation by interpolation to the geoid undulation pro-vided by the global geoid model EGM2008 (Pavlis et al., 2008). More details for the conversions can be found in (Vassilaki et al., 2013).
After the transformation of all available data (global and local) to map projection coordinates (HGRS87) and orthometric eleva-tions, the computation of the difference, or RMSE, of the three global DEMs with respect to each local data set is computed as:
RM SE=h1
whereLstands for the more accurate local DEM andGfor the global DEM. Equation 1 is evaluated for all the nodes of the local DEM which are denser than the nodes of the global DEM, and thus no interpolation is necessary for the local DEM. In the case of the solitary control points, Equation 1 is evaluated for all these control points.
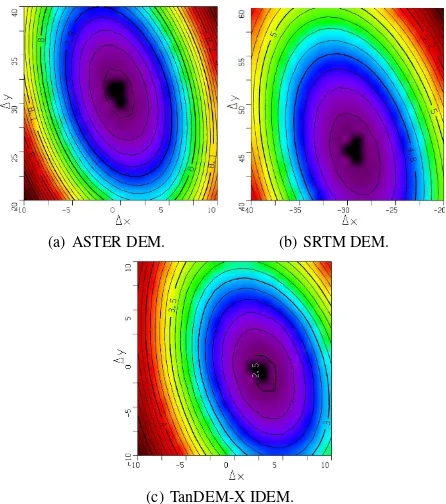
The translation (DX, DY) between the global and the local DEMs is computed indirectly through the computation of the RMSE in combination with exhaustive search. All possible combinations of DX and DY are tried and the one which gives the least RMSE is the optimum (Figure 4). It is assumed that the translation is no greater than 100 m, which is larger than all global DEMs’ step or pixel/grid size (this choice is upheld later by the application of the method). The step of the exhaustive search was taken as 1 m which is much smaller than the global DEM’s step. The exhaustive search with this range and step (-100 to 100, step 1) needs201×201 = 40401evaluations of the RMSE, and each evaluation needs tens of thousands of DEM interpolations, geoid interpolations and other computations, an appreciable computa-tional load. While this computacomputa-tional load is doable with modern computers, it is relatively easy to speed up the process by the divide-and-conquer algorithm. The algorithm begins with a large step (10 m) and computes the optimum (DX, DY). Then it de-creases the step to one fifth of its value and a new optimum (DX, DY) is searched for in the vicinity of the previous optimum (DX, DY). The process is repeated until the step is small enough, for example 0.1 m. The algorithm is shown in Figure 3.
Given the optimal translation (DX, DY), the systematic transla-tion DZ in elevatransla-tions can be easily computed as
Computation of optimal translation of global DEM
Translate local DEM or control points by DX, DY. Compute RMSE e between global and local DEM. Ife < emin:
−DXmin,−DYminis the optimal translation of global DEM.
End of computation of optimal translation.
Figure 3. Exhaustive search/Divide-and-Conquer algorithm.
whereZ′
i,Lstands for the elevation of the local DEM translated by (DX, DY). The (random) RMSE is now computed by Equation 1 substituting Z byZ′′which is the elevation of the local DEM translated by (DX, DY, DZ). The whole process was implemented by the authors and was embedded for convenience into ThanCAD (http://thancad.sourceforge.net), an open source CAD (Stamos, 2007).
(a) ASTER DEM. (b) SRTM DEM.
(c) TanDEM-X IDEM.
Figure 4. Psarrou study site. Elevation RMSE with respect to planar translation (DX, DY).
5. THE GLOBAL DEMS VS A LOCAL DEM
This section presents comparisons of the three global DEMs to the local DEM as well as visual comparisons among them, over
ASTER SRTM TanIDEM-X
RMSEoriginal 9.0 8.4 2.6
Table 1. Psarrou study site. RMSE (m) of the 3 global DEMs with respect to the local DTM. (DX,DY,DZ)=(0,0,0).
ASTER SRTM TanIDEM-X
(DX,DY) (0,31) (-29,45) (3,-1)
RMSE(DX,DY) 7.8 4.6 2.5
DZ -4.5 0.6 0.3
RMSE(DX,DY,DZ) 6.4 4.5 2.5
Table 2. Psarrou study site.The 3 global DEMs over the Mykonos study site with respect to local DTM data. (DX,DY,DZ) as de-fined in this table.
a study site in the broad area of Psarrou, Mykonos island. The area, which is in the south of Mykonos, covers 6.8Km2
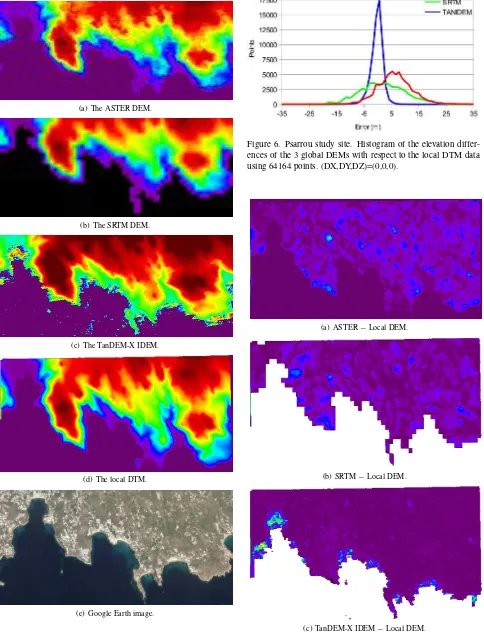
. Figure 2 illustrates the TanDEM-X IDEM data over the broader area of the study site. Figure 5 illustrates a Google Earth image of the study site, the three global DEMs and the local DEM. The colour code of the elevations is the same for all 4 DEMs (red and dark red are the highest, blue and violet the lowest).
The different resolution of the three global DEMS is quite ob-vious as SRTM (about 90 m resolution) is the blurriest, ASTER DEM (about 30 m resolution) is less blurry and TanDEM-X IDEM is the clearest and the most detailed one, properties which also correspond to higher accuracy (Table 1, Figure 6). The colours, or elevations, are roughly the same for all three global DEMs (and the local DEM) except for the coastline of TanDEM-X IDEM, where there is jitter and which unfortunately corresponds to lower accuracy (Figure 7(c)). The jitter is predicted by TanDEM-X IDEM metadata as shown in Figure 8. TanDEM-X IDEM also provides elevations at the area of the sea which were ignored in this study.
Table 1 shows the computed RMSE of each of the three global DEMs with respect to the local DEM, in the original positions (no translation). The RMSE for the TanDEM-X IDEM is three times lower than the RMSE of the ASTER and the SRTM DEMs over the specific study site. Figure 6 shows the histogram of the errors of the global DEMs with respect to the local DEM. It is evident that ASTER SRTM have much larger standard deviation than TanDEM-X IDEM and the mean error of TanDEM-X IDEM is sharply defined and near zero (0.6 m) in contrast to the other DEMs. Figure 7 shows the elevation differences between each of the three global DEMs and the local DTM, in the same colour code as Figure 5. TanDEM-X IDEM has clearly lower elevation differences than the other two DEMs. All three global DEMs have areas with larger differences near the coastline. These dif-ferences are even larger and more evident in TanDEM-X IDEM.
The methodology of Section 4. was individually applied to each global DEM, and the systematic displacement (DX, DY, DZ) of each one was computed (Figure 4). Table 2 shows the computed planar translation (DX, DY) and the computation of the RMSE after the application of this translation. TanDEM-X IDEM has practically zero (DX, DY) while ASTER and SRTM have con-siderably larger (tens of meters). Relative to the step (pixel size) of the DEMs, (DX, DY) is roughly 1 pixel for ASTER, 0.5 pixel for SRTM and 0.25 for TanDEM-X IDEM, which is remarkable given the high resolution and accuracy and global coverage of TanDEM-X IDEM, the age of the local DEM and the multitude of geodetic transformations applied. The RMSE of ASTER and SRTM is reduced as expected after the application of the com-puted (DX, DY), but still the RMSE of the TanDEM-X IDEM is much lower. Table 2 also shows the computed translation DZ and
(a) The ASTER DEM.
(b) The SRTM DEM.
(c) The TanDEM-X IDEM.
(d) The local DTM.
(e) Google Earth image.
Figure 5. The Psarrou study site in the Mykonos island.
Figure 6. Psarrou study site. Histogram of the elevation differ-ences of the 3 global DEMs with respect to the local DTM data using 64164 points. (DX,DY,DZ)=(0,0,0).
(a) ASTER−Local DEM.
(b) SRTM−Local DEM.
(c) TanDEM-X IDEM−Local DEM.
Figure 8. Psarrou study site. Height error map created using TANDEM-X IDEM metadata, cDLR 2014.
the computation of the RMSE after the application of this trans-lation. Again, TanDEM-X IDEM has practically zero DZ and so does SRTM, while ASTER has significantly larger DZ. Ac-cordingly, the RMSE of TanDEM-X IDEM and SRTM is prac-tically unaffected, while the RMSE of ASTER is reduced. Still, the RMSE of TanDEM-X IDEM is almost half of SRTM and less than half of ASTER.
6. THE GLOBAL DEMS VS LOCAL ELEVATION DATA
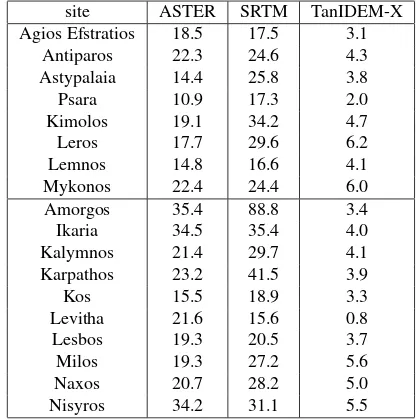
This section presents comparisons of the three global DEMs with respect to elevation data (trig-points) over 18 Aegean islands. Ta-ble 3 shows the names of the islands and the number of control points available for each island. The elevation of TanDEM-X IDEM at the location of a few of these points was not computed as TanDEM-X IDEM had invalid (or no) measurements there. Furthermore, the elevation of TanDEM-X IDEM at a few other points had gross error (over 30 m – 3 standard deviations) and were not taken into account as they were considered outliers. All outliers were either on steep (more or less) mountainsides, or on islets which are separated by narrow straits from the respective island. A few other points at such locations also had significant error but less than 30 m, and they were taken into account. Ta-ble 3 also shows the number of invalid points and outliers in each island, and the number of points that were taken into account. Fi-nally, some points had more error than usual, as they were located on tall (for the area) buildings such as churches and light-houses.
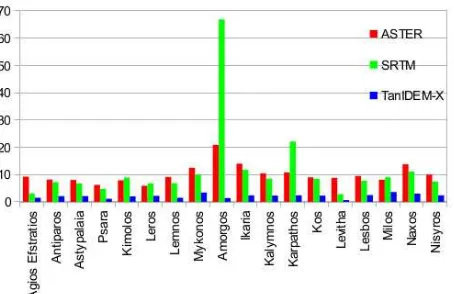
Table 4 and Figure 9 show the computed RMSE of each of the three global DEMs with respect to the local data of each island, in the original positions (no translation). The RMSE of TanDEM-X IDEM is dramatically lower than both SRTM and ASTER. The relatively high RMSE of SRTM as compared to ASTER is proba-bly due to outliers, which seem to affect SRTM (and TanDEM-X IDEM) but not ASTER.
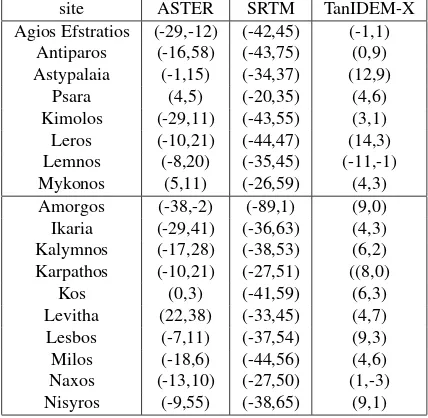
The methodology of Section 4. was individually applied to each global DEM for every island, and the systematic displacement (DX, DY, DZ) of each one was computed. Tables 5 and 6 show the computed planar translation (DX, DY) and the computation of the RMSE after the application of this translation. Again, TanDEM-X IDEM has much lower (DX, DY) while ASTER and SRTM have considerably larger (tens of meters). The RMSE of ASTER and SRTM is reduced as expected after the application of the computed (DX, DY). The RMSE of TanDEM-X IDEM is also reduced and it remains the lowest.
Tables 7 and 8 and Figure 11 show the computed systematic translation DZ and the computation of the RMSE after the appli-cation of this translation. TanDEM-X IDEM has much less DZ than SRTM and ASTER and in fact the same is true for the trans-lation distance√DX2+DY2+DZ2
as shown in Figure 10. The RMSE of all DEMs was reduced more or less proportionally to the systematic translation DZ. As it can be seen, the RMSE of
site available invalid outliers used
Agios Efstratios 25 - - 25
Antiparos 16 - - 16
Karpathos 58 1 6 51
Kos 55 3 2 50
Table 3. Number of available control points, invalid points and outliers in each island.
site ASTER SRTM TanIDEM-X
Agios Efstratios 18.5 17.5 3.1
Antiparos 22.3 24.6 4.3
Table 4. RMSE (m) of the global DEMs with respect to local elevation data. (DX,DY,DZ)=(0,0,0).
TanDEM-X IDEM is one third or less of the RMSE of SRTM or ASTER.
7. DISCUSSION
In this paper the 0.4 arc-sec TanDEM-X IDEM is studied with respect to the ASTER and the SRTM global DEMs using local DEM and local elevation data. The TanDEM-X IDEM is a pre-liminary version of the final TanDEM-X DEM which is expected to appear in the near future. It is provided by DLR for a few areas in order to create a first impression of the final DEM. Further-more, the present study is still in progress as the data for some of these areas has not yet been analysed. In this light, the present study shows strong evidence that the expected final TanDEM-X global DEM will be dramatically enhanced with respect to the ASTER and SRTM global DEMs, both qualitative and quantita-tive:
• TanDEM-X IDEM’s resolution is much better (about 12 m) than both SRTM (about 90 m) and ASTER (about 30 m)
Figure 9. RMSE (m) of the global DEMs with respect to local elevation data. (DX,DY,DZ)=(0,0,0).
site ASTER SRTM TanIDEM-X
Agios Efstratios (-29,-12) (-42,45) (-1,1) Antiparos (-16,58) (-43,75) (0,9)
Table 5. Systematic translation (DX, DY) of the global DEMs with respect to local elevation data.
site ASTER SRTM TanIDEM-X
Agios Efstratios 17.3 10.8 3.1
Antiparos 20.6 18.9 3.7
Table 6. RMSE (m) of the global DEMs with respect to local elevation data. (DX,DY) as shown in Table 5.
site ASTER SRTM TanIDEM-X
Agios Efstratios -14.7 -10.4 -2.7
Antiparos -19.0 -17.5 -3.0
Table 7. Systematic translation (DZ) of the global DEMs with respect to local elevation data.
Figure 10. 3D translation distance D of the global DEMs with respect to the local elevation data.
site ASTER SRTM TanIDEM-X
Agios Efstratios 9.2 3.1 1.5
Antiparos 8.2 7.2 2.1
Figure 11. RMSE (m) of the global DEMs with respect to local elevation data. (DX,DY,DZ) as shown in Tables 5, 7.
• The better resolution is accompanied with much better accu-racy, as TanDEM-X IDEM’s raw accuracy (without system-atic translation) is more than 3 times better than both SRTM and ASTER.
• TanDEM-X IDEM’s accuracy taking into account system-atic translation is at least 2 times better than both SRTM and ASTER, and at least 3 times better in the vast majority of islands tested.
However there are a few jitters (points with gross error), on the coastline (which are also predicted by the metadata - Figure 8), on steep mountainsides, and on islets which are separated by narrow straits from the respective island. The jitters on the coastline tend to fall in the last two categories.
The elevations provided by TanDEM-X IDEM are geometric and in most practical cases must be converted to orthometric. This does not pose any problem as global and accurate geoids are read-ily available. In this paper the EGM2008 is used which is one of the most accurate global geoid models (about 0.2 m) according to the International Centre for Global Earth Models (ICGEM). Alternatively the EIGEN model could be used, or more accurate local geoid models if available and/or accessible. Care should be exercised to select a geoid model whose error does not dominate the considerable accuracy of TanDEM-X IDEM.
Last but not least it should be noted that TanDEM-X IDEM (and TanDEM-X DEM in general) has a wealth of useful metadata, and future research should exploit it, more than this study did.
ACKNOWLEDGEMENTS
This research has been co funded by the EU (European Regional Development Fund - ERDF) and Greek national funds (General Secretariat of Research and Technology - GSRT) under the de-cision 7136/2014. The local elevation data belong to various national mapping and cadastral agencies, the optical images are taken from Google Earth, the ASTER DEM is taken from Japan Space Systems (http://gdem.ersdac.jspacesystems.or.jp/) and the SRTM DEM is taken from CGIAR-CSI (http://srtm.csi.cgiar.org). The TanDEM-X IDEM data is provided by the German Space Agency. The authors are grateful for the provision of the funding and the data.
REFERENCES
ASTER GDEM Validation Team: METI/ERSDAC, NASA/LPDAAC, USGS/EROS, 2009. ASTER Global DEM Validation, Summary Report, 28 p.
Bamler, R., 1999. The SRTM Mission: A World-Wide 30 m Res-olution DEM from SAR Interferometry in 11 Days. Photogram-metric Week 99, pp. 145–154.
German Aerospace Center, 2013. TanDEM-X, Ground segment: DEM products specification document. Doc TD-GS-PS-0021, Issue 3.0, 43 p.
Moreira, A., Krieger, G., Hajnsek, I., Hounam, D., Werner, M., Riegger, S. and Settelmeyer, E., 2004. TanDEM-X: a TerraSAR-X add-on satellite for single-pass SAR interferome-try. IGARSS’04. Proceedings. 2004 IEEE International vol. 2, pp. 1000–1003.
Pavlis, N.K., Holmes, S.A., Kenyon, S.C. and Factor, J.K., 2008. An earth gravitional model to degree 2160: EGM2008. 2008 General assembly of the European Geosciences Union in Vienna, Austria, April 13–18.
Stamos, A.A., 2007. ThanCad: a 2dimensional CAD for engi-neers. Proceedings of the Europython2007 Conference, Vilnius, Lithuania.
Vassilaki, D.I., Stamos, A.A. and Ioannidis, C., 2013. Rapid Ge-ometric Correction of SSC Terrasar-X Images with Direct Geo-referencing, Global dem and Global Geoid Models. International Archives of Photogrammetry, Remote Sensing and Spatial Infor-mation Sciences, XL-1/W1, pp. 357–362.
Vassilaki D.I. and Stamos A.A., 2014. Global DEM’s accuracy improvement with respect to local DEM data. 34th EARSeL Symposium Proceedings, pp. 2.49–2.53.