EVALUATION OF TRMM PRECIPITATION PRODUCTS
OVER INDIAN SUBCONTINENT
J. Indu a *, D. Nagesh Kumar a
a Dept. Of Civil Engineering, Indian Institute of Science, Bangalore, India ([email protected], [email protected])
Commission VI, WG VI/4
KEY WORDS: TRMM, 3B43, 3A12, PR, TMI, Radar
ABSTRACT:
Quantitatively accurate estimates of precipitation at high spatial resolutions often rely on a combination of individual satellite retrieved estimates merged using suitable techniques. Precipitation estimates from these merged data products are extensively being used by scientists and researchers for various hydro meteorological and climatological applications. The intent of this study is to evaluate the performance of gridded precipitation estimates from Tropical Rainfall Measuring Mission (TRMM) namely the 3A12 (from passive radar TRMM Microwave Imager i.e. TMI), 3A25 (from active radar Precipitation Radar i.e., PR) and 3B43 (combined data product). For this purpose, the present study utilizes 6 years of daily rainfall of spatial resolution 10x10. Data period chosen is the Indian summer monsoonal months of JJAS from June 2002 to September 2007. Results indicate that over India, the TMI derived 3A12 product tends to overestimate rainfall compared to the PR derived 3A25 product for the seasonal data period. The 3A12 data product represents gridded monthly accumulations of the level 2 TMI derived 2A12 data product. The land rainfall algorithm of 2A12 is well known to be dependent on the 85 GHz high frequency channel. The present study conducts sensitivity analysis of 20 combinations of TMI frequency channels with respect to rainfall rate. The results conclude that a combination of TMI low frequency channels are better suited to model rainfall thereby questioning the usage of 85 GHz frequency channel for the generation of 2A12 rainfall estimates.
* J. Indu, Junior Research Associate, Water Resources and Environmental Engineering Division, Dept. of Civil Engineering, IISc Bangalore 1. INTRODUCTION
The Indian summer monsoonal rainfall is an integral part of the south Asian monsoon which plays a major role in global water cycle. Accurate prediction of this monsoon rainfall at high resolutions not only assists the Indian sectors of agriculture, water resources and hydro-electricity, but also facilitates weather and climate forecast studies. The intermittent character of rainfall creates difficulty in accurately modelling the dynamic surface hydrologic state, requiring rainfall data at the highest possible resolution. To circumvent this issue, users rely on space borne observations that promote understanding of terrestrial hydrology over both the gauged and ungauged regions (Hossain and Lettenmaier, 2006). To cater to the needs of various users, different satellite based rainfall products have been developed on a global scale (Anagnostou, 2004; Ebert et al. 2007).
Among the many publicly available products from satellite remote sensing available at a global scale, the data from the low earth orbiting satellite of Tropical Rainfall Measuring Mission (TRMM) launched in 1997, have revolutionized the global view of precipitation. The TRMM satellite, launched into a near circular orbit, is a joint mission between National Aeronautics and Space Administration (NASA) of the United States and the National Space Development Agency (NASDA) of Japan. TRMM studies rainfall variability in the tropics using a collocated suite of instruments namely the passive sensor called
TRMM microwave imager (TMI) and the active sensor of precipitation radar (PR).
The TRMM satellite precipitation algorithms have undergone a series of refinements since their launch and each time they have been released intermittently labelled with a different version number. TRMM Version 5 (v5) was released in November 1999, version 6 (v6) was released in April 2004 and the latest version 7 (v7) was released in October 2011. These data products are made available in levels 1, 2 and 3 respectively. For the present study, the latest v7 gridded monthly precipitation products from level 3 are employed namely, 3A25 from PR, 3A12 from TMI and TRMM Multisatellite Precipitation Analysis data of 3B43. They are processed and made available by the NASA Goddard Space Flight Center (GSFC) and NASDA Earth Observation Center (EOC). More information about these data products can be obtained in the following link: http://tsdis.gsfc.nasa.gov.
These data products are known to suffer from biases caused due to algorithmic errors, sampling and representation errors. Regional differences are also known to exist between them which offer difficulty in validating their rainfall products. Satellite based algorithms which are developed for the future should be capable of fully characterizing the uncertainties at relevant spatiotemporal scales. Keeping this in mind, this study compares seasonal rainfall estimates over the Indian subcontinent from three of the TRMM data products which are deemed to play an instrumental role for the success of the mission. The details regarding various data products used for The International Archives of the Photogrammetry, Remote Sensing and Spatial Information Sciences, Volume XL-8, 2014
ISPRS Technical Commission VIII Symposium, 09 – 12 December 2014, Hyderabad, India
This contribution has been peer-reviewed.
this study are explained in section 2, followed by the discussion Precipitation Feature (PF) database. This database summarizes the precipitation events from the TRMM dataset and has been developed within the framework of PFs as defined by Nesbitt et al. (2000). The mainstream benefit of the PF database is to generalize the precipitation and cloud features from TRMM instruments to examine the radar, passive microwave characteristics of precipitation systems in the Tropics (Liu, 2007).The PF is defined by grouping contiguous pixels having rainfall rate from PR 2A25 data products greater than 0 (Iguchi et al. 2000). The characteristics of each PF are summarized using collocated measurements and retrievals from the five sensors of TRMM namely, PR, TMI, Visible and Infrared sensor (VIRS) and Lightning Imaging System (LIS). Using the level 1 product from this database, a set of cloud and precipitation features are defined. More information regarding this database can be obtained from the following link: ftp://trmm.chpc.utah.edu.The present study utilizes the 10x 10 gridded level 3 Radar Precipitation Feature (RPF) data from this database. The data used for the present study comprises of monthly precipitation estimates from the radar precipitation feature (RPF) consisting of the PR derived 3A25 (monthly gridded means from PR level 2 2A25 data), TMI derived 3A12 (monthly gridded means from the level 2 2A12 data) and the 3B43 data (monthly gridded data containing best rainfall estimate from TRMM, geosynchronous infrared data and rain gauge data).
Under the Asian Precipitation Highly Resolved Observational Data Integration Towards Evaluation of the Water Resources (APHRODITE) project, a high resolution daily rainfall data set was developed for the Asian Regions. The basic algorithm used in creating this data set is based on Xie et al. [2007]. The gridded fields of daily precipitation are defined by interpolating rain-gauge observations obtained from meteorological and hydrological stations throughout the region. APHRODITE rainfall products are being extensively used for validating high resolution climate model simulations [Yatagai et al., 2005] as well as for statistical downscaling of climate simulation outputs [Kumar and Krishnamurti, 2012]. Studies by Yatagai et al. [2014] have relied on APHRODITE rainfall data products for adjusting the TRMM derived 3B43 rainfall data product. Studies conducted comparing daily rainfall estimates from APHRODITE with those from the Indian Meteorological Department’s (IMD) rain gauges indicated a high correlation. Further, a quantitative analysis of this product over India yielded a difference of less than 3 mm/day [Rajeevan and Bhate, 2009]. In the light of the above studies, the present work compares the gridded TRMM data products from RPF with respect to the gauge based daily rainfall data from APHRODITE.
3. RESULTS AND DISCUSSION
This section discusses the performance of monthly accumulated precipitation data during the Indian summer monsoonal season from June 2002 to September 2007 gridded to 10 x 10 grids over India.
3.1 Seasonal Performance over India
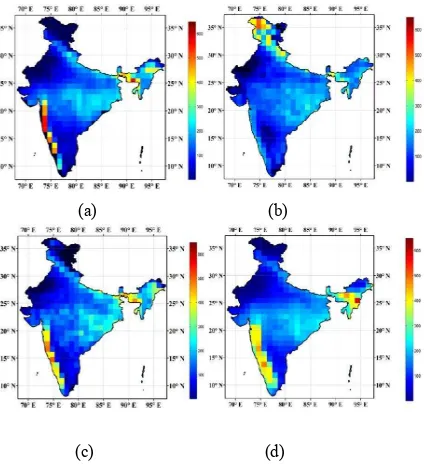
To quantitatively demonstrate the variations of precipitation obtained from different sensors, the accumulated seasonal rainfalls were estimated for 10 grid boxes over India for seasonal rainfall during the data period of 6 years (2002 to 2006) using the three TRMM data products along with the rainfall from APHRODITE data. These are shown in Figure 1. It can be observed that the TMI derived 3A12 data product tends to overestimate rainfall especially along the northern parts of India and underestimates rainfall along the south western coastline of India. The PR derived 3A25 data product and the combined 3B43 product was found to capture rainfall in a much better manner. The 3B43 data product was found to exhibit the highest correlation of 0.64 when compared with the reference data from APHRODITE.
(a) (b)
(c) (d)
Figure 1 Seasonal accumulated precipitation from June 2002 to September 2007 from (a) APHRODITE (b) 3A12 (c) 3A25 and (d) 3B43
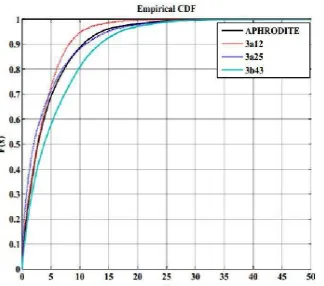
Figure 3 shows the empirical cumulative distribution functions plotted for rainfall from all the three TRMM data products along with reference rainfall. This plot indicates that the PR derived 3A25 data product comparatively matches well with the reference rainfall. Comparative evaluation of the results indicates that anomalies were observed over the south western coastline and northern extent of India. In order to further evaluate the cause of this anomaly, focus was extended to the 2a12 land rainfall algorithm.
The International Archives of the Photogrammetry, Remote Sensing and Spatial Information Sciences, Volume XL-8, 2014 ISPRS Technical Commission VIII Symposium, 09 – 12 December 2014, Hyderabad, India
This contribution has been peer-reviewed.
(a) (b) (c)
Figure 2 Scatter plots of APHRODITE data with respect to (a) 3A12 (b) 3A25 and (c) 3B43
Figure 3 Empirical cdf of accumulated seasonal rainfall from June 2002 to September 2007
3.2 Sensitivity Analysis of TMI frequency channels The 2A12 land rainfall algorithm which is used to generate the gridded 3A12 precipitation data depends strongly upon the ice scattering signal from the 85 GHz channel which is responsible for causing false estimates of high rainfall rates. Hence, further focus was exerted on the sensitivity of various TMI frequency channels to rainfall rates.
Recent studies by You et al. (2011) using 3 years (1998 to 2000) of TRMM orbital data examined the correlation coefficients between PR NSR and TMI Tb using 81 channels (9 TMI channels + 72 channel combinations from the 9 TMI channels) for the overland regions of tropics. Their study picked up 20 channel combinations that were highly sensitive to NSR. Hence, the present study utilizes the TMI channel sensitivities using the robust spearman rank correlation coefficient for these 20 channel combinations. For each of the JJAS months, the spearman rank correlation coefficients were calculated for both stratiform and convective rainfall types and Fisher’s test was carried out to estimate the statistical significance between correlation differences.
Results indicate that for stratiform rainfall, channels of 21V-37V (for June, July) and 19V-21V-37V (for August, September) were found to represent highest correlation with NSR. On the other hand, channels of 19H-37V (for June) and 19V-37V (for July, August and September) were obtained as most sensitive to overland convective rainfall. In comparison with 85V channel, these channels explain more variability in NSR. Statistical tests
indicate that, the difference between correlation coefficients of the 85V and 19V-37V (21V-37V) are significant at 99% confidence level. The coefficient of correlation (CC) values of convective type rainfall are 0.22, 0.35, 0.33 and 0.26 for JJAS (Indu and Kumar, 2014).
(a)
(b)
Figure 4 Spearman rank correlation coefficient of the 20 TMI channel combinations with respect to PR near surface rainfall rate for (a) Convective rainfall and (b) Stratiform rainfall
4. CONCLUSION
The present study examined three precipitation data products from the TRMM satellite namely the TMI derived 3A12 data, PR derived 3A25 data and the combined 3B43 data product. Results compared over the seasonal data period from June 2002 to September 2007 indicated overestimation by 3A12 algorithm. As the 3A12 TMI derived data is a gridded accumulation of the level 2, 2A12 data, further analysis was focussed on the 2A12 data product. The 2A12 land rainfall algorithm is well known to be dependent on the 85 GHz high frequency channel. Hence, sensitivity analysis of 20 different TMI channel combinations were conducted over India both for stratiform and convective rainfall regimes. Results indicate that a combination of low frequency TMI channels is better suited to model rainfall rather than the 85 GHz high frequency channel.
Space based observation play a pivotal role in advancing our understanding about the spatial and temporal variation of precipitation intensities on a global scale. In continuation with The International Archives of the Photogrammetry, Remote Sensing and Spatial Information Sciences, Volume XL-8, 2014
ISPRS Technical Commission VIII Symposium, 09 – 12 December 2014, Hyderabad, India
This contribution has been peer-reviewed.
these efforts, the missions of Global Precipitation Measurement launched in 2014 are aimed to improvise upon the TRMM based precipitation measurements. Merged precipitation products generated by a combination of observations captured at different regions of the electromagnetic spectrum have the potential to produce long term precipitation records on a global scale.
ACKNOWLEDGEMENTS
The authors would like to acknowledge Professor Ed Zipser at the University of Utah for the use of the precipitation feature database and Professor Chuntao Liu of Department of Atmospheric Sciences at the University of Utah for useful discussions regarding the precipitation feature database.
REFERENCES
Anagnostou, E. N., 2004. A convective/stratiform precipitation classification algorithm for volume scanning weather radar observations, Meteorological Applications, vol 11, Issue 04, pp. 291-300.
Ebert, E., J. E. Janowiak, C. Kidd., 2007. Comparison of near real-time precipitation estimates from satellite observations and numerical models, Bulletin of American Meteorological Society, 88, pp 47-64.
Hossain, F., and P. L. Dennis., 2006. Flood Prediction in the Future: Recognizing Hydrologic Issues in anticipation of the Global Precipitation Measurement Mission – Opinion Paper, Water Resources Research, Vol. 44, doi:10.1029/2006WR005202.
Iguchi, T., T. Kozu, R. Meneghini, J. Awaka, and K. Okamoto .,2000. Rain-profiling algorithm for the TRMM precipitation radar, Journal of Applied Meteorology, 39, 2038-2052.
Indu, J., and D. Nagesh Kumar., 2014. Copula based Modeling of TRMM TMI Brightness Temperature with Rainfall Type, IEEE Transactions on Geoscience and Remote Sensing, Vol. 52, No. 8, pp. 4832-4845, August 2014,doi:10.1109/TGRS.2013.2285225.
Liu, C., 2007. University of Utah TRMM precipitation and cloud feature database description, v1.0, http://trmm.chpc.utah.edu/docs/trmm_database_description _v1.0.pdf.
Nesbitt, S.W., E. J. Zipser, and D.J. Cecil., 2000. A census of precipitation features in the tropics using TRMM: Radar, ice scattering, and lightning observations,J. Climate, 13(23), 4087-4106
Rajeevan, M., and J. Bhate., 2009. A high resolution daily gridded rainfall data set (1971-2005) for mesoscale meteorological studies, Current Science, 96, 4, 558-562. Xie, P., A. Yatagai, M. Chen, T. Hayasaka, Y. Fukushima, C.
Liu, and S. Yang., 2007. A Gauge-Based Analysis of Daily Precipitation over East Asia, Journal of Hydrometeorology, 8, 607-627.
Yatagai, A., P. Xie, and A. Kitoh., 2005. Utilization of a new gauge-based daily precipitation dataset over monsoon Asia for validation of the daily precipitation climatology simulated by the MRI/JMA 20-km-mesh AGCM, SOLA, 1, 193-196, doi:10.2151/sola.2005-050.
Yatagai, A., T. N. Krishnamurti, V. Kumar, A. K. Mishra, and A. Simon., 2014. Use of APHRODITE Rain Gauge-Based precipitation and TRMM 3B43 Products for improving Asian Monsoon seasonal precipitation forecasts by the superensemble method, Journal of Climate, 27 (3), 1062-1069.
You, Y., G. Liu, Y. Wang, and J. Cao., 2011. On the sensitivity of Tropical Rainfall Measuring Mission (TRMM) Microwave Imager channels to overland rainfall, Journal of Geophysical Research, 116, D12203, doi:10.1029/2010JD15345.2011
The International Archives of the Photogrammetry, Remote Sensing and Spatial Information Sciences, Volume XL-8, 2014 ISPRS Technical Commission VIII Symposium, 09 – 12 December 2014, Hyderabad, India
This contribution has been peer-reviewed.