AN OPTIONAL THRESHOLD WITH SVM CLOUD DETECTION ALGORITHM AND
DSP IMPLEMENTATION
Guoqing Zhoua,*, Xiang Zhoub, Tao Yuea, Yilong Liuc
aGuangxi Key Laboratory of Spatial Information and Geomatics, Guilin University of Technology, No. 12 Jian’gan Road, Guilin, Guangxi, PR China , (gzhou, yuetao)@glut.edu.cn
b
Department of Mechanical and Control Engineering,Guilin University of Technology, No. 12 Jian’gan Road, Guilin, Guangxi, PR China , [email protected]
c
Getrag(Jiangxi) Transmission CO.Ltd, No.101 Jiaoqiao Road, Baishui Lake Industrial Park, Nanchang Economic and Technological Development Zone, Jiangxi, China, [email protected]
Commission VIII, WG VIII/7
KEY WORDS: cloud detection, DSP, SVM classifier, threshold, emulator
ABSTRACT:
This paper presents a method which combines the traditional threshold method and SVM method, to detect the cloud of Landsat-8 images. The proposed method is implemented using DSP for real-time cloud detection. The DSP platform connects with emulator and personal computer. The threshold method is firstly utilized to obtain a coarse cloud detection result, and then the SVM classifier is used to obtain high accuracy of cloud detection. More than 200 cloudy images from Lansat-8 were experimented to test the proposed method. Comparing the proposed method with SVM method, it is demonstrated that the cloud detection accuracy of each image using the proposed algorithm is higher than those of SVM algorithm. The results of the experiment demonstrate that the implementation of the proposed method on DSP can effectively realize the real-time cloud detection accurately.
1. INTRODUCTION
With the recent rapid developments of optical remote sensor, obtaining high resolution remote sensing images is an easy task now. The amounts of remote sensing images increase explosively every day, and these data have been widely used in meteorological observation and forecast, agriculture engineering, environmental protection, natural disasters monitoring, resource exploration and military reconnaissance. However, the cloud covers more than 50% of the surface of the Earth, thus the images captured by satellite mostly covered with cloud. The object information on the earth will lost because of the cloud. Hence cloud detection is an important preprocessing for many subsequent manipulations, such as object recognition, image retrieval, and image classification. It is a meaningful a challenging work. On the other hand, onboard real-time cloud detection can reduce the cost of satellite resources such as storage capacity and downlink bandwidth.1
A lot of cloud detection methods have been proposed, and most of these methods can be summarized in two major categories. The first category is based on the difference of spectral characteristics of clear and cloudy area. At the day time, the reflectivity of cloud area in the visible light band is greater than of clear area. At the same time, cloud top temperature is usually lower than the surface temperature, and the infrared thermal radiation field to outer space in the cloud areas is less than the cloud-free areas. Based on the facts mentioned above, a lot of cloud detection methods using remote sensing information have been developed. As early as 1994, based on the difference of clouds’ spectral characteristics in the infrared and visible light, Yu Fan investigated the infrared-visible light spectra in two-dimensional feature space for about a hundred of cloud samples, and presented a method to determine the various types of clouds and the corresponding distribution of clusters using satellite cloud pictures. However, using this method to identify
*
the multi-layer thin cirrus clouds is not satisfactory. The second category is based on the texture features of cloud. The mathematical methods include the pattern recognition, the clustering algorithm, maximum likelihood estimation method, neural network method and so on. Using these methods to identify the clouds and low clouds which have more complex shapes, the results are not satisfactory. The method using spectral characteristics which required a large amount of user interactions is not suitable for onboard real-time cloud detection. Hence, the method based on the texture features of cloud is adopted.
This paper proposed a novel optional cloud detection algorithm. This algorithm has two steps: the first step, apply the improved minimum cross entropy method to process initially cloud detection test image, and then obtain a rough test results. The calculate speed of the threshold method can detect cloud sub-block quickly and easily. But the detection precision of threshold value method is not good; the preliminary test results which are under a lot of cushion face blocks have been mistaken for clouds. Thus, we need to do more sophisticated detection from the rightness rough cloud detection results. The second step is using the SVM classifier to do more sophisticated detection and obtain a more accurate cloud detection results. This algorithm used in this study greatly reduces the misjudgment and improves the detection accuracy.
2. AN OPTIONAL THRESHOLD WITH SVM CLOUD DETECTION ALGORITHM
There are three methods to detect cloud by using textural information: directly using textures; using textures to assist detection; and detecting using spectral images and then classifying by combining with textures in terms of certain hardly distinguished parts.
The process of the cloud detection algorithm proposed in this paper is shown as Figure 1. Using the threshold method to detect cloud will cost a little time, but the result is not good. And support vector machine (SVM) method will obtain a high accuracy of cloud detection, but the time consumption is higher. This paper firstly utilizes the threshold method to get a coarse result, and then uses the SVM method to obtain a more accurate result. By using this scheme, it not only improves calculating speed, but also gets a higher accuracy of detection.
Figure 1. Flowchart of the proposed cloud detection algorithm
2.1 Detection based on threshold method
The cloud regions generally have higher gray values than the non-cloud regions, because the reflectivity of cloud is usually lager than that of non-cloud regions. This is the basic theory of spectrum threshold method, which was applied to distinguish the cloud and land (Desbois, 1981). Assuming
x y, is one pixelof the image, f x y
, represents the gray value of
x y . The ,cloud detection result R is defined by
where 1 refers to those pixels lying in candidate cloud regions, and 0 refers to those pixels lying in non-cloud regions. The threshold T is within the range of [0,255].
The threshold method in this paper is minimum cross entropy thresholding method. The cross entropy was proposed by Kullback under the name of directed divergence. The cross entropy measures the information theoretic distance between
two distributions
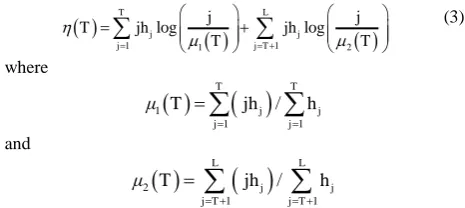
the object and the background with the threshold T. We assume that gray values in [0-T] constitute the object region, while those in [(T+1)-L] constitute the background. The cross entropy of a segmented image with threshold T is defined as:1 1 detection result using method of Otsu may lose too much cloud pixels. An optimal threshold method is proposed to address this problem, which is defined by
by analyzing the historical image data. The acquisition process is given below.
In order to determine the global threshold optima l
T , 200 cloudy
(b) (c)
Figure 2. Statistics of gray value of cloudy images. (a) Parts of collected cloud image from Landsat-8. (b) Histogram of the cloud pixels. (c) Corresponding cumulative histogram of (b).
2.2 Optimization of SVM parameters
The SVM classification is utilized to get a finer cloud detection result. At the first, we let the Radial Basis Function (RBF) has the kernel width parameter C and
in a certain range of values. Then, the training set is set as original dataset, and the k-fold cross validation method is used to get the accuracy rate of the training set under the given parameter C and
. Finally, the group of parameters C and
which verify the classification accuracy of training highest is adopted as the best parameters.The k-fold cross validation method is described as follow: the original sample is randomly partitioned into k equal size subsamples. Among the k subsamples, a single subsample is retained as the validation data to test the model, and the remaining k -1 subsamples are used as training data. The cross-validation process is repeated k times, with each of the k subsamples used once as the validation data. The k results can then be averaged (or otherwise combined) to produce a single estimation. The advantage of this method repeated random sub-sampling (see below) is that all observations are used for both training and validation, and each observation is used for validation exactly once.
To train the SVM, a training set should be established. 300 cloud sub-images and 600 non-cloud sub-images were selected from the landsat-8 satellite images as the training set, and the size of each sub-image is 64×64. Both the parameter C and
range from 2 ^ 10 ~ 2 ^10 . At first, we get a coarse selection of parameters, and then train the SVM again to get final selection of parameters from the coarse result. Finally, the best parameter calculated is that C=0.01 and0.7were used in this paper.
After then, the coarse cloud detection result was sent to the SVM classification to get final cloud detection result. As seen in the binary coarse cloud detection result, some non-cloud regions which have high intensity are included. In the second detection stage, these non-cloud regions are removed to achieve better results utilizing SVM classification.
(a)
(b)
Figure 3. Training samples
(a) (b)
Figure 4. (a) Coarse selection of parameters. (b) Final selection of parameters
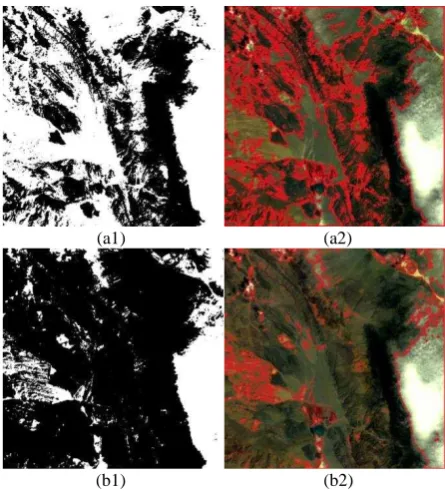
(a1) (a2)
(b1) (b2)
Figure 5. SVM detection comparisons. (a) Result before optimization. (b) Result after the optimization.
3. EXPERIMENT AND RESULT
3.1 Hardware and platform
Figure 6. (a) The whole experiment platform of cloud detection. (b) DSP platform. (c)Emulator
3.1.1 DSP platform:In order to realize the cloud detection
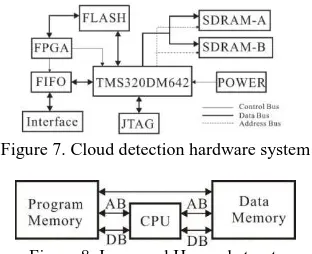
from satellite image, a real-time onboard system based on DSP was presented in Figure 7. The core compute unit of system is TMS320DM642, which has the characteristics of modular、
flexible design and scalability and maintainability. TMS320DM642 adopts advanced Harvard structure (Figure 8). The main characteristic of the Harvard structure is that the program memory and data memory are independent, which means they have independent buses. So it is possible to address the data memory and program memory at the same time. The advanced Harvard structure has cross connection between the data memory and program memory. Thus the transmission of data can be carried out between the program memory and data memory; and the CPU can perform the order of reading and writing operation in the same cycle. This feature would improve the data processing ability greatly. Another feature of the DPS is pipelined technology. The pipelined stage of TMS320DM642 is 3, which are fetch, decode and execute (see Figure 9). Ordinary CPU executes an instruction these three stages step by step. Pipelined DSP refers to overlapping operations by transferring data or instructions into a conceptual pipe with all stages of the pipe processing simultaneously. By using the pipeline mechanism, it is insurable that the DSP multiplication, addition and multiplication accumulator can be completed in a single cycle. It is important to improve the DSP operation speed, especially when we need to design a sequential algorithm of multiply accumulate operations.
Figure 7. Cloud detection hardware system
Figure 8. Improved Harvard structure
Figure 9. Pipeline
The specification of TMS320DM642 is shown in Table 1. The chip can reach 5760 MIPS (Million Instruction per Second) when it works at the frequency of 720MHz. It is capable to handle huge data at a real time. The whole system is controlled by Field Programmable Gate Array (FPGA), which provides interrupt and control signals to arrange the input and output of the image data. The program of FPGA can be reconfigured through JTAG interface to extend the function easily and flexibly. This feature improves the adaptability and flexibility of the whole system.
L1 Program
Cache 16 Kbyte Timers 3
L1 Data
Cache 16 Kbyte MHz 720
L2 Unified
RAM 256 Kbyte MIPS 5760
EDMA 64 channels McBSP 2
Core Voltage 1.2 V I/O Voltage 3.3 V Table 1 The specification of TMS320DM642
When the system starts to work, FPGA will send a control signal to FIFO (First-in First-out memory) to get image data from interface. FIFO provides two independent ports with separate control, and I/O pins that permit independent, which realizes synchronous access for reading or writing. The use of FIFO is to store image data efficiently and avoid the conflict in data bus.
Figure 10. Work flow of EDMA
3.1.2 Emulator:Real-time system needs the real-time
debugger. Real-time debugger must get the information from target CPU and control the program running on target CPU without stopping the program running on the target CPU. The TDS560USB PLUS emulator manufactured by Wintech Digital Systems Technology Corp is utilized to build a real-time communication channel between the debugger and the target CPU. There are two kinds of interfaces of TDS560USB PLUS emulator, JTAG interface for connecting DSP platform and USB interface for connecting PC. It fully plugs and plays compatibly.
There are many features of the emulator: 1) high speed of real-time data exchanging (HS-RTDX) bandwidth is over 2Mb/s; 2) code download speed is up to 512K/s; 3) wide dynamic operating voltage is 1.0 to 5.0 volts
3.2 Data set
A series of experiments have been done to demonstrate the effectiveness of proposed cloud detection algorithm. The data is acquired from the LandSat-8. The data in B4 band (wavelength: 0.63-0.68
m
), B3 band (wavelength: 0.52-0.60m
) and B2 band (wavelength: 0.45-0.52
m
) were chosen to do the experiments. The training samples are trained on PC with Intel Quad-Core CPU i5-3450 at 3.1 GHz and 4-GB RAM. The proposed cloud detection algorithm executed as demonstrated above. In order to evaluate the effectiveness of proposed cloud detection algorithm, our method were compared with other cloud detection methods.3.3 The result of cloud detection
3.3.1 Coarse cloud detection result:The coarse cloud
detection step is shown as figure 11. The true color image firstly was transformed to gray scale image, and then gray value is adopted as image feature. Gray value is a key parameter to distinguish the cloud and cloud-free pixels roughly. Then we utilized the proposed threshold method to get a coarse cloud detection result.
Figure 11. Procedure of coarse cloud detection
(a) (b)
(c) (d)
Figure 12. Threshold detection result. (a) Input image. (b) Cloud detection result based on tradition threshold method. (c)
Binary cloud detection result based on proposed threshold method (d) Cloud detection result based on proposed threshold
method
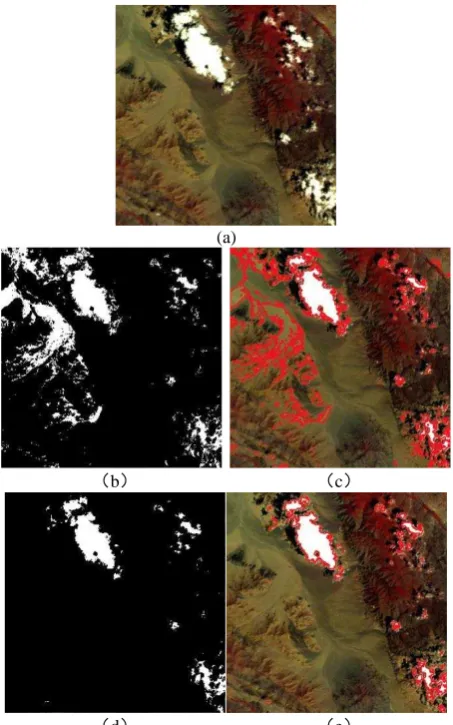
3.3.2 The final cloud detection result
(a)
δbε δcε
δdε δeε
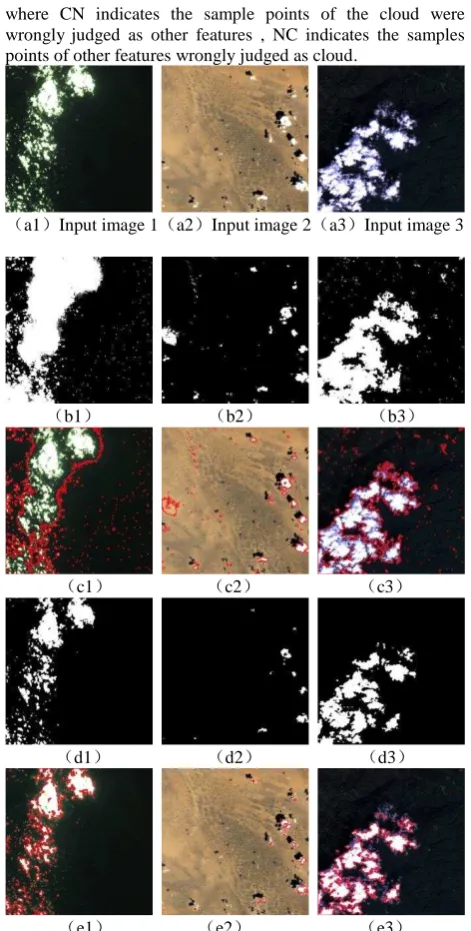
In order to illustrate the performance of cloud detection method, the quantitative method is adopted to verify the experimental results described above. We use the following two formulas to test cloud detection accuracy and detection error.
R d
DR
test
(6)where R-d is the cloud detection results of accurate identification of cloud samples, the test is the total number of samples.
error
CN
NC
P
test
(7) where CN indicates the sample points of the cloud were wrongly judged as other features , NC indicates the samples points of other features wrongly judged as cloud.a1 Input image 1 a2 Input image 2 a3 Input image 3
b1 b2 b3
c1 c2 c3
d1 d2 d3
e1 e2 e3
shown as Table 2
Figure
Method
1st 2nd 3rd
SVM 86.5% 92.1% 88.3%
Proposed
method 89.9% 94.4% 90.5%
Table 2 Accuracy for results
As can be seen from table 2, the results of two detection algorithms have the accuracy over 84%. However, the accuracy of each image in the proposed algorithm is higher than that of SVM algorithm.
The detection error is obtained by using Eq.7 is as shown as table 3
Figure
Method
1st 2nd 3rd
SVM 15.4% 14.5% 16.3%
Proposed
method 5.8% 4.3% 5.6%
Table 3 Detection error
4 CONCLUSION
This paper presents a real-time onboard cloud detection method on basis of DSP. The proposed method combines traditional threshold method with the SVM method. The results show that the proposed method of this paper can detect cloud more accurately and more quickly. Moreover, in most case, the cloud region and non-cloud region can be classified efficiently and accurately using the proposed method. But the false detection and missed detection are still existed. The false detection is mainly caused by snow, which is because that the spectral feature and the texture feature of snow are strikingly similar to those of cloud. The missed cloud detection mainly results from cloud edges. The cloud edges change sharply and have more details which were more like the feature of the non-cloud region.
ACKNOWLEDGEMENTS
This paper is financially supported by the National Natural Science of China under Grant numbers 41431179 and 41162011, Guangxi Science & Technology Development Program under the Contract number GuiKeHe 14123001-4, and Guangxi Key Laboratory of Spatial Information and Geomatics Program (Contract No. 130511401, 130511412, 140452401, 140452409), the “Ba Gui Scholars” program of the provincial government of Guangxi.
REFERENCE
McGill, M., 2008. Cloud detection with MODIS. Part II: Validation J. Atmosp. Ocean. Technol., 25(7), pp. 1073-1086.
Amato U., Antoniadis, A., Cuomo, V., Cutillo, L., Franzese, M. and Murino, L., 2008. Statistical cloud detection from SEVIRI multispectral images. Remote Sensing of environment, 112(3), pp.750-766.
Barnes, B.B., and Hu, C., 2013. A Hybrid Cloud Detection Algorithm to Improve MODIS Sea Surface Temperature Data Quality and Coverage Over the Eastern Gulf of Mexico, IEEE Transactions on Geoscience and Remote Sensing, 51(6), pp.3273-3285.
Cortes C. and Vapnik, V., 1995. Support-vector networks, Machine Learning, 20(3), pp. 273–297.
Cristianini N. and Shawe-Taylor, J., 2000. An Introduction to Support Vector Machines. Cambridge, UK: Cambridge University Press.
Di Girolamo, L. and Wilson, M.J., 2003. A first look at band-differenced angular signatures for cloud detection from MISR, IEEE Transactions on Geoscience and Remote Sensing, 41(7), pp.1730-1734.
Doggett T., Greeley, R., Chein, S., Castano, R. and Cichy, B., 2006. Autonomous detection of cryospheric change with hyperion on-board earth observing-1, Remote Sensing of Environment, 101, pp. 447–462.
Foody G.M. and Mathur, A., 2004. Toward intelligent training of supervised image classifications: Directing training data acquisition for SVMclassification, Remote Sens. Environ., 93(12), pp. 107–117.
Jedlovec, G.J., Haines, S.L. and LaFontaine, F.J., 2008. Spatial and Temporal Varying Thresholds for Cloud Detection in GOES Imagery, IEEE Transactions on Geoscience and Remote Sensing, 46(6), pp.1705-1717.
Latry, Ch., Panem, C.and Dejean, P., 2007. Cloud detection with SVM technique, Geoscience and Remote Sensing Symposium 2007, pp.448-451.
Le Hégarat-Mascle, S. and André, C., 2009. Use of Markov random fields for automatic cloud/shadow detection on high resolution optical images, ISPRS J. Photogramm. Remote Sens., 64(4), pp. 351–366.
Mathur A. and Foody, G. M., 2008. Crop classification by support vector machine with intelligently selected training data for an operational application, Int. J. Remote Sens., 29(8), pp. 2227–2240.
McLachlan, G. J., Kim-Anh Do and Ambroise, C., 2004. Analyzing microarray gene expression data. Wiley-Interscience.
Minnis, P., Trepte, Q.Z., Szedung Sun-Mack, Chen,Y., Doelling, D.R.,Young, D.F., Spangenberg, D.A., Miller, W.F., Wielicki, B.A., Brown, R.R., Gibson, S.C. and Geier, E.B., 2008. Cloud Detection in Nonpolar Regions for CERES Using TRMM VIRS and Terra and Aqua MODIS Data, IEEE Transactions on Geoscience and Remote Sensing, 46(11), pp.3857-3884.
Pratt W., 1991. Digital Image Processing, Wiley, New York, NY, USA, pp. 307-446.
Ricciardelli E, Romano, F. and Cuomo, V., 2008. Physical and statistical approaches for cloud identification using Meteosat Second Generation-Spinning Enhanced Visible and Infrared Imager Data. Remote Sensing of Environment; 112(6), pp.274-280.