CHAPTER III RESEARCH METHOD
This chapter explainedtime and place of the study, research of the study, approach, population and sample, data collection procedure, instrument of the study, and data analysis procedure.
A. Time and Place of the Study
The study was conducted at SMA NU Palangka Raya which is located on the RTA.Milono Street. The writer found the complete data about two months, it was August – September 2015 and the students at the SMA NU Palangka Raya.
B. Research Type of the Study
The type of this study was pre experimental study by utilizing One-group Pre-Test/Post-Test Design. The one-One-group pretest–posttest design usually involves three steps: (1) administering a pretest measuring the dependent variable; (2) applying the experimental treatment X to the subjects; and (3) administering a
posttest, again measuring the dependent variable.
45
The writer used pre-experimental design because the writer was not the real teacher of that school, so that the writer did not have the authority to arrange the students into new groups such as the true experiment study. In this experiment, the writer taught the students directly. Firstly, the writer gave pretest
45
Donald Ary, et, all., Introduction to Research in Education, Canada: Wadsworth, Cengage Learning 8th Edition, p. 304
to students in order to measure the students’ ability in writing recount text before using guided - questions strategy. The writer taught the students for four times by using guided - questions strategy. And then, there is Posttest in order to measure the students’ ability after treatment.
C. Approach of the Study
In this study, the writer used quantitative approach. It was because the writer measured the students’ writing ability by tests; pretest and posttest. Creswell stated that a quantitative study, consistent with the quantitative paradigm, is an inquiry into a social or human problems based on testing a theory composed of variables, measure with numbers, and analyze with statistical procedures, in order to determine whether predictive generalizations of the theory hold true.46
D. Population and Sample of The Study 1. Population
Population is all cases, situation, or individuals who share one or more characteristics.47 The population of this research was all the students of the tenth grade students of SMA NU Palangka Raya. The number of population was about 9 students. It was classify one class.
46
John W. Creswell, Qualitative and Quantitative Approach, 1994, California: SAGE Publications, Inc, 1994, p. 2.
47
Table 3.1 The Number of the Tenth Grade Students of SMA NU Palangka Raya No Classes The Number of
Students
1 X 9
2. Sample
Sample is a subset of individuals or case from within a population.48 To determine the students as experiment group the writer used one class as sample. So that the writer used class X as the sample consists of 9 students.
E. Data Collection Procedure
The writer collected the data by implementing some procedures. There were some steps in the procedures as follow :
1. Collecting
a. The writer gave the pre-test to the pre experiment group b. The writer scored students worksheet
c. The writer gave treatment by using guided - questions strategy in teaching recount text.
d. The writer gave the post-test.
e. The writer resulted of score to the data.
48
2. Editing codes. Y and Z were the codes for pre-test and post-test.
4. Scoring
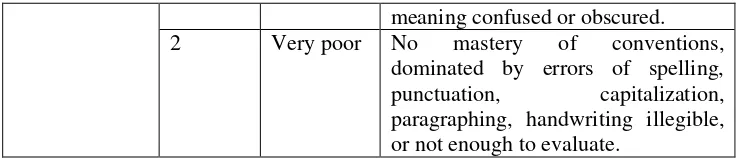
After giving codes to each result of the test, the writer gave the score for the students’ writing with the marking system: it can be seen in the following table:49
Component Score Level Criteria Content 30-27 Excellent
to very
Some knowledge of subject, adequate range, limited development of thesis, mostly relevant to the topic, but lacks detail.
21-17 Fair to poor
Limited knowledge of subject, little substance, inadequate development to the topic.
16-13 Very poor Does not show knowledge of subject, non-substantive, not pertinent, or not enough to evaluate.
Organization 20-18 Excellent to very good
Fluent expression, ideas clearly stated/supported, succinct well organized, logical sequencing, cohesive.
17-14 Good to Somewhat choppy, loosely organized
49
average but main ideas stand out, limited support, logical but incomplete sequencing.
13-10 Fair to poor
Non fluent, ideas confused or disconnected, lacks logical sequencing a development.
Vocabulary 20-18 Excellent to very good
Sophisticated range, effective errors or word idiom form, choice, meaning confused or obscured.
17-14 Good to average
Adequate range, occasional errors or words idiom forms, choice, usage, 9-7 Very poor Essentially translation, little
knowledge of English vocabulary, idioms, words form, or not enough to evaluate
Language use 25-22 Excellent to very good
Effective complex construction, few errors of agreement, tense, number, words order function, articles, pronoun, preposition,
21-18 Good to average
Effective but simple construction, minor problems in complex construction, several errors and agreement, tense, number, word order/function, article pronoun, preposition, but meaning seldom abscured.
17-11 Fair to poor
Major problem in simple/complex construction, frequent error of negation, agreement, words order function, article, pronoun, preposition, or fragments, meaning confused or obscured.
10-5 Very poor Virtually no mastery of sentence construction rules, dominated by errors, does not communicate, or not enough to evaluate.
Mechanics 5 Excellent to very good
Demonstrate mastery of convensions, few errors of spelling, punctuation, capitalization, paragraphing.
4 Good to average
Occasional errors of spelling, capitalization, paragraphing and not obscured.
3 Fair to poor
meaning confused or obscured. 2 Very poor No mastery of conventions,
dominated by errors of spelling, punctuation, capitalization, paragraphing, handwriting illegible, or not enough to evaluate.
5. Tabulating
The last thing to process the data was to insert the data to a certain table and arrange the numbering then calculated them.
F. Instrument of The Study
Instruments of the study are very needed in research. It is because the instruments are tools to get the data of the study, in which the data are the important things to help the writer in answering the problem of the study and also to prove the hypothesis. The data also needed to find the aim of the study.
1. Test
posttest scores which would be given after the treatment. A posttest as the last test would be given to get the quantitative data about their writing ability after the writer teach recount text with guided - questions strategy. The writer used essay test in this study.
2. Documentation
In this study, documentation was the second instrumentation to find out the related documents to the study. Some documents that were needed:
1. The number of classes of the tenth grade students of SMA NU PalangkaRaya.
2. The number of the tenth grade students of SMA NU Palangka Raya.
3. Syllabus of English education (writing material) for the tenth grade senior high school.
G. InstrumentValidity 1. Content Validity
Content validity demands the appropriateness between the ability to be measure and the test being used to measure it.50 The writer used essay test
50
for students. The students in this study wrote recount text from essay test instruction, so the test really measured the writing ability of the students.
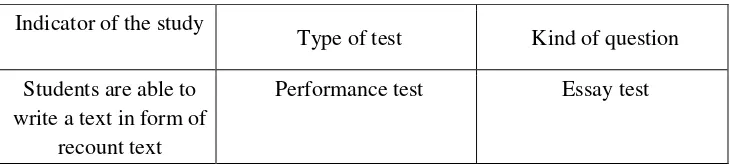
Table 3.2
Signification of content validity Indicator of the study
Type of test Kind of question
Students are able to write a text in form of
recount text
Performance test Essay test
2. Face validity
Face validity of test is when the test is indeed testing what it claims to test; the test samples the actual content of what the learner has achieved or expects to achieve.51 Therefore, the appearance of the test in the study as follows; the test items used English, consisted of recount discourse, and the test was suitable with the syllabus of English writing for the tenth grade students of SMA NU Palangka Raya.
For face validity of the test items as follow:
1) The test used written test in essay test instruction.
2) The evaluation by essay test based on scoring system.
3) Kind of the essay test was writing recount text.
4) The Language of items used English
51
5) The essay test was suitable with syllabus of English writing for tenth grade students at SMA NU Palangka Raya.
3. Construct Validity
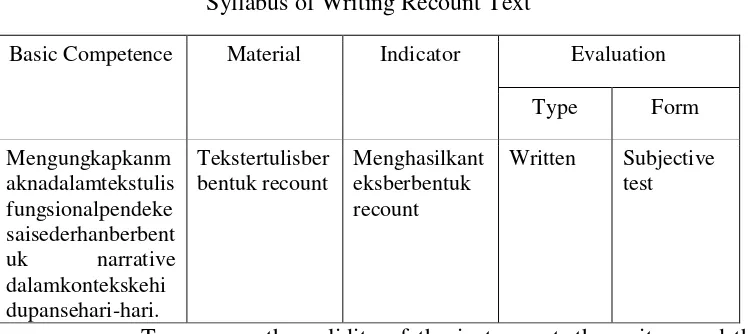
This type of validity assumes the existence of certain learning theories or constructs underlying the acquisition of abilities and skills.52 Writing skill, in the study, the test items of writing is the form of written test
Table 3.3
Syllabus of Writing Recount Text
Basic Competence Material Indicator Evaluation
Type Form formulation of Product Moment by Pearson as follows:53
rxy
= 𝐍 𝐗𝐘−( 𝐗) ( 𝐘) √{𝐍𝚺𝐗²−(𝚺𝐗)²}{𝐍𝚺𝐘²−(𝚺𝐘)²}Where:
rxy : Total coefficient of correlation
∑X : Total value of score X ∑Y : Total value of score Y
52
J.B Heaton, language testing, p 154
53
∑XY : Multiplication result between score X and Y N : Number of students
To know the level of validity of instrument, the value was interpreted based on the qualification of validity as follows: (see appendix 4)
t-
test>t-
table = Validt-
test>t-
table = Not ValidTable 3.4 Criteria of Validity
Validity Interpretation
0.800-1.000 Very High Validity
0.600-0.799 High Validity
0.400-0.599 Fair Validity
0.200-0.399 Poor Validity
0.000-0.199 Very Poor Validity
H. InstrumentReliability
Reliability is necessary characteristic of any good test for it to be valid at all. A test must be reliable as a measuring instrument. It is the degree of consistency with which it measure wherever it is measuring.54In rather reliability, there were inter-rater reliability and intra-rater reliability. Inter-rater reliability is the consistency of the judgment of several Inter-raters on how they see a phenomenon or interpreted the responses of the subject.55 It indicates accuracy in scoring composition of two different raters. Meanwhile,
54
DonalAry, Lucy Cheser Jacobs, ChirSorense, AsgharRazavieh, Introduction to Research in Education, (Eighth Edition), United States: WardswothCengage Learning, Learning , 2010, p. 236.
55
intra-rater reliability referred to the consistency of the rater in scoring the same paper at two different points of time. It points out an individual accuracy in scoring a particular composition.56
In this study, the writer applied inter-rater reliability; two raters would employ to score the students’ writing. The two raters were the writer self and one of English teacher of SMA NU Palangka Raya.
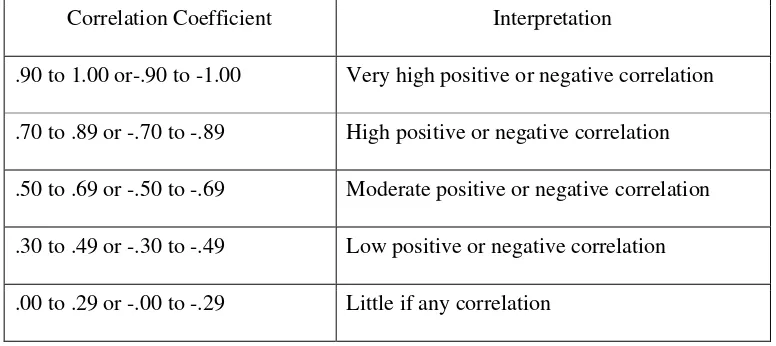
The coefficient correlation and the interpretation of inter rater reliability according to Djiwandono as shown in table 3.5:
Table 3.5
Inter-rater coefficients Correlation and Interpretation. Correlation Coefficient Interpretation
.90 to 1.00 or-.90 to -1.00 Very high positive or negative correlation
.70 to .89 or -.70 to -.89 High positive or negative correlation
.50 to .69 or -.50 to -.69 Moderate positive or negative correlation
.30 to .49 or -.30 to -.49 Low positive or negative correlation
.00 to .29 or -.00 to -.29 Little if any correlation
After doing inter-rater reliability, the writer examined the reliability of the items by using Alfa Cronbach Technique.(see appendix 5)
56
I. Data Analysis Procedure
According to Bogdan and Sugiyono stated that “data analysis is the process of systematically searching and arranging the interview transcript, field notes, and other materials that is accumulated to increase our own understanding and enable you to present what you have discover to others”.57
Based on the experiment research, to get the answer of the problem of the study on the usage of guided - questions strategy in teaching recount text to expand students’ writing skill at the tenth grade students of SMA NU Palangka
Raya. The writer used statistical ttest to answer the problem of the study. In order
to analyze the data, the writer did some way procedures:
1. Giving tests (pre-test and post-test) to the students of the tenth graders of SMA NU Palangka Raya.
2. Collecting the score of the students work sheet result. Name of students Experimental Class
Y Z
SUM (∑)
Table of Pre-test and Post-test scores of Experiment Class Where:
Y : Pre-test of Experimental Class. Z : Post-test of Experimental Class
57
3. Tabulating the data into the distribution of frequency of score table, then find out the mean of student's score, standard deviation, and standard error of variable X by using the formulas bellow:
a. Mean of experimental Group
𝑴𝑿 = 𝑵𝑿
Where:
Mx : Mean score of experimental group
∑x : The score sum of experimental group N : The number of respondents of each class
b. Measuring the sum of standard deviation. The formulas are as follows:58
𝑆𝐷
=
𝑖
𝐹𝑋′
²
𝑁 −
(
𝐹𝑋′
)²
(
𝑁
)
Where:
SD : Standar deviation i : interval of class
∑Fx'2: The square deviation sum of experimental group N: The total number of respondents
c. Measuring the standard error59 SEM = 𝑆𝐷
√𝑁−1
Where:
58
Ibid, p. 61
59
SEM : Standard error of the mean
SD : Standard Deviation N : Number of Cases 1 :Bilangankonstan
4. The writer used normality test. It was used to know the normality of the data that was needed to be analyzed whether both groups has normal distribution or not.
5. The writer used homogeneity test. It was used to know relatively same variant or not.
6. Then, the writer applied all of them into t-test formula. T-test formula was used to know whether there is any effect of guided - questions strategy in writing or not. The formula is as follow:60
t
o =𝑥−µ
𝑆𝐷/√𝑛
Where:
x: Mean of posttest µ : KKM
SD : The Standar Deviation
N : Number of case By the criteria:
If ttest≥ttable, Ha is accepted and Ho is rejected.
If ttest<ttable, Ha is rejected and Ho is accepted
7.The last, the writer calculated degrees of freedom (d.f) by using formula:
60
df = N-1
After getting t-counted, then the writer consulted it to t- table of a certain significant level. If the t-counted is higher than t-table, it means that there will be positive effect of guided - questions strategy as media in teaching writing. So the writer’s hypothesis is accepted. In Contrary, the counted is lower than t-table, the writer’s hypothesis is not accepted.