•UsemonitoringandanalytictoolssuchasFirebug,YSlow,andWebPagetest •TrackwebperformancewithWebPagetest,PHP,andR
•CreateaJavaScriptlibrarytobenchmarkruntimeperformance •UseJavaScripttoimproveaspectsofwebperformance •Optimizeruntimeperformanceinthebrowser
matter material after the index. Please use the Bookmarks
and Contents at a Glance links to access them.
Contents at a Glance
About the Author ...ix
About the Technical Reviewer ...x
Acknowledgments ...xi
Chapter 1: What is Performance ...1
Chapter 2: Tools and Technology to Measure and Impact Performance ...13
Chapter 3: WPTRunner—Automated Performance Monitoring and Visualization... ...43
Chapter 4: perfLogger—JavaScript Benchmarking and Logging ...65
Chapter 5: Looking Forward, a Standard for Performance ...83
Chapter 6: Web Performance Optimizations...109
Chapter 7: Runtime Performance ...139
Chapter 8: Balancing Performance with Software Engineering Best Practices... ...175
■ ■ ■
What is Performance
Performance refers to the speed at which an application functions. It is a multifaceted aspect of quality. When we’re talking about web applications, the time it takes your application to be presented to your users is what we will call web performance. The speed at which your application responds to your users’
interactions is what we’ll call runtime performance. These are the two facets of performance that we will be looking at.
Performance in the context of web (and especially mobile web) development is a relatively new subject, but it is absolutely overdue for the attention it has been getting.
In this book we will explore how to quantify and optimize JavaScript performance, in the context of both web performance and runtime performance. This is vitally important because JavaScript is potentially the largest area for improvement when trying to address the total performance of your site. Steve Souders, architect of both YSlow and PageSpeed, and pioneer in the world of web performance, has demonstrated this point in an experiment where he showed an average performance improvement of 31% when removing JavaScript from a sample of web sites.1 We can completely remove any JavaScript from our site as Steve did in his experiment, or we can refine how we write JavaScript and learn to measure the efficiencies in what we write.
It’s not realistic to remove JavaScript from our front-end, so let’s look at making our JavaScript more efficient. Arguably even more important, let’s look at how we can create automated tools to track these efficiencies and visualize them for reporting and analysis.
Web Performance
Sitting with your laptop or holding your device, you open a web browser, type in a URL and hit Enter, and wait for the page to be delivered to and rendered by your browser. The span of time that you are waiting for the page to be usable depends on web performance. For our purposes we will define web performance as an overall indicator of the time it takes for a page to be delivered and made available to your end user.
There are many things that influence web performance, network latency being the first. How fast is your network? How many round trips and server responses are needed to serve up your content?
To better understand network latency, let’s first look at the steps in an HTTP transaction (Figure 1.1). When it requests a URL, whether the URL for a web page or a URL for each asset on a web page, the browser spins up a thread to handle the request and initiates a DNS lookup at the remote DNS server. This allows the browser to get the IP address for the URL entered.
Browser
DNS Lookup
DNS Reply
SYN
SYN-ACK
ACK
HTTP GET
FIN
FIN-ACK
ACK HTTP Response 2XX | 3XX | 4XX | 5XX
DNS Server Server
■
Note
Threads
are sequential units of controlled execution for applications. Whenever an application performs
any operation, it uses a thread. Some applications are multithreaded, which means that they can do multiple things
at once. Generally browsers use at least one thread per tab. That means that the steps that the thread executes—
the steps that we outline as part of the connection, download and rendering process—are handled sequentially.
Next the browser negotiates a TCP three-way handshake with the remote web server to set up a TCP/ IP connection. This handshake consists of a Synchronize, Synchronize-Acknowledge, and Acknowledge message to be passed between the browser and the remote server. This handshake allows the client to attempt communication, the server to acknowledge and accept the attempt, and the client to acknowledge that the attempt has been accepted.
This handshake is much like the military voice procedure for two way radio communication. Picture two parties on either end of a two way radio—how do they know when the other party has finished their message, how do they know not to talk over each other, and how do they know that the one side
understood the message from the other? These have been standardized in voice procedure, where certain key phrases have nuanced meaning; for example, Over means that one party has finished speaking and is waiting for a response, and Roger indicates that the message has been understood.
The TCP handshake, like all communication protocols, is just a standardized way to define communication between multiple parties.
the tCp/ip model
TCP stands for Transmission Control Protocol. It is the protocol that is used in the TCP/IP model that defines
how communications between a client and a server are handled, specifically breaking the data into
segments, and handling the handshake that we described earlier (Figure 1.1).
The TCP/IP model is a four-layer model that represents the relationship between the different protocols that
define how data is shared across the Internet. The specification for the TCP/IP model is maintained by the
Internet Engineering Task Force, in two RFC (Request For Comment) documents, found here:
http://
tools.ietf.org/html/rfc1122
and
http://tools.ietf.org/html/rfc1123
.
The four layers in the TCP/IP model are, in order from furthest to closest to the end user, the Network Access
layer, the Internet layer, the Transport layer, and the Application layer.
The Network Access layer controls the communication between the hardware in the network.
The Internet layer handles network addressing and routing, getting IP and MAC addresses.
The Transport layer is where our TCP (or UDP) communication takes place.
If we compare the TCP/IP model to our sequence diagram, we see how the browser must traverse up and
down the model to serve up our page, as shown here.
Once the TCP/IP connection has been established, the browser sends an HTTP GET request over the connection to the remote server. The remote server finds the resource and returns it in an HTTP Response, the status of which is 200 to indicate a good response. If the server cannot find the resource or generates an error when trying to interpret it, or if the request is redirected, the status of the HTTP Response will reflect these as well. The full list of status codes can be found at http://www.w3.org/Protocols/rfc2616/ rfc2616-sec10.html but the most common ones are these:
• 200 indicates a successful response from the server.
• 404 means that the server could not find the resource requested.
• 500 means that there was an error when trying to fulfill the request.
It is here that the web server serves up the asset and the client begins downloading it. It is here that the total payload of your page—which includes file sizes of all images, CSS, and JavaScript—comes into play.
The total size of the page is important, not just because of the time it takes to download, but because the maximum size of an IP packet is 65535 octets for IPv4 and IPv6. If you take your total page size converted to bytes and divide it by the maximum packet size, you will get the number of server responses needed to serve up your total payload.
Another contributor to network latency is the number of HTTP requests that your page needs to make to load all of the objects on the page. Every asset that is included on the page—each image and external JavaScript and CSS file—requires a round trip to the server. Each spins up a new thread and a new instance of the flow shown in Figure 1-1, which again includes a cost for DNS lookup, TCP connection, and HTTP request and response, plus the cost in time transmitting the sheer file size of each asset.
See Figure 1-2 for an idea of how this simple concept can exponentially grow and cause performance hits in scale.
Waterfall charts are a tool to demonstrate the time it takes to request a page and all of the assets included in the page. They show the HTTP transaction for each asset needed to construct a page, including the size of each asset, how long each one took to download, and the sequence in which they were
downloaded. At a high level, each bar in the waterfall chart is a resource that we are downloading. The length of a bar corresponds to how long an item takes to connect to and download. The chart runs on a sequential timeline, so that the top bar is the first item that gets downloaded and the last bar is the final item, and the far left of the timeline is when the connections begin and the far right is when they end. We will talk much more about waterfall charts in Chapter 2, when we discuss tools for measuring and impacting performance.
Parsing and Rendering
Another influencer of web performance, outside of network concerns, is browser parsing and rendering. Browser parsing and rendering is influenced by a number of things. To better understand this concept let’s first look at an overview of the browser’s architecture as it pertains to parsing and rendering web pages (Figure 1-3).
Most modern browsers have the following architecture: code to handle the UI, including the location bar and the history buttons, a Rendering Engine for parsing and drawing all of the objects in the page, a JavaScript Engine for interpreting the JavaScript, and a network layer to handle the HTTP requests.
Since the browser reads content from the top down, where you place your assets impacts the perceived speed of your site. For example, if you put your JavaScript tags before HTML content, the browser will launch the JavaScript interpreter and parse the JavaScript before it finishes rendering the remainder of the HTML content, which can delay making the page usable for the end user.
Browsers are your bread and butter as a web developer, and so you should be more than familiar with each of the rendering engines and JavaScript engines. It is more than worth your time to download the
Ul Layer
Rendering Engine
Network Layer
JavaScript Interpreter
ones that are open-source (see the next section for URLs where available) and read through some of the source code. If you are really adventurous you can put your own instrumentation or logging into the source code and automate your own performance tests running in your forked engine.
Rendering Engines
Let’s take a look at some of the more widely used rendering engines out in the wild. It’s important to think of the rendering engine as more than the browser. By modularizing the architecture of the browsers, the browser makers have been able to federate the components. More tools than just browsers render HTML, including email clients and web components in other applications. By having a distributable rendering engine, browser makers can reuse their own engines or license them for use by other companies. This also usually allows developers to know what to expect from a software package just by knowing which
rendering engine it is using.
Firefox and all of its derivatives and cousins (like Thunderbird, Mozilla’s email client) use Gecko, available at https://developer.mozilla.org/en/Gecko. Gecko was first developed at Netscape, before the Mozilla Project spun out as its own entity, as the successor to the original Netscape rendering engine, back in 1997.
Webkit is what Chrome and Safari use, and is your target for most mobile web development since it is used as the layout or rendering engine for Android devices as well as mobile Safari for iOS devices and the Silk browser on Kindle Fires. Webkit is available at http://www.webkit.org/. WebKit was started in 2001 at Apple as a fork of a previous rending engine, KHTML from KDE. WebKit was open sourced publicly in 2005.
Opera on desktop, mobile, and even all the Nintendo consoles (NDS, Wii) use Presto, which was introduced in 2003 with Opera 7. More information about Presto can be found at http://dev.opera.com/ articles/view/presto-2-1-web-standards-supported-by/.
And finally, Internet Explorer, along with other Microsoft products like Outlook, uses MSHTML, codenamed Trident. Microsoft first introduced Trident with Internet Explorer 4 in 1997 and has been iterating on the engine since. Documentation for Trident can be found here: http://msdn.microsoft.com/ en-us/library/bb508515.
JavaScript Engines
Next let’s take a look at the JavaScript engines used by the most popular browsers. Modularizing the JavaScript interpreter makes the same kind of sense as modularizing the rendering engine, or
modularizing any code for that matter. The interpreter can be shared with other properties, or embedded in other tools. The open source interpreters can even be used in your own projects, perhaps to build your own static code analysis tools, or even just to build in JavaScript support to allow your users to script certain functionality in your applications.
SpiderMonkey is the JavaScript engine made by Mozilla that is used in Firefox. Brendan Eich, creator of JavaScript, created SpiderMonkey in 1996 and it has been the JavaScript interpreter for Netscape and then Firefox ever since. The documentation for SpiderMonkey is available here: https://developer. mozilla.org/en/SpiderMonkey. Mozilla has provided documentation showing how to embed
SpiderMonkey into our own applications here: https://developer.mozilla.org/en/How_to_embed_the_ JavaScript_engine.
Opera uses Carakan, which was introduced in 2010. More information about Carakan can be found here: http://my.opera.com/dragonfly/blog/index.dml/tag/Carakan.
Google’s open source JavaScript Engine used by Chrome is available here: http://code.google.com/p/ v8/. Documentation for it is available here: https://developers.google.com/v8/intro.
And finally, Internet Explorer uses Chakra as their JScript engine. Remember that, as Douglas
Crockford details at http://www.yuiblog.com/blog/2007/01/24/video-crockford-tjpl/, JScript started life as Microsoft’s own reverse-engineered version of JavaScript. Microsoft has since gone on to give JScript its own voice in the overall ecosystem. It is a legitimate implementation of the ECMAScript spec, and Chakra even supports some aspects of the spec that most other JavaScript engines don’t, specifically conditional compilation (see the accompanying discussion of conditional compilation).
All of these are nuances to consider when talking about and optimizing the overall web performance of your site.
The JavaScript team at Mozilla also maintains a site, http://arewefastyet.com/, that compares benchmarking times for V8 and SpiderMonkey, comparing the results of both engines running the benchmarking test suites of each engine.
Conditional Compilation
Conditional compilation is a feature of some languages that traditionally allows the language compiler to
produce different executable code based on conditions specified at compile time. This is somewhat of a
misnomer for JavaScript because, of course, JavaScript is interpreted, not compiled (it doesn’t run at the
kernel level but in the browser), but the idea translates.
Conditional compilation allows for writing JavaScript that will only be interpreted if specific conditions are
met. By default conditional compilation is turned off for JScript; we need to provide an interpreter-level flag
to turn it on:
@cc_on
. If we are going to write conditionally compiled JavaScript, we should wrap it in
comments so that our code doesn’t break in other JavaScript interpreters that don’t support conditional
compilation.
An example of JScript conditional compilation is
<script>
var useAX = false; //use ActiveX controls default to false /*@cc_on
@if (@_win32) useAX = true; @end
*/
Runtime Performance
Runtime is the duration of time that your application is executing, or running. Runtime performance speaks to how quickly your application responds to user input while it is running—for example, while saving preferences, or when accessing elements in the DOM.
Runtime performance is influenced by any number of things—from the efficiency of the algorithms employed for specific functionality, to optimizations or shortcomings of the interpreter or browser rendering engine, to effective memory management and CPU usage, to design choices between synchronous or asynchronous operations.
While runtime performance is thus a subjective perception of the overall peppiness of your application, you can build in instrumentation that will allow you to track the shape and trend of your users’ overall experiences and analyze the outliers. You can also conduct multivariate testing experiments to see what approach yields the greatest performance gain at scale and with the browsers in use with your specific user base.
We will explore these ideas in Chapter 4.
Why does performance matter?
The first reason should be obvious—faster web sites mean a better overall user experience for your end user. A better experience in theory should equate to happier users.
A faster experience also means that users can access your features faster, hopefully before they abandon the session. Session or site abandonment happens for any number of reasons: pages taking too long to load, users losing interest, browsers crashing, or any other of a near-infinite number of reasons.
Figuring out your own site abandonment rate is easy. Just take the total number of users who do whatever action you want of them—purchase an item, register a new account, upsell to a service, view pages in other sections, click a given button on the homepage, whatever the high-level objective is that you have for your site. You take that number and divide it by the total number of visits. Subtract that from one and multiply that by 100 to give you the percentage of traffic that abandoned your site before fulfilling your objective:
[abandonment rate] = (1 - ([number of fulfilled objectives] \ [total number of visits])) * 100 As an example, say we have a web form, maybe a customer registration page. The whole point of that page is to get users to create accounts—once they have an account we can start tailoring things to their own personal preferences, we can target ads to their purchasing habits, and we can make
recommendations to them based on past purchases and viewing history. Whatever the purpose, we want them signed in and that’s how we’ll measure the success of this page. Once a user hits Submit on the form, we go to a PHP script that updates a database, creates a new entry in our User table, and then directs to our homepage.
So we look at the page view metrics for this page and see that we have 100,000 unique page views; in our algorithm this is the total number of visits. If we look at the number of users created in our database, we see that we have 30,000 users. At this point we could apply the algorithm to get our abandonment rate of 70%:
(1 – (30,000 \ 100,000)) * 100 = 70
Improving performance can bring significant benefits to your bottom line by reducing your abandonment rate. There have been a number of prominent case studies where companies have
whitepaper “Why Web Performance Matters,” available at http://www.gomez.com/pdfs/wp_why_web_ performance_matters.pdf, Gomez details how abandonment rates can increase from 8% up to 38% just by introducing latency in page web performance.
You can run your own experiments using the calculation just shown to quantify and extrapolate the return on investment for optimizing site performance.
Instrumentation and Visualization
A big part of this book is about putting tooling in your code and using data visualizations to demonstrate the results. In truth, that is kind of the point of this book. There is no one silver-bullet solution when it comes to performance. The results that one person sees may not be the same results that another gets, because they may have a completely different user base, using a completely different browser.
Maybe your users are locked into using Internet Explorer because of corporate policy, or maybe your audience is made up of early adopters and you have a high population of people using beta releases of browsers, which may have different optimizations in their interpreter or rendering engine, or may even have bugs in their interpreter or rendering engine.
Whatever the case, your results will vary. And they will vary at scale, because of connection speed at different times of the day (users at work versus users at home), because of their method of connecting (cable versus dial up), or any other reason.
But by measuring your own results and visualizing them to see the overall shape of what your data looks like, you’ll be able to fine-tune your own site based on your own real data and trends.
Data visualization as a discipline has blossomed lately. No longer is it relegated solely to the world of mathematics, theory, or cartography. I remember when I first got an inkling of what I could do with data visualization. I was at a conference; it was Velocity in Santa Clara surrounded by my peers. I watched John Rauser give a talk about how he and his team at Amazon debug production issues by analyzing production logs. In his session he talked about sometimes needing to pull out granular data at the individual user level, lay it out in hard copy, and just squint at the data to see the overall shape of it. The shape is what was telling.
That really resonated with me, and since then I’ve explored that in almost every aspect of my life. At work I use data visualizations as management tools for running my organization. Some of the charts that we will be creating in this book are derived from charts that I regularly run for my own team.
In my leisure time I trend my power lifting lift log to see my increases, my resets, and when I plateau (see Figure 1-4). I can see how other things going on in my life affect my lift increases, by cross-referencing dates in the time series. Data analysis is actually a key concept in power lifting, enabling you to manage your increases in weight by measuring your recover time. The sign that you have advanced to a higher level of experience is the time it takes to recover from heavy lifts and the increase in the amount that you are lifting. Beginners advance very quickly because they are lifting far from their potential weight ceiling, but intermediate and advanced lifters push their muscles so hard and work so close to their potential ceiling that it takes them much longer to recover and increase their lift weights.2
At home I also track the humidity level in each room of my house, and I play with the dials. I see what effect running the heat has on the humidity, or caulking the spaces between the floorboards and the walls, or even just having the doors open instead of closed for each room in the house. In such a way I can aspire to naturally have the lowest possible humidity level in my house without running my dehumidifier.
Visualizing my data allows me to see a larger scope of a situation and to clearly see any spikes, outliers, or trends that might not be obvious in the raw data.
The Goal of This Book
There is no shortage of information available online and in other books about current best practices for performance—but performance is a moving target. Because each browser uses a different JavaScript interpreter and rendering engine, your results will differ between browsers and browser versions. Best practices are changing or becoming redefined continually because of changes and optimizations at the interpreter level, differences in system configuration, and network speeds. This pace of change is exacerbated by the quickened release schedule that most browsers have adopted.
But just as important as following best practices is the ability to measure your own performance, so that you can adjust as times change, and so that you can note the subtle nuances in your own code and define your own best practices by your own observations.
My goal with this book is to give you the tools to observe and track over time the performance of your web applications from multiple perspectives, so that you are always aware of all aspects of your
performance. And by tools, I don’t just mean the code that we will develop through the course of the book or the applications available that we will talk about and even automate. I mean the insight to care about these metrics and the mental models to build such instrumentation and visualization into everything that you do.
In many ways, analyzing and optimizing the efficiency of how things operate and perform is part of reaching the next level of excellence. Any journeyman can create something to spec, but a master crafts with excellence and proves that excellence with empirical data.
Technologies Used and Further Reading
As the title suggests, we use JavaScript extensively throughout this book. We also use PHP to automate certain tools, scrape results, and format data. If you aren’t already familiar with PHP, its grammar and lexicon are fairly similar to JavaScript, so you should have no problem switching context between the two languages. Extensive coverage of PHP is outside the scope of this book. If you want more of an
introduction to the language you can check out Beginning PHP and MySQL, by W. Jason Gilmore (Apress, 2005), or if you want a deeper dive into modern PHP, check out Pro PHP Programming, by Peter MacIntyre, Brian Danchilla, and Mladen Gogala (Apress, 2011).
Another language we will use quite a bit is R, which is both a language and the environment that runs the language, and it is used to run statistical calculations and chart data that you import or derive. It is a very interesting language with a very specific use.
R can be daunting at first if you aren’t familiar with its syntax or even things as fundamental as its different data types. Don’t worry; I will explain everything that you need to know to understand the code that we will be writing in R. If you’d like a deeper dive into R—and with most statistical information from the top companies being derived in R,3 and data science being one of the largest growth fields in the coming years,4 why wouldn’t you want to know more about R?—then I recommend R in Action, by Robert Kabicoff (Manning, 2011) and The Art of R Programming: A Tour of Statistical Design, by Norman Matloff (No Starch Press, 2011). Both books approach R as a programming language, as opposed to a mathematical environment, which makes it easier for developers to grasp.
R is amazingly useful to learn, and the more you use it the more you’ll find uses for it. And it’s completely extensible, with a rich plugin architecture and a huge community that builds plugins; it’s rare to find something that R can’t do—at least in the realm of statistics and data visualization.
As I said earlier, there are many resources available for further reading and exploration on the subject of overall web performance optimization. I’ve referenced Steve Souders’ works already; he is a luminary in the field of web performance. His web site is http://www.stevesouders.com/ and he has written two books that go deep into many aspects of web performance. He also runs http://httparchive.org/, whose goal is to be an archive of performance metrics and statistics for the web. All manner of interesting things are to be found here, from the percentage of the web using JQuery to the overall trend of Flash usage over time. This is hugely useful for seeing overall trends as well as doing competitive analysis when developing new features or applications.
The Worldwide Web Consortium (W3C) has a working group dedicated to web performance. This group is working to create specifications and extensions to current standards to expose functionality that will give developers more control in tracking performance natively in a browser. Their charter is located here: http://www.w3.org/2010/webperf/. We will be discussing the progress and specifications that have come from this group in Chapter 5.
Since the point of this book is not just about performance but also about visualizing information, I recommend Nathan Yau’s book Visualize This: The FlowingData Guide to Design, Visualization, and Statistics (Wiley, 2011) as a great primer for data visualization as a craft. Nathan also maintains http:// flowingdata.com/.
Summary
This chapter explored some introductory concepts around performance. We defined two aspects of performance for web applications; web performance is an indication of the time it takes to serve content to our end users, and runtime performance is an indication of how responsive our applications are while our end users are using them.
We briefly explored some of the protocols that hold the web together, like the TCP/IP model, and we traced a request for content from our browser up the TCP/IP model, correlating each action along the way with where in the model it was taking place. We examined the architecture of a TCP round trip and saw the steps involved that our browsers need to take for every piece of content that we request—sometimes in the case of HTTP redirects, multiple times for each of content.
3 http://www.revolutionanalytics.com/what-is-open-source-r/companies-using-r.php and http:// www.nytimes.com/2009/01/07/technology/business-computing/07program.html
We looked at modern browser architecture and saw that browsers are no longer huge black-box monoliths, but instead are modular and some even open source. We talked about the benefits of this modular architecture, noting that as the web becomes ubiquitous, rendering engines are being used for other applications to parse and render markup in email clients or embedded in custom applications, and that we can even embed pieces of browsers in our own applications.
We looked at why performance matters to our business, from customer happiness to looking at abandonment rates.
Finally we started to talk about gathering, analyzing, and visualizing our data. This last point is a recurring theme that we will see throughout this book—measuring and quantifying with empirical data, visualizing that data to show the overall shape of the data. The shape of the data is key; it can reveal trends and patterns that aren’t obvious in the raw data. We can look at a visualization immediately and know generally what it is saying.
■ ■ ■
Tools and Technology to Measure
and Impact Performance
Chapter 1 outlined the concepts of web performance and runtime performance and discussed influencing factors for each. This chapter will look at some of the tools that are available to track performance and to help improve performance.
In future chapters we will explore how to use some of these tools programmatically and combine them to create charting and reporting applications, so getting familiar with them first is essential. Other tools, like Firebug and YSlow, are just essential tools for developing and maintaining performant web sites.
Firebug
2006 was a great year for web development. First of all, Microsoft released Internet Explorer 7, which brought with it native JavaScript support for the XMLHttpRequest object—previously web developers had to branch their code. If a browser’s JavaScript engine supported XHR we would use that; otherwise we would know that we were in an earlier version of IE and instantiate the XHR ActiveX control.
A slew of new frameworks also came out in 2006, including jQuery, MooTools, and YUI, all with the aim of speeding up and simplifying development.
Arguably the greatest milestone of the year was the release of Firebug from Joe Hewitt and the team at Mozilla. Firebug is an in-browser tool that allows web developers to do a number of tasks that were not possible previously. We can now invoke functions or run code via a console command line, alter CSS on the fly, and—the aspect that will interest us most when talking about performance—monitor network assets as they are downloaded to form a page. If you don’t currently have Firebug running on your computer, take the following steps to install it.
How to Install
First let’s install Firebug. You can get the latest version of Firebug here: https://getfirebug.com/downloads/. It was originally released as a Firefox extension, but since then there have been Firebug lite releases for most other browsers. Since Firebug lite doesn’t include the Network Monitoring tab, we’ll use Firefox for this section so that we have all the features of Firebug available to us.
Once you choose the version of Firebug you want, you are taken to the download page (Figure 2-2). Click “Add to Firefox,” and the extension will download and install itself. Restart the browser to complete the installation.
Once Firebug is installed, either click the Firebug icon at the top-right of the browser or at the File menu click Web Developer Firebug to open the Firebug console, as seen in Figure 2-3.
The console is beautiful and wonderfully useful. From here you can view debug messages that you put into your code, view error messages, output objects to see their structure and values, invoke functions in scope on the page, and even run ad hoc JavaScript code. If you weren’t doing web development before Firebug was around, you may not be able to appreciate what a watershed it was to finally be able to do Figure 2-1. The Firebug download screen
Figure 2-2. Click the Add to Firefox button to install the plugin.
those things in a browser. Back then, if you had been used to the Integrated Development Environments (IDEs) for compiled languages, and thus accustomed to memory profiling and being able to debug your code at run time and see the value inside variables and step through your logic, you would have been quite dismayed at the lack of those tools for web development.
But as beautiful and useful as the console is, our concern right now is the Net tab.
How to Use
Network Monitoring in Firebug is a passive tool; you just click on the Net tab—short for Network
Monitoring— (if this is the first time you click on the tab, you’ll need to enable the panel) and navigate to a web page (my tom-barker.com in the following examples). As the page loads, you see all of the network assets begin to load. This display is a waterfall chart (see Figure 2-4).
As introduced in Chapter 1, waterfall charts are a data visualization tool used to demonstrate the effects of sequentially adding and removing elements in a system. They are used in the world of web performance monitoring to demonstrate how the payload and load time of a page are influenced by the components that make up the page.
Each bar in the waterfall chart is a remote piece of content that is part of your page, whether it is an image, a JavaScript file, a SWF, or a web font. The bars are stacked in rows; sequentially top-down to indicate first to last items downloaded. This shows us where in the process each item is downloaded— image A is downloaded before image B, and our external JS files are downloaded last, and so on—and how long each piece of content takes to download. In addition to the bar of the chart, each row also has columns to indicate the URL, the HTTP status, the source domain, the file size, and the remote IP address for the corresponding piece of content. The blue vertical line indicates when the parsing of the document has completed, and the red vertical line indicates when the document has finished loading. The color coding of the vertical bars indicates where in the process of connecting the particular asset is at a given time. The blue section is for DNS lookup, the yellow section is for connecting, the red is for sending, the purple is for waiting for data, and green is for receiving data.
Below the Net tab is a sub-navigation bar that allows you to filter the results in the waterfall chart. You can show all the content, only HTML content, only JavaScript, only Ajax requests (called XHR for XML Http Request object), only images, only Flash content, or only media files. See Figure 2-5 for my results filtered by JavaScript.
Generally you can use Firebug to get an idea of potential issues either during development or for production support. You can proactively monitor the size of your payloads and the general load time, and you can check to make sure that your pages aren’t taking too long to load. What is the overall size of my page, what are the largest assets, and what is taking the longest to load? You can answer questions like that. You can use the filters to focus on areas of concern, like seeing how large our external JavaScript files are. Or even sort the rows by domain name to see content grouped by domain, or sort by HTTP status to quickly pick out any calls that are erroring out.
Because Firebug is a passive tool that merely reports what is happening and doesn’t give
recommendations for improvements, it’s best suited as a development tool or for debugging issues that arise.
YSlow
For a deeper analysis of a page’s web performance you can use YSlow.
Developed by Steve Souders and the team at Yahoo!, YSlow was released in 2007. It was initially released as a Firefox extension, but eventually it was ported to work with most other browsers as well. Like Firebug, YSlow is an in-browser tool, and like Firebug it does not allow much automation, but it is an invaluable tool to assess a page’s web performance and get feedback on steps to take to improve performance.
The steps for improvement are what really distinguish YSlow. It uses a set of criteria to evaluate the performance of a given page and gives feedback that is specific to the needs of your site. Best of all, the criteria are a living thing, and the YSlow team updates them as best practices change and old ones become less relevant.
Let’s try out YSlow.
How to Install
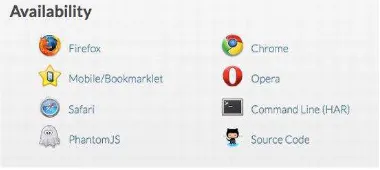
To install YSlow, simply navigate to http://yslow.org/ and choose the platform that you want to run it in. Figure 2-6 shows all the different browsers and platforms that are currently available on the YSlow website.
Since we are already using Firefox with Firebug, let’s continue to use that browser for YSlow. Once you select the Firefox version, install the extension and restart the browser, you are ready to start using YSlow.
How to Use
In Firefox if you open up Firebug you can see that it has a new tab called YSlow. When you click on the tab you are presented with the splash screen shown in Figure 2-7. From this screen you can run the YSlow test on the page that is currently loaded in the browser or choose to always run the test whenever a new page is loaded.
You can also choose what rule set to have the page evaluated against, As I’ve been saying, best practices change, and the different rule sets reflect that. There is the classic set of rules that YSlow initially launched with, an updated rule set (V2) that changed the weighting of certain rules (like making CSS and JavaScript external) and added a number of new rules, and a subset of the rules for small-scale sites and blogs where those rules would be overkill.
After running the test you’ll see the results screen shown in Figure 2-8. The results screen is split into two sections: the rules with their respective ratings on the left and an explanation of the rule on the right. For a detailed breakdown of the rules that YSlow uses, see http://developer.yahoo.com/performance/ rules.html.
There is a sub-navigation bar that further breaks down the results, showing the page components, statistics for the page, and tools you can use for further refinement of performance.
The components section is much like the Network Monitoring tab in Firebug; it lists the individual assets in the page, and each component’s file size, URL, response header, response time, expires header, and etag.
■
Tip
Entity tags, or etags for short, are fingerprints that are generated by a web server and sent over in the HTTP
transaction and stored on the client. They are a caching mechanism, by which a client can request a piece of content
by sending its stored etag in the transaction, and the server can compare to see if the etag sent matches the etag
that it has stored. If they match, the client uses the cached version.
Figure 2-6. Different ways to access YSlow
But beware; etags are unique to the server that generated them. If your content is being served by a cluster, that is an array of servers, rather than a single server. The etags won’t match if a client requests the content from a different server, and you won’t get the benefit of having the content cached.
The statistics section, shown in Figure 2-9, displays two pie charts that show the breakdown of page components. The left chart shows the results with no content cached, and the right shows a subsequent cached view. This is useful to identify the areas that can give the biggest improvement.
By comparing the two charts in Figure 2-9, you can see that JavaScript and images are the two largest pieces of the page before caching. Caching alleviates this for images, but I bet we can get our JavaScript footprint even lower by using a tool that we’ll be talking about soon, Minify.
There are other products similar to YSlow. Google has since made available Page Speed, as a standalone site located here: https://developers.google.com/speed/pagespeed/insights. Page Speed is also available as a browser extension for Chrome or Firefox, available here: https://developers.google. com/speed/pagespeed/insights_extensions.
The differences between YSlow and Page Speed are negligible, and subject to personal preferences in style and presentation.
Figure 2-10 shows the results of a Page Speed test run in the developer tools in Chrome. Figure 2-8. The YSlow results screen
Another similar product is WebPagetest. Because of its rich feature set and potential automation, WebPagetest will be the next product that we talk about at length.
WebPagetest
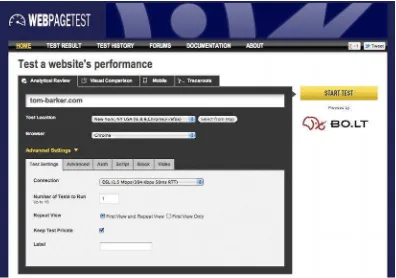
WebPagetest was originally created by AOL and open sourced for public consumption and contribution in 2008. It is available as a public web site, as an open source project, or for download to run a private instance. The code repository is found at http://code.google.com/p/webpagetest/. The public web site is located at http://www.webpagetest.org/ and can be seen in Figure 2-11. The public site is maintained and run by Pat Meenan, through his company WebPagetest LLC.
WebPagetest is a web application that takes a URL and a set of configuration parameters as input and runs performance tests on that URL. The number and range of parameters that we can configure for WebPagetest is extraordinarily robust.
If you want to run tests on web sites that are not publicly available—like a QA or development environment, or if you can only have your test results stored on your own servers because of legal or other reasons, then installing your own private instance of WebPagetest is the way to go.
Otherwise, there is no reason not to use the public instance.
You can choose from a set of locations from around the world where your tests can be run. Each location comes with one or more browsers that can be used for the test at that location. You can also specify the connection speed and the number of tests to run.
In the Advanced panel, you can have the test stop running at document completion. That will tell us when the document.onload event is fired, instead of when all assets on the page are loaded. This is useful because XHR communications that may happen after page load could register as new activity and skew the test results.
You can also have the test ignore SSL certification errors that would otherwise block the test because an interaction with the end user would be needed to either allow the transaction to proceed, view the certificate, or cancel the transaction.
There are a number of other options in the Advanced tab; you can have the test capture the packet trace and network log, providing the granular details of the network transactions involved in the test, or select the “Preserve original User Agent string” option to have the test keep the user agent string of the browser running the test instead of appending a string to identify the visit as a WebPagetest test.
In the Auth tab you can specify credentials to use if the web site uses HTTP authentication for access; just remember to exercise caution. Using real production usernames and passwords for tests staged and stored on public servers is never recommended. It is much more advisable to create test credentials for just this purpose, with constrained permissions.
Sometimes you need to test very specific conditions. Maybe you are running a multivariate test on a certain feature set where you are only serving specific features on specific client configurations, like iPhone specific features. Or you are targeting certain features for users that are grouped by inferred usage habits. You would want to run performance tests on these features that are only triggered by special events.
The Script tab allows you to do just that. You can run more complex tests that involve multiple steps including navigate to multiple URLs, send Click and Key events to the DOM, submit form data, execute ad hoc JavaScript, and update the DOM. You can even alter the HTTP request settings to do things like set specific cookies, set the host IP, or change the user agent.
For example, to make a client appear to be an iPhone, simply add the following script:
setUserAgent
Mozilla/5.0 (iPhone; U; CPU iPhone OS 4_0 like Mac OS X; en-us) AppleWebKit/532.9 (KHTML, like Gecko) Version/4.0.5 Mobile/8A293 Safari/6531.22.7 navigate http://tom-barker.com
The setUserAgent command spoofs the client user agent, and the navigate command points the test to the specified URL. You can read more about the syntax and some of the great things you can do with scripting WebPagetest here: https://sites.google.com/a/webpagetest.org/docs/using-webpagetest/ scripting.
The Block tab allows us to block content coming in our request. This is useful to compare results with and without ads, with or without JavaScript, and with or without images. Instead of using the block tab we could just incorporate a blocking command as part of our script in the Script tab. If we wanted to script out blocking all PNGs in a site it would look like this:
block .png
navigate http://www.tom-barker.com
And finally, the Video tab allows you to capture screen shots of your page as it loads and view them as a video. This is useful for being able to see what a page looks like as it loads, particularly when you have content loaded in asynchronously; you can see at what point in the process the page looks to be usable.
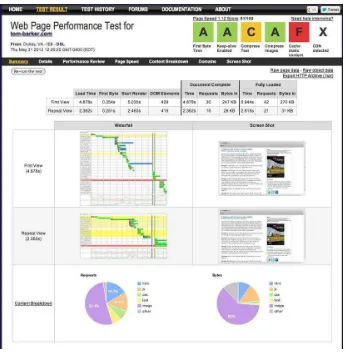
So once you’ve set all of the configuration choices, you can run the test. You can see my results screen in Figure 2-12.
First the Summary screen aggregates all of the vital relevant information for you. At the top right is a summary of the Page Speed results for our page. This is a high-level representation of the same
information that would be presented if we had run a test in Page Speed, but shown in YSlow’s letter grading format.
Sitting in a table above the waterfall charts and screen shots are the page level metrics, numbers for the load time of the full page, how long the first byte took to load, how long until the first piece of content was drawn to the stage, how many DOM elements are on the page, the time it took for the document. onload event to fire, the time it took for all elements on the page to load, and the number of HTTP requests were needed to draw the page.
Make note of these data. They comprise the fundamental information that makes up the quantitative metrics that you will use to chart web performance in the next chapter. They are the true essence of a site’s web performance.
Below this table are two columns. On the left are waterfall charts for the first-time view and the cached repeat view, and on the right are the corresponding screen shots. We’ve already talked at length about how useful waterfall charts are.
Below these are two pie charts. The chart on the left shows the percent of requests by content type. The chart on the right shows the percent of bytes by content type, which is useful for identifying the largest areas that can be optimized. If your JavaScript is only 5% of your overall payload but your images are 70%, you would be better served optimizing images first.
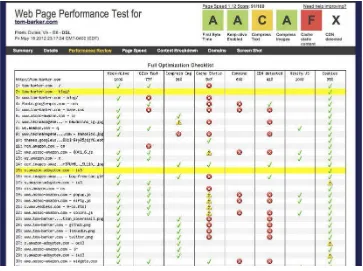
This summary page aggregates at a high level all of the data that you can find in the pages accessed by its sub-navigation bar. Click on the Details, Performance Review, Page Speed, Content Breakdown, Domains, and Screen Shot links in this bar for a deeper dive into each. The Content Breakdown section can be seen in Figure 2-13. This shows how each piece of content fares in the criteria outlined in the
column names (Keep-Alive, Gzip text, Compress Images, Cache Static, Combine, CDN detected, Minify JS, and cookies). The green check marks indicate a success in the criteria, the yellow triangles with the exclamation points indicate a warning, and the red Xs indicate errors.
As you can see, WebPagetest provides a wealth of information about the web performance of a site, but best of all it’s fully programmable. It provides an API that you can call to provide all of this information. Next chapter we’ll explore the API and construct our own application for tracking and reporting out web performance.
Minification
In general, a good amount of energy is spent thinking about optimizing caching. This is a great thing because caching as much content as you can will both create a better user experience for subsequent visits and save on bandwidth and hits to your origin servers.
But when a user comes to a site for the first time there will be no cache. So to ensure that our first-time visits are as streamlined as possible, we need to minify our JavaScript.
Minification is originally based on the idea that the JavaScript interpreter ignores white space, line breaks, and of course comments, so we can save on total file size of our .js files if we remove those unneeded characters.
There are many products that will minify JavaScript. Some of the best ones add twists on that concept.
Minify
First we’ll look at Minify, available at http://code.google.com/p/minify/. Minify proxies the JavaScript file; the script tag on the page points to Minify, which is a PHP file (In the following code we point to just the / min directory because the PHP file is inde.php). The script tag looks like this:
<script type="text/javascript" src="/min/?f=lib/perfLogger.js"></script>
■
Note
A web proxy is code that accepts a URL, reads in and processes the contents of the URL, and makes that
content available, either as-is or decorated with additional functionality or formatting. Usually we use proxies to
make content on one domain available to client-side code on another domain. Minify reads in the content, decorates
it by way of removing extraneous characters, and gzips the response.
Minify reads the JavaScript file in, minifies it and when it responds it sets the accept encoding HTTP header to gzip, deflate. Effectively it has built in HTTP static compression. This is especially useful if your web host doesn’t allow the gzipping of static content (like the web host I use, unfortunately). See the high level architecture of how Minify works in Figure 2-14.
To use Minify, simply download the project from http://code.google.com/p/minify/, place the decompressed /min folder in the root of your web site, and navigate to the Minify control panel, located at /min/builder/.
YUI Compressor
Another minification tool is Yahoo’s YUI Compressor, available here: http://yuilibrary.com/download/ yuicompressor/. YUI Compressor is a jar file and runs from the command line. Because of this it is easily integrated into a build process. It looks like this:
java -jar yuicompressor-[version].jar [options] [file name]
Just like Minify, YUI Compressor strips out all of the unnecessary characters from your JavaScript, including spaces, line breaks, and comments. For a more detailed look at the options available for YUI Compressor, see http://developer.yahoo.com/yui/compressor.
Closure Compiler
Finally we’ll look at Google’s Closure Compiler, available at https://developers.google.com/closure/ compiler/. Closure Compiler can also run from the command line and be built into an automated process, but it takes minification one step further by rewriting as well as minifying the JavaScript. To rewrite our JavaScript, Closure Compiler runs through a number of “scorched-earth” optimizations—it unfurls functions, rewrites variable names, and removes functions that are never called (as far as it can tell). These are considered “scorched-earth” optimizations because they strip everything out, including best practices, in search of the leanest payload possible. And the approach succeeds. We would never write our code in this way, so we keep our originals, and run them through Closure Compiler to “compile” them into the most optimized code possible. We keep this “compiled” code as a separate file, so that we have our originals to update.
To get an idea of how Closure Compiler rewrites our JavaScript, let’s look at some code before and after running Closure Compiler. For the “before” we’re using a small code example that we will be using in Chapter 7.
<script src="/lib/perfLogger.js"></script> <script>
function populateArray(len){ var retArray = new Array(len) for(var i = 0; i < len; i++){ retArray[i] = 1;
} script tag
HTTP Request
gzip encoded
minify javascript File I/O
minify JS file
return retArray }
perfLogger.startTimeLogging("page_render", "timing page render", true, true) /* ***
7.1
Compare timing for loop against for in loop ****/
var stepTest = populateArray(40);
perfLogger.startTimeLogging("for_loop", "timing for loop", true,true, true) for(var x = 0; x < stepTest.length; x++){
}
perfLogger.stopTimeLogging("for_loop");
perfLogger.startTimeLogging("for_in_loop", "timing for in loop", true, true) for(ind in stepTest){
}
perfLogger.stopTimeLogging("for_in_loop")
/** end 7.1 ***/
/* ***
7.1.1
Benchmark for loop and for in loop
****/
function useForLoop(){
var stepTest = populateArray(40);
for(var x = 0; x < stepTest.length; x++){ }
}
function useForInLoop(){
var stepTest = populateArray(40); for(ind in stepTest){
} }
perfLogger.logBenchmark("f", 1, useForLoop, true, true); perfLogger.logBenchmark("fi", 1, useForInLoop, true, true);
perfLogger.stopTimeLogging("page_render") </script>
Closure Compiler takes that code and rewrites it as this:
var b=[];function e(a,c){b[a]={};b[a].id=a;b[a].startTime=new Date;b[a].description=c;b[a].a=!0} function f(a){b[a].d=new Date;b[a].c=b[a].d-b[a].startTime;b[a].url=window.location;b[a]. e=navigator.userAgent;b[a].a&&g(a)}function h(a,c){for(var d=0,j=0;10>j;j++)e(a,"benchmarking "+c),c(),f(a),d+=b[a].c;b[a].a=drawToPage;b[a].b=d/10;b[a].a&&g(a)}
function g(a){var c=document.getElementById("debug"),d="<p><strong>"+b[a].description+"</strong> <br/>",d=b[a].b?d+("average run time: "+b[a].b+"ms<br/>"):d+("run time: "+b[a].
c+"ms<br/>"),d=d+("path: "+b[a].url+"<br/>"),d=d+("useragent: "+b[a].e+"<br/>"),a=d+"</p>";c?c. innerHTML+=a:(c=document.createElement("div"),c.id="debug",c.innerHTML=a,document.body.
appendChild(c))}function i(){for(var a=Array(4E4),c=0;4E4>c;c++)a[c]=1;return a}e("page_ render","timing page render");var k=i();e("for_loop","timing for loop");
for(var l=0;l<k.length;l++);f("for_loop");e("for_in_loop","timing for in loop");for(ind in k);f("for_in_loop");h("f",function(){for(var a=i(),c=0;c<a.length;c++);});h("fi",function(){var a=i();for(ind in a);});f("page_render");
</script>
It’s a significant improvement in all performance metrics, but at the cost of readability, and abstraction from the original code.
Comparison of Results
To determine the best tool to use for a given situation, we’ll take the scientific approach! Let’s implement the tools just discussed and run a multivariate test to see for ourselves which will give us the best results.
First we’ll look at a waterfall chart of a sample of unminified code, as seen in Figure 2-15.
We see that uncompressed and unminified our JavaScript file is 2.1 KB and our total page size is 3.3KB. This sample can be found at http://tom-barker.com/lab/perfLogger_example.html.
Now let’s use Minify and test those results. You can see in the waterfall chart from Figure 2-16 that the JavaScript served from Minify (both minified and gzipped) is only 573 bytes, and the total page size is 1.9 KB.
When I use YUI Compressor and Closure Compiler (with simple options chosen, so the file is only minified, not rewritten) on these same files I get the same result; the JavaScript file is reduced to 1.6 KB for each and the total page size is 2.9 KB. See Figure 2-17.
Remember, the web host that I am using does not support HTTP compression at a global scale, so these results are simply minified, not gzipped. Thus these are not apples-to-apples comparison of the minification algorithm, just a comparison of using the products out of the box.
Figure 2-15. Waterfall chart with uncompressed JavaScript, our baseline
The final comparison is to take the original JavaScript file and run it through Closure Compiler with the Advanced option enabled, so it rewrites the code to be as streamlined as possible. When you do this, make sure you include all JavaScript on the page; that is, not just the remote js file, but also the JavaScript on the page that instantiates the objects. It’s necessary to do this because Closure Compiler will eliminate all code that it does not see executed. So if you have a namespaced object in a remote JS file but code to instantiate it on the HTML page, you need to include the code that instantiates the object in the same file so Closure Compiler can see that it’s used and include it in its output.
The final output from Closure Compiler I will embed on the HTML page instead of linking to it externally. You can see the results in Figure 2-18.
Now that we have some data, let’s visualize it and evaluate.
Analysis and Visualization
We’ll open up R and pour in our minification results, the tool names, the new file size for each tool’s output, and the percent difference for each. We’ll then code some R to create a horizontal bar chart to compare the difference.
Don’t worry, to do this we’ll explore R in depth, and when we do I’ll explain what each line does. For now let’s roll with it and look at the chart you’ll ultimately generate, shown in Figure 2-19.
You can see from Figure 2-19 that Closure Compiler gives the greatest reduction in size right out of the box, but Minify’s combination of minification and gzipping brings it in to a close second. YUI and the simple minification that Closure Compiler provide come in tied a distant third.
Again this comparison is performance out of the box—if we had gzipped our results at third place they would have had comparable results to Minify’s, but Minify supplies gzipping out of the box.
Sheer file size reduction is only one aspect of our overall determination. As you saw in the example earlier, Closure Compiler’s advanced output is far different from the code that originally went into it. If issues were to arise in production they could be difficult to debug, especially if there is third-party code on your pages interacting with your own code.
Does your site have third-party code, like ad code? Are you hosting your own servers or beholden to a web host? How important is production support to you, compared to having the absolute fastest
experience possible? When determining your own preferred tool, it is best to evaluate as we just did and see what works best for your own situation, environment, and business rules. For example, do you have a build environment where you can integrate this tool and have control over configuring your web host? If so, then YUI or Closure Compiler might be your best choices. Are you comfortable with the scorched-earth approach of Closure Compiler’s advanced setting? If so, that gives the greatest performance boost – but good luck trying to debug its output in production.
Figure 2-17. The page compressed with Closure Compiler (simple)
Getting Started with R
R was created in 1993 by Ross Ihaka and Robert Gentleman. It is an extension of and successor to the S language, which was itself a statistical language created in 1976 by John Chambers while at Bell Labs.
R is both an open source environment and the language that runs in that environment, for doing statistical computing. That’s a very general description. I’m not a statistician, nor am I a data analyst. I’m a web developer and I run a department of web developers, if you are reading this, chances are you are a web developer. So what do we, as web developers, do with R?
Generally I use R to suck in data, parse it, process it, and then visualize it for reporting purposes. Figure 2-20 illustrates this workflow. It’s not the only language I use in this workflow, but it is my new favorite. I need other languages usually to access a data source or scrape another application. In the next chapter we use PHP for this, our glue language, but we could use almost any other language—Ruby, shell script, Perl, Python, and so on.
After I use a glue language to collect the data, I write the data out as a comma-separated file, and read it into R. Within R I process the data, splitting it, averaging it, aggregating it, overlaying two or more data sets, and then from within R I chart the data out to tell the story that I see in it.
Once I have a chart created, generally as a PDF so that it maintains its vectors and fonts, from R I import the chart into Adobe Illustrator, or any other such program, where I can clean up things like font consistency and make sure axis labels with long names are visible.
Figure 2-19. Comparison chart generated in R to show percent of file reduction by product
What kinds of data do I run in R? All kinds. In this book we look at visualizing performance data in R, but I also report on my departmental metrics using R, things like defect density, or code coverage for my code repositories.
As a language it is small, self-contained, extensible, and just fun to use. That said, it does have its own philosophy, and quirks, some of which we’ll look at here.
Installing and Running R
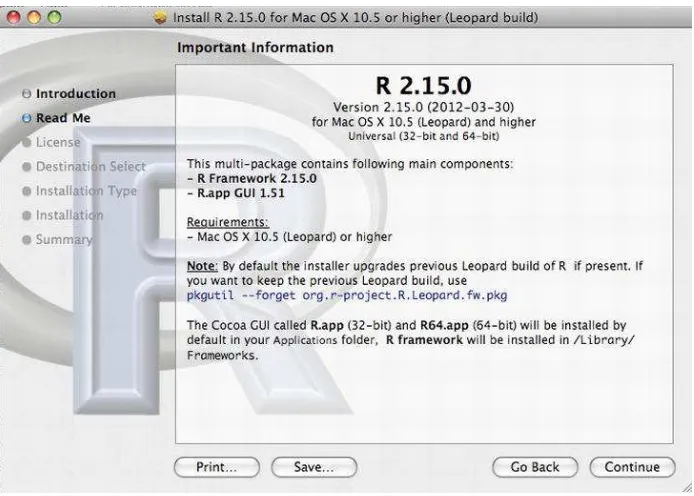
To install R, you first need to download a precompiled R binary, from http://cran.r-project.org/. For Mac and PC, this is a standard installer that walks you through the installation process. The PC installer comes in three flavors: Base is the base install, Contrib comes with compiled third-party packages, and Rtools comes with tools to build your own R packages. For our purposes we’ll stick with the base install. See Figure 2-21 for a screen shot of the R installer.
Instead of a compiled installer, Linux users get the command sequence to install for their particular Linux flavor.
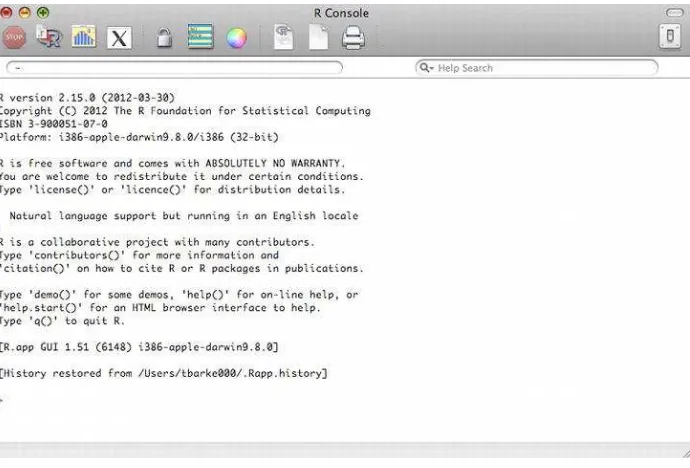
Once R is installed, you can open the R Console, the environment from which we will run the R language. The console can be seen in Figure 2-22.
The console’s toolbar allows us to do tasks like interrupt the execution of running R processes, run stand-alone .R files, adjust the look and feel of the console, create new stand-alone .R files, and so on.
The R Console is a command-line environment for running ad hoc R commands. Usually I use the console to flesh out ideas, and tweak them until they produce what I am looking for, and then I move those functioning expressions to a standalone R file.
You can create external files to hold your R code, generally they have the extension .R.
R is also highly extensible and has a robust community that builds packages that extend what can be done with R. That said, for all of the R code in this book we will not be using any packages, sticking only to the base install of R.
An R Primer
Now that you understand what R is, how do you use R? The first things to note are that at any time you can type ?[keyword] to open the help window for a particular subject. If you aren’t sure that what you are looking for has a topic, simply type ??[keyword] to do a more extensive search. For example, type ?hist to search for help on creating histograms.
> ?hist
starting httpd help server ... done
Also important to note is that R supports single-line comments, but not multiline comments. The hash symbol starts a comment, and the R interpreter ignores everything after the hash symbol to the line break.
Variables and Data Types
To declare a variable you simply assign value to it. The assignment operator is a left-pointing arrow, so creating and declaring variables looks like this:
foo <- bar
R is loosely typed, and it supports all of the scalar data types you would expect: string, numbers, and booleans.
myString <- "This is a string" myNumber <- 23
myBool <- TRUE
It also supports lists, but here is one of the quirks of the language. R has a data type called vector that functions almost like a strictly typed single-dimensional array. It is a list whose items are the same data type, either strings, numbers, or booleans. To declare vectors use the combine function c(), and you add to vectors with the c() function as well. You access elements in vectors using square brackets. Unlike arrays in most languages, vectors are not zero based; the first element is referenced as element [1].
myVector <- c(12,343,564) #declare a vector
myVector <- c(myVector, 545) # appends the number 545 to myVector myVector[3] # returns 564
R also has another list type, called matrix. Matrices are like strictly typed two dimensional arrays. You create a matrix using the matrix function, which accepts five parameters: a vector to use as the content, the number of rows to shape the content into, the number of columns to shape the content into, an optional boolean value to indicate whether the content should be shaped by row or by column (the default is FALSE for by column), and a list that contains vectors for row names and column names:
matrix([content vector], nrow=[number of rows], ncol=[number of columns], byrow=[how to sort], dimnames=[vector of row names, vector of column names])
You access indexes in a matrix with square brackets as well, you we must specify the column and the row in the square brackets.
m <- matrix(c(11,12,13,14,15,16,17,18), nrow=4, ncol=2, dimnames=list(c("row1", "row2", "row3", "row4"), c("col1", "col2")))
>m[1,1] #will return 11 [1]11
> m[4,2] #will return 18 [1] 18
It is easier to think of data frames as collections of vectors. Vectors still have to hold only one data type, but a data frame can hold multiple types of vectors.
You create data frames using the data.frame() function, which accepts a number of vectors as content, and then the following parameters: row.names to specify the vector to use as row identifiers, check.rows to check consistency of row data, and check.names to check for duplicates among other syntactical checks.
userid <- c(1,2,3,4,5,6,7,8,9)
username <- c("user1", "user2", "user3", "user4", "user5", "user6", "user7", "user8", "user9")
admin <- c(FALSE, FALSE, TRUE, FALSE, TRUE, FALSE, FALSE, TRUE, TRUE)
users <- data.frame(username, admin, row.names=userid) > users
Use square brackets to access individual vectors within data frames:
> users[1]
Use the $ notation to isolate columns, and the square bracket for individual indexes of those columns. The $ in R is much like dot notation in most other languages.
> users$admin[3] [1] TRUE
Importing External Data
read.table([path to file], [treat first row as headers],[character to treat as delimiter],[column to make row identifier])
For example, suppose you have the following flat file, which has a breakdown of a bug backlog:
Section,Resolved,UnResolved,Total Regression,71,32,103
Compliance,4,2,6 Development,19,8,27
You would read this in with the following code:
bugData <- read.table("/bugsbyUS.txt", header=TRUE, sep=",", row.names="Section") If you examine the resulting bugData object, you should see the following:
> bugData
Resolved UnResolved Total Regression 71 32 103 Compliance 4 2 6 Development 19 8 27
Loops
R supports both for loops and while loops, and they are structured much as you would expect them to be:
for(n in list){}
while ([condition is true]){}
To loop through the users data frame, you can simply do the following:
for(i in users){ print(users$admin[i]) }
[1] FALSE FALSE TRUE FALSE FALSE [1] TRUE
The same applies for the bug data: > for(x in bugData$UnResolved){ + print(x)
+ } 32 2 8
Functions
Functions in R also work as you would expect; we can pass in arguments, and the function accepts them as parameters and can return data out of the function. Note that all data is passed by value in R.
We construct functions in this way:
functionName <- function([parameters]){