Determining farm effects attributable to the introduction and use of a
dairy management information system in The Netherlands
M.A. Tomaszewski
a, M.A.P.M. van Asseldonk
b,c,∗, A.A. Dijkhuizen
b, R.B.M. Huirne
baDepartment of Animal Science, Texas A&M University, College Station 77845-2471, USA
bDepartment of Economics and Management, Wageningen Agricultural University, Hollandseweg 1, 6706 KN Wageningen, The Netherlands cDepartment of Agricultural, Environmental and Systems Technology, Wageningen Agricultural University,
Dreijenplein 2, 6703 HB, Wageningen, The Netherlands
Received 8 June 1999; received in revised form 21 February 2000; accepted 1 March 2000
Abstract
Yearly production and reproduction data on dairy farms in The Netherlands were obtained to determine whether management information systems significantly improved herd performance variables (management information systems (MIS) effects). The analysis included 357 adopters of a management information system and 357 herds were used as controls. The data comprised years 1987 through 1996, and included for the adopters both the ‘before’ and ‘after’ period. Panel data analysis enabled to estimate MIS effects both within and between farms, allowing for a separation of farm-specific effects and common (trend) effects. Adoption and use of a management information system resulted in a significant annual increase in rolling herd average milk (carrier) and protein production of 62 and 2.36 kg per cow, respectively. Calving interval was shortened by 5 days. The pay-back period was approximately 5 years of the system (including the hardware), and therefore, MIS appears to be economically profitable. © 2000 Elsevier Science B.V. All rights reserved.
Keywords: Management information system; Panel data analysis; Dairy herds
Abbreviations: MIS, management information system; NRS, Royal Dutch Cattle Syndicate
1. Introduction
Historically, automation of the cow recording sys-tem has been one of the first applications in the adop-tion sequence of new technologies on dairy farms. Dutch dairy farmers have continued to adopt manage-ment information systems (MIS). Recent data indi-cate that approximately 4800 farms, i.e. 15% of the
∗Corresponding author. Tel.:+31-317-4-83635;
fax:+31-317-4-84763.
E-mail address: [email protected] (M.A.P.M.
van Asseldonk)
Dutch dairy farms, now have some type of MIS (ATC, 1996). Automation of the cow recording system of-fers the ability to improve utilization of individual cow production records in order to support managerial ac-tivities and decision making. More recently, advance-ments in information technology have made it possible to capture additional on-line data, for example, con-centrate left-overs recorded by automated concon-centrate feeders, milk weight and cow activity (Van Asseldonk et al., 1998). However, all of these information tech-nology applications incorporate some kind of auto-mated cow recording system (Schlünsen et al., 1987; Spahr, 1993).
Although MIS adoption may in itself be an indica-tion of farmers expecting benefits from MIS, it does not provide a quantifiable effect that is attributable to the system (Verstegen et al., 1995b). Several attempts have been made to quantify effects attributable to an MIS on dairy farms. The study by Hayes et al. (1997) was conducted under New Zealand production condi-tions and covered one complete year. Users achieved an improvement in daily milk production (carrier), fat and protein of 1.2, 0.08, and 0.07 kg, respectively. In addition, a higher percentage (+8.4%) of cows calved during the desired period, which is critical in New Zealand seasonal calving herds, and a higher percent-age of cows (+9.7%) mated at the optimal time to achieve a concentrated calving period in the following year. Introduction and use of an MIS was not associ-ated with other commonly used reproductive indices (heat detection efficiency, first service non-return rate and pregnancy rate). According to Hayes et al. (1997) these indices tend to be biased between the two groups (cases and controls) due to differences in the methods and period of recording information and do not so ac-curately reflect true performance. Losinger and Hein-richs (1996) estimated that dairy operations with an MIS had a significantly higher yearly milk production of 207 kg per cow than non-MIS users. However, ad-justments in the statistical model to overcome bias as-sociated with MIS use is hard with this kind of research data (cross-sectional study). Possible differences be-tween the control group and the MIS group before MIS introduction are not available and the suitability of posttest-only designs depends on the comparability of the MIS and control groups before MIS introduc-tion (Verstegen et al., 1995a). Therefore, the reported effects by Losinger and Heinrichs (1996) and Hayes et al. (1997) should be interpreted with care. Lazarus et al. (1990) and Tomaszewski et al. (1997) used time series to quantify MIS benefits, comprising yearly ac-counting data and milk recording data of 51 and 33 farms, which invested in an MIS during the time pe-riod investigated, respectively. The study by Lazarus et al. (1990) estimated a net farm income rise of $ 85 per cow in the first year of computer use. Tomaszewski et al. (1997) estimated an increased milk production (carrier) of 421 kg, but none of the investigated re-production variables were significantly affected. Both studies concerned farms operating in US, i.e. with rel-atively large dairy herds and without restrictions on
milk production. The reported MIS effects may not necessarily be obtained in a situation when an MIS is used in relative small dairy herds such as in The Netherlands. Management could be more depending on some kind of formal MIS when the number of cows increase (time per cow is more restrained) and the amount of recorded data increase. In addition, the marginal value of the (possible) estimated improved milk production per cow is lower under production restrictions (milk quotas).
Overbeek (1992) concluded by means of a cross-sectional research design no effect on gross mar-gins of Dutch dairy farms. As with all cross-sectional studies, this study failed to compare ‘before adoption’ results with ‘after adoption’ results within farms, and could not therefore, fully account for the fact that (early) MIS adopters are not a random sample of the population. The purpose of this study is to quantify the benefits of MIS adoption and use in Dutch dairy farming with a unique time series data set; i.e. a so-called panel data set.
2. Materials and methods
Empirical methods to evaluate MIS have been ex-plained by Lazarus et al. (1990) and Verstegen et al. (1995b). For this study, annual production and repro-duction variables were obtained for a cross-section of Dutch dairy producers over the time period from 1987 to 1996. Analyzing this kind of data makes it possi-ble to compare at the same time ‘before and after’ and ‘with and without’ and hence provides an opportunity to estimate the effect of an MIS adoption on herd per-formances, eliminating the influence of herd-specific and trend effects. In addition, panel data design makes it possible to estimate technology effects for each year after adoption, clarifying whether the particular tech-nology utilization acts like a trend over several years or occurs as an instant jump at the time of adoption (Mundlak, 1961).
2.1. Study population
herd data were obtained for all herds in the NRS data set from 1987 through 1996 in order to construct a panel data set. Unique herd numbers of 2607 MIS users and date of initial MIS purchase were identified by four Dutch software developers, together serving almost the entire MIS market in the Dutch dairy sector. In order to obtain a random sample of these herds, the herds were sorted according to purchase date within each software developer. Every fifth herd was selected as an MIS herd to be included in the analysis. These procedures ensured that all developers were propor-tionally represented within the sample in relation to the number of programs they had sold, as well as the time of introduction of the program. An additional re-striction required that herds had to have purchased the MIS in the time period analyzed and had to have data as to the entire range of the study. Of the 521 MIS herds selected, 382 met this requirement.
Despite the vast majority of management automa-tion, the use in current commercial MIS is in the standard version limited to animal production tables, attention lists and working schedules. However, MIS users could have installed additional software, thereby enhancing the functionality of the MIS system.
For the MIS selected herds, the developers provided the unique herd identification number that allowed identification of the herds in the NRS data set. Since other NRS herds could be using some other manage-ment software program, which was not known by the NRS, a procedure was developed for selecting con-trol herds that eliminated as many potential MIS users as possible from the NRS database before selecting control herds. Some producers who utilize other data collection programs subscribe to an NRS service that provides a file of their monthly herd recording results, which they then load into their own farm database. Herds that were enrolled on this service were termed electronic data interchange (EDI) herds. It was as-sumed that these 4283 EDI herds were potential MIS users. Additionally, we were able to identify 485 herds of the 2607 MIS herds that had not been included in the EDI herd list. These 4768 herds were eliminated as potential control herds from the NRS yearly data set, which contains in total about 27 000 herds.
The inclusion of controls in the research design would improve the accuracy of estimation through additional possibilities of correcting for trends not caused by technology use. Since farm size, operator
age and education level are important determinants of MIS adoption (Putler and Zilberman, 1988; Batte et al., 1990), MIS herds might not be seen as a random sample but represent bigger farms with above aver-age manaver-agement levels. However, variables describ-ing management were not recorded (directly) in the database.
To ensure that the control herds were initially sim-ilar to the MIS herds, a control herd was selected for each MIS herd according to the following criteria: (1) the herd’s major breed had to be the same and the per-centage of the breed within the control herd had to be within 5% of the MIS herd; (2) the number of cows in the control herd had to be within 5% of the MIS herd; (3) the differences between the MIS and control herds for fat and protein milk production (FPCM). The con-trol herd that had the most similar initial FPCM was taken as the control herd for the MIS herd. Three MIS herds that failed to match with 1 and 2 were deleted from the analysis. The 379 control herds were reduced to 357 control herds due to the additional requirement that data should be available for 10 consecutive years. The MIS herds that did not have controls were also eliminated resulting in a data set of 357 MIS and 357 control herds. Structuring the data set in this manner ensured that control and MIS herds were similar at the start of the study and ensured that herds had observa-tions before and after MIS adoption. This procedure avoided, to a certain extent, problems of distinguish-ing between production (i.e. management level) and MIS effects.
2.2. Statistical analysis
Simple descriptive statistics in terms of means and standard deviations were used to explore the differ-ences in herd size and average milk production per cow between adopters and non-adopters. For each period, the category of herds enrolled in an MIS in that year was compared with other herd categories, including: (0) non-MIS herds in the whole period 1987–1996; (1) MIS herds that had not installed the system yet; (2) MIS enrolment in the current year and (3) having used MIS for more than 1 year.
these only give some rough indication of significance; the data are non-experimental and consist of several simultaneous time series for which it is almost im-possible to model joint stochastic behavior. A model for the whole period 1987–1996 was developed and analyzed using PROC MIXED of SAS (1996). A mixed model is one that contains both fixed and ran-dom effects. Factor effects are ranran-dom if the levels of the factor that are used in the study represent only a random sample of a larger set of potential levels. The following regression model was used:
Yij=αYEARij+βiHERDij +χHFij
+εHERDSIZEij +φCORREC+ϕMIS05ij
+γij(MIS05∗HERD)ij+ηj(YR(CORREC))
+errorij
Although the NRS data set contained many vari-ables to support management, the average annual amount of milk, fat and protein produced per cow were used as dependent variables (Y) to analyze the MIS effect. In addition, average annual calving inter-val (also dependent variable) was used as an indicator of the reproductive performance. This highly aggre-gated figure contains all the effects that MIS may have on the major reproduction performances.
The regression model estimates Y for herd i and year j with the following independent main variables: YEAR (year of particular observation), HERD (e.g. HERDij=1 if observation is of that particular herd and is a class variable (i.e. farm dummy); otherwise 0), HF (percentage of breed Holstein Friesian), FH (percentage of breed Friesian Holland), HERDSIZE (number of cows), CORREC (e.g. CORREC=0, if ob-servation is of year<1992; otherwise CORREC=1), MIS05 (e.g. MIS05ij=0 if herd i did not use MIS in year j) and an error term. CORREC was introduced be-cause yearly production records in the NRS data base had been redefined in 1992. Production records before 1992 were on the basis of lactation production, from 1992 onwards records were based on 305 days in pro-duction (records with less than 305 days, but 200 or more days were incorporated unmodified). The term MIS05*HERD was added to account for differences in MIS05 effect among herds. Notice that YEAR and YR are a linear and class variable, respectively, both containing the year. Because the choice to adopt an
MIS appears to depend on previous or current herd conditions, we specified HERD as a fixed effect rather than as a random effect. Because the benefits of an MIS could vary from herd to herd, we superimposed a random interaction of MIS05 and HERD on a fixed MIS05 effect. Finally, because graphical examination of residual plots we introduced a random interaction of YR and CORREC. The default variance compo-nent estimation procedure of PROC MIXED was used, that is the restricted maximum likelihood procedure (REML).
On average, the MIS installation is in the middle of the investment year. So the MIS effect is introduced as a regression coefficient on a regression variable (MIS05) with values of 0 (for non-MIS herds and for MIS before the switch), 0.5 (MIS in year of switch) and 1 (MIS after switch).
Three ‘secondary’ analyses were performed. Firstly, the presented model was used to try and explain any changes in heat detection percentage, interval calv-ing to first insemination and non-return percentage at 56 days after insemination due to adoption of MIS. These three reproduction variables determine ultimately calving interval. Management practices and information use are likely to differ by farm size (Lazarus et al., 1990). Secondly, in order to obtain results applicable to the different herd sizes, two sub-sets of the original data were analyzed with the model as described earlier. Herd sizes in the subsets in 1987 were<50 and>50 cows. Thirdly, MIS effects were tested for each year after adoption, clarifying whether the effects of MIS use occurs as an instant jump at the time of adoption or increases during the following years after adoption. In the adjusted statistical model, class 0 (non-adopters and herds before adoption) has been compared with three classes: 1 (year of adop-tion); 2&3 (second and third year after adoption) and >3 (more than 3 years after adoption).
3. Results
Fig. 1. Average for milk production according to categories of MIS use: 0: non-MIS adopters; 1: NO MIS use yet; 2: MIS enrolment in current year; 3: MIS use more than 1 year.
was similar. Herd size for these two categories in 1996 were 60 versus 59, indicating a randomness in MIS adoption with respect to the autonomous growth of the farms. Faster increasing herds were not more in-clined to adopt an MIS than slower increasing (con-trol) herds. The average herd size and milk produc-tion of the total NRS data base were lower than the herds before MIS adoption in 1987. The average NRS herd had 44 cows and had an average milk production of 6270 kg per cow. The MIS adoption group had 58 cows and 6581 kg, respectively, stressing the impor-tance of inclusion of matching control groups.
The change in rolling herd average milk (Fig. 1) de-picts that categories 2 and 3 are higher than 0 and 1, which indicates that MIS benefits increased over the years after adoption, rather than being an instant jump, since category 3 realizes a higher average production than category 2. The instant decrease in milk produc-tion in 1992 clearly shows the necessity to incorporate a correction factor into the regression model.
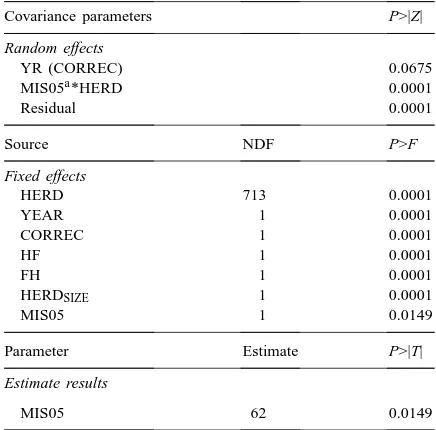
Table 1 shows the estimation results of PROC MIXED for milk production. The incorporated effects were significant and all fixed effects, except for the variable HERD, had a degree of freedom of 1. The significant estimate of milk production from the MIS is 62 kg (S.D.=25), while the estimate of protein pro-duction (Table 2) from the MIS is 2.36 kg (S.D.=0.90,
Table 1
PROC MIXED results of random and fixed effects for milk pro-duction
Covariance parameters P>|Z|
Random effects
YR (CORREC) 0.0675
MIS05a*HERD 0.0001
Residual 0.0001
Source NDF P>F
Fixed effects
HERD 713 0.0001
YEAR 1 0.0001
CORREC 1 0.0001
HF 1 0.0001
FH 1 0.0001
HERDSIZE 1 0.0001
MIS05 1 0.0149
Parameter Estimate P>|T|
Estimate results
MIS05 62 0.0149
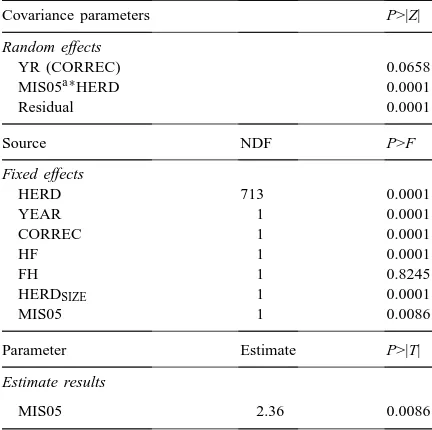
both significant at p=0.05). In the second model the variable FH was not significant and excluding this variable from the regression model did not change the effect on MIS05. Estimated effect on fat production from the MIS was not significant. Calving interval shortened by 5 days (S.D.=0.75, Table 3) as a result of MIS use. The goodness of fit obtained from the PROC MIXED statistics of the models used, mea-sured by the standard deviation of the estimates, was: milk=329 kg (Table 1); protein=12 kg (Table 2) and calving interval=15 days (Table 3), respectively.
The additional dependent variables heat detection percentage (1.22%), interval calving to first insemina-tion (−3.20 days) and non-return percentage at 56 days after insemination (−1.67%) were all significantly af-fected by MIS use (Table 4).
Analysis of the two subsets in which herd size was in 1987<50 and>50 cows showed substantial differences (Table 5). Only the estimated effect on
Table 2
PROC MIXED results of random and fixed effects for protein production
Covariance parameters P>|Z|
Random effects
YR (CORREC) 0.0658
MIS05a∗HERD 0.0001
Residual 0.0001
aMIS05=0 for herds that were not enrolled in an MIS and for herds that would be enrolled in an MIS in the future but had not adopted the system yet; MIS05=0.5 for herds that were enrolled in an MIS and had adopted the system in the current year and MIS05=1 for herds that were enrolled in an MIS and had completely adopted the system. Standard deviation of the estimated models was 12 kg.
Table 3
PROC MIXED results of random and fixed effects for calving interval
aMIS05=0 for herds that were not enrolled in an MIS and for herds that would be enrolled in an MIS in the future but had not adopted the system yet; MIS05=0.5 for herds that were enrolled in an MIS and had adopted the system in the current year and MIS05=1 for herds that were enrolled in an MIS and had completely adopted the system. Standard deviation of the estimated models was 15 days.
calving interval was significantly affected for the rel-atively bigger farms in 1987, while milk, protein and calving interval were significantly effected for the rel-ative smaller farms. The relrel-atively bigger farms were characterized in 1996 according to a higher milk pro-duction (7458 and 7145 kg), protein propro-duction (260 and 250 kg) and calving interval (397 and 392 days). In this subset average herd size decreased from 74 in 1987 to 71 cows in 1996. In contrast, herd size increased on relatively smaller farms from 37 in 1987
Table 4
Estimated effects of an MIS on reproduction variables in order to explain shortened calving interval
Average 1996 Estimate P>|T|
Heat detection (%) 54 1.22 0.0001
Interval calving — 81 −3.20 0.0001 first insemination
(days)
Table 5
Estimated effects and t-values of an MIS for two subsets in which herd size in 1987 was<50 and>50 cows
Estimate P>|T|
Milk production (kg)
<50 cows 80 0.0413
>50 cows 18 0.5814
Protein (kg)
<50 cows 3.10 0.0265
>50 cows 0.48 0.6756
Calving interval (days)
<50 cows −6.61 0.0001
>50 cows −5.04 0.0001
to 44 cows in 1996. Possible explaining variables for the estimated differences, such as management prac-tices and information use, were not available. One of the many possible explanations can be the fact that ini-tial larger farms had to have a higher level of manage-ment and information use in order to run their larger business. A more formal information use (MIS) would then result in a smaller potential improvement.
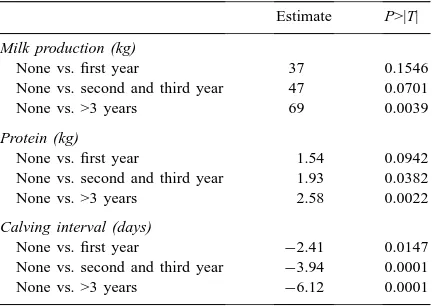
In Table 6 the results are shown in which MIS05 is a class variable as opposed to continuous variable described in the previous sections. Pair wise compar-isons of the least squares means between 0 and 1, 0 and 2&3 and 0 and >3 years after MIS adoption have been tested for statistical significance. Estimates of MIS use
Table 6
Estimated effects of years after adoption vs. non-adoption and
p-values of an MISa
Estimate P>|T|
Milk production (kg)
None vs. first year 37 0.1546
None vs. second and third year 47 0.0701
None vs. >3 years 69 0.0039
Protein (kg)
None vs. first year 1.54 0.0942
None vs. second and third year 1.93 0.0382 None vs. >3 years 2.58 0.0022
Calving interval (days)
None vs. first year −2.41 0.0147 None vs. second and third year −3.94 0.0001 None vs. >3 years −6.12 0.0001 aTechnology effects are incorporated into the regression model as class variables.
showed significant effects on milk (47 kg), protein pro-duction (1.93 kg) and calving interval (−3.94 days) in case of non-adopters versus second and third year af-ter adoption. In general, first year performances were lagging behind performances of the following years. Changes in milk, protein and calving interval increased in the following years. So, these effects acted like a trend over several years, rather than an instant jump at the time of adoption.
4. Conclusion
Farms without MIS adoption, with similar perfor-mance records in the base year 1987 in comparison with farms with MIS adoption, were incorporated into the models in order to improve estimations and were constructed in such a way that MIS herds were com-pared with non-MIS herds with initially similar pro-duction and herd size. MIS adoption and use improved annual milk (carrier) production by 62 kg, protein pro-duction by 2.36 kg per cow and reduced calving inter-val by 5 days.
appears to be economically profitable. This analysis does not take into account the cost of any additional time and management requirements from the operator in adopting and using MIS.
The panel data analysis has proven to be fruitful to evaluate the benefits of MIS. Therefore, additional information technology adoptions could (and should) be evaluated in a similar empirical manner to clarify whether these technologies increase dairy profitability. For example, automated concentrate feeders, on-line milk production measurement and activity measure-ment on milk production and reproduction.
Acknowledgements
The authors thank the Royal Dutch Cattle Syndicate and the management information system manufactur-ers for providing data and Albert Otten of the Depart-ment of Mathematics, Wageningen Agricultural Uni-versity, The Netherlands for statistical support.
References
ATC, 1996. Agricultural Telematics Centre. Automation in the Agriculture Sector: Use and Trends (in Dutch). Wageningen, The Netherlands.
Batte, M.T., Jones, E., Schnitkey, G.D., 1990. Computer use by Ohio commercial farmers. Am. J. Agric. Econ. 72, 935–945. Hayes, D., Morris, R., Pfeiffer, D., 1997. Production and
reproductive response to use of an on-farm management information system for dairy herds. In: Proceedings of the Epidemiol. Sante Anim. VIII ISVEE, Paris, pp. 8.7.1–8.7.3. Jalvingh, A.W., Dijkhuizen, A.A., 1997. Dairy cow calving
interval: optimum versus allowable length theory and possible
use in herd health programs. In: Proceedings of Epidemiol. Sante Anim. VIII ISVEE, Paris, pp. 16.1–16.3.
Lazarus, W.F., Streeter, D., Jofre-Giraudo, E., 1990. Management information systems: impact on dairy farm profitability. North Central J. Agric. Econ. 2, 267–277.
Losinger, W.C., Heinrichs, A.J., 1996. Dairy operation management practices and herd milk production. J. Dairy Sci. 79, 506–513.
Mundlak, Y., 1961. Empirical production function free of management bias. J. Farm Econ. 43, 44–56.
Overbeek, M.M.M., 1992. Information technology in the dairy sector: adoption and impact (in Dutch). LEI onderzoeksverslag, 99.
Putler, D.S., Zilberman, D., 1988. Computer use in agriculture: evidence from Tulare county, California. Am. J. Agric. Econ. 70, 790–802.
SAS. Institute, 1996. SAS® System for Mixed Models. SAS Institute Inc., Cary, NC, USA.
Schlünsen, D., Roth, H., Schön, H., Paul, W., Speckmann, H., 1987. Automatic health and oestrus control in dairy husbandry through computer aided systems. J. Agric. Eng. Res. 38, 263– 279.
Spahr, S.L., 1993. New technologies and decision making in high producing herds. J. Dairy Sci. 76, 3269–3277.
Tomaszewski, M.A., Sudweeks, E.M., Dijkhuizen, A.A., Huirne, R.B.M., 1997. Determining the effect of a management information system on herd production. J. Dairy Sci. 80 (Suppl. 1), 148.
Van Asseldonk, M.A.P.M., Huirne, R.B.M., Dijkhuizen, A.A., Tomaszewski, M.A., Harbers, A.G.F., 1998. Effects of information technology on dairy farms in The Netherlands: an empirical analysis of milk production records. J. Dairy Sci. 81, 2752–2759.
Verstegen, J.A.A.M., Huirne, R.B.M., Dijkhuizen, A.A., Kleijnen, J.P.C., 1995a. Economic value of management information systems in agriculture: a review of evaluation approaches. Comput. Electron. Agric. 13, 273–288.