Evaluation of The Impacts of VMS on Traffic Performance
Measures in An Urban Area in Indonesia
A Caroline Sutandi1
Abstract: Variable Message Sign (VMS) is especially recommended for congested flow conditions. The aim of this study is to investigate how drivers in a large city in a developing country with many specific geometric and traffic conditions and also specific driver behaviour, use VMS in aid of choosing route for their inter-city trips. Furthermore, to explore the impact of the use of the information on increasing traffic performance measures. A case study was carried out in Bandung, Indonesia. Microscopic traffic simulations were used in this study to evaluate traffic performance measures. The results of the evaluation found that VMS has insignificant impact on drivers’ route choice behaviour. The results indicated that drivers in Bandung rely much on their experience of traffic conditions commonly occur in the city and demonstrated that VMS has no significant impact to increase traffic performance, but has better impact on the roads with higher number of alternative roads.
Keywords: variable message sign, traffic performance measures, developing country
Introduction
It is common practise that Variable Message Sign (VMS) is implemented on the network with alterna-tive routes to achieve optimal traffic allocation among alternative routes. VMS is provided espe-cially for congested flow conditions [1] in large cities including in developing countries. These cities are growing much faster than those in the developed world. The average annual population growth in developing countries is estimated at around 5 per cent compared to 0.7 per cent in developed countries [2]. Moreover, large cities in developing countries have low road network densities with poor conditions. The problem is further compounded by the interaction between a larger number of road users and transport modes [3].
The application of VMS as one of Intelligent Trans-portation Systems (ITS) technologies in congested roads in developing country can potentially ease congestion problem in the cities. But large city has many specific geometric and traffic conditions and also driver behaviour. The aim of this study is; (1) to investigate how drivers in a large city in a developing country use information from VMS as an aid to choose route for their inner-city trips, (2) to explore the impacts of information from VMS on traffic performance measures such as traffic flows, queue lengths, densities, speeds, travel times, delay times, stop times, and number of stops.
1Civil Engineering Department, Parahyangan Catholic University, Bandung, Indonesia
E-mail: [email protected]
Note: Discussion is expected before June, 1st 2008, and will be published in the “Civil Engineering Dimension” volume 10, number 2, September 2008.
Received 23 July 2007; revised 17 September 2007; accepted 3 October 2007.
In this paper, microscopic traffic simulation was used to compare the road network conditions with and without VMS under the same traffic demands. AIMSUN (Advanced Traffic Interactive Microscopic Simulator for Urban and Non Urban Networks) traffic simulation software was used as a tool to develop microscopic traffic simulation models for the road network under consideration. A number of congested roads in a large road network area in Bandung, Indonesia were used as a case study to evaluate the impact of VMS on drivers’ behaviour and on traffic performance measures.
VMS Implementations in Developing Countries
VMS is an electronic message sign strategically placed along the road network with alternative roads to provide information and recommendations for drivers on traffic conditions. VMS allows operators in Traffic Control Centre to activate or upload new messages via software [4, 5]. In addition to the common categories of information to driver i.e. historical information, current information, and predictive information [6], some of the information available to drivers regarding traffic congestion is as follows.
• Traffic advisory provides drivers regarding infor-mation of network congestion. Drivers are advised of network problems but retain route choice.
• Congestion information advises drivers of conges-tion ahead on the current roadway or on other roadways that are in the network in the vicinity of the sign.
• Roadway work information to warn drivers of construction and maintenance zones.
In many cases, VMS was design to improve flow at localised points in the network such as heavily congested roads, or to make travellers aware of non-recurring congestion such as special events or incidents [7]. The application of VMS in large cities in developing countries is unique because these cities have specific local conditions. Some of these specific conditions include low road network densities [8], only three up to eight percent of total city area, narrow lane width, short distance between intersect-tions, poor lane discipline, parking activity near intersections, bus and other public transport vehicles usually stop anywhere along the street and level of side friction in connection with on street parking and street vendor activities. This limited road infrastruc-ture has to serve city resident with high population density and has also to serve vehicle with high annual vehicle growth rate [9].
Data Collecting
Data collecting was carried out in Bandung, Indonesia. Advanced traffic control system SCATS (Sydney Coordinated Adaptive Traffic Control Systems) currently controls 117 signalised intersect-tions out of 135 intersecintersect-tions in Bandung. The observed intersections in this research were the 90 signalised intersections connected to SCATS during morning peak (7:00 – 8:00 am), off peak (10:00 – 11:00 am) and afternoon peak (4:30 – 5:30 pm) periods, wherein the other 27 signalised inter-sections were under flashing yellow signal because of changes to the direction of traffic [10]. Four types of data were collected in this study including geometric detail data, traffic demand data, traffic control data, and driver’s respond data to VMS information in a number of congested roads in Bandung.
The first type of data was roads and intersections geometric data. It was obtained from the Bandung road map, Bandung Area Traffic Control, Final System Design [11] and direct survey. This data consist of lane width, number of lanes, medians, split islands, the dimension, location, and number of the loop detectors at each leg intersection, and the distance between intersections. Large number of data was used to create a digitised Bandung road network map and develop a simulated Bandung road network over the digitised network.
The second type of data was traffic demand data that was collected from data recorded by the SCATS system using a mini computer in the Bandung Traffic Control Room, and was also obtained from direct road observations when the road loop
detectors were not available. Data collection was carried out from the 90 signalised intersections connected to SCATS in Bandung during peak and off peak periods. It was collected every 15 minutes, including throughput data of each loop detector at each intersection, plus queue length data from a number of critical intersections with CCTV; there were four to 14 loop detectors at each signalised intersection for vehicle detection. Whereas, the field travel time data was collected using floating car data in a number of streams based on road hierarchies. The survey was repeated between five to eight runs on three working days (Tuesday, Wednesday, and Thursday). The data was used to validate the Bandung microscopic traffic simulation models and was not required as an input to develop the models [10].
The third field data required is traffic control data, including green time, yellow time, all red time, cycle time, traffic direction, phases at each intersection, and possible turning movements for each lane [10].
Two data sets were collected for use in this research. The first data set was used to develop and calibrate the models and the second data set was used for validation. The throughput data from each loop detector at each signalised intersection, in addition to queue length data from a number of signalised intersections with CCTV surveillance, the traffic control data and also travel time data, are believed to make up one of the largest sets of existing data available for the development, calibration, and vali-dation of microscopic traffic simulation models [10].
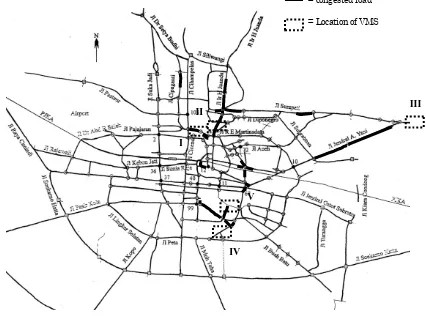
The last data needed is driver’s respond data to VMS information regarding traffic congestion, to choose alternative roads. The data was used as one of the input data required by the microscopic traffic simulator and was collected in a number of congested roads in Bandung. The location of VMS, names of the roads and related intersections are presented in Table 1. The road network map of Bandung with location of congested roads (in this study VCR (Volume to Capacity Ratio) > 0.800) and location of VMSs are shown in Figure 1.
A number of driver’s reasons to ignore the VMS as told to the surveyors were listed below.
• The other alternative roads have the same traffic congestion as well (68%)
• The other alternative roads were farther (13%)
• It needed more time to reach the destination through alternative roads (11%)
Bandung Microscopic Traffic Simulation Models
The Bandung microscopic traffic simulation models during peak and off peak periods have been developed, calibrated, and validated using GETRAM (The Generic Environment for Traffic Analysis and Modelling). GETRAM was used as a tool to evaluate the impacts of VMS on traffic performance measures in congested roads in Bandung. It consists of TEDI as a traffic editor and AIMSUN (Advanced Interactive Microscopic Simulator for Urban and Non Urban Networks) as a microscopic traffic simulator. Moreover, the adequacy of the models in replicating traffic conditions have been determined by a number of statistical tests including Paired T-test, Two Sample T-T-test, Regression Analysis,
17]. Based on the results of the five statistical analyses, all of the calibrated and validated models reproduced traffic conditions with an acceptable degree of confidence. Therefore, the models were clearly accepted as significant valid replication of existing condition [3, 9]. The validated models were then used to evaluate the impacts of VMS on traffic performance measures.
Performance Evaluation
Using the validated microscopic traffic simulation models, the results of the comparative evaluation of the models with and without the application of VMS are presented in Table 2 and Figures 2 to 7. Traffic performance measures used in this study are traffic flow and queue length at signalised intersections
Table 1. Drivers’ respond to VMS information regarding traffic congestion ahead at related intersections
VMS:
No. Street traffic congestion ahead on:
LT ST RT LT ST RT LT ST RT
I R.E. Martadinata H.Juanda street South to North - 5% + 5% - - 10% + 10% - - 5% + 5%
-II H. Juanda H.Juanda street South to North + 4% - 10% + 6% - - - + 5% - 10% + 5%
III Jend. A. Yani Jend A. Yani street East to West - 9% + 9% - - 5% + 5% - - -
-IV Pungkur Pungkur street for both direction - - - - 4% - + 4% - 5% - + 5%
V Lengkong Besar Pungkur street for both direction - + 6 % - 6% + 5% + 5% - 10% + 4% + 4% - 8 % Legend: LT = Left Turn, ST = Straight Through, RT = Right Turn
Location of VMS Driver's respond (% difference of traffic flow)
Morning Peak (7:00-8:00am) Off Peak (10:00-11:00am) Afternoon Peak(4:30-5:30pm)
= congested road
= Location of VMS
I II
IV V
Fig. 1. The road network map of Bandung [11,12] with location of VMS and congested roads
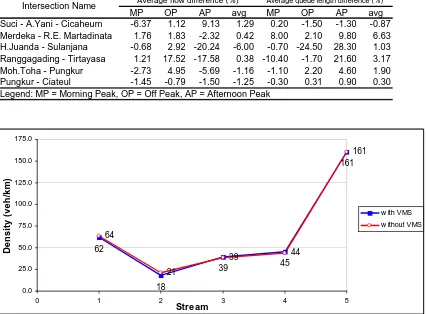
Table 2. Flow and queue length differences (%) between with and without VMS
MP OP AP avg MP OP AP avg
Suci - A.Yani - Cicaheum -6.37 1.12 9.13 1.29 0.20 -1.50 -1.30 -0.87 Merdeka - R.E. Martadinata 1.76 1.83 -2.32 0.42 8.00 2.10 9.80 6.63 H.Juanda - Sulanjana -0.68 2.92 -20.24 -6.00 -0.70 -24.50 28.30 1.03 Ranggagading - Tirtayasa 1.21 17.52 -17.58 0.38 -10.40 -1.70 21.60 3.17 Moh.Toha - Pungkur -2.73 4.95 -5.69 -1.16 -1.10 2.20 4.60 1.90 Pungkur - Ciateul -1.45 -0.79 -1.50 -1.25 -0.30 0.31 0.90 0.30 Legend: MP = Morning Peak, OP = Off Peak, AP = Afternoon Peak
Average flow difference (%) Average queue length difference (%)
Intersection Name
62
18
39 45
161
64
21
39 44
161
0.0 25.0 50.0 75.0 100.0 125.0 150.0 175.0
0 1 2 3 4 5
Stream
De
n
s
it
y
(
v
e
h
/k
m
)
w ith VMS w ithout VMS
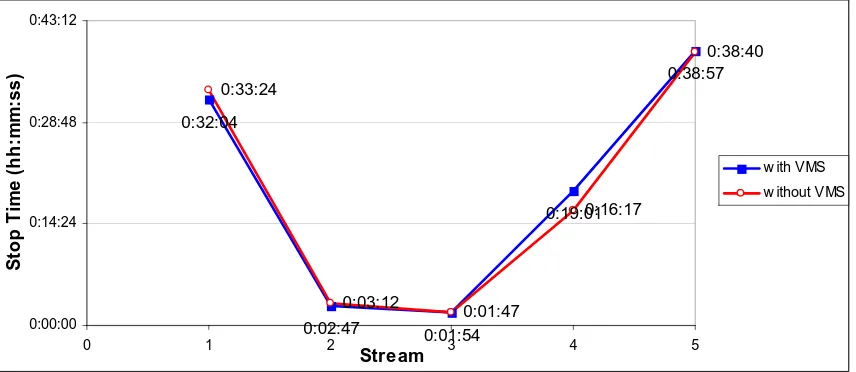
Fig. 2. Density comparison in congested streams between with and without VMS
30
39
20
25
5 29
37
21 23
5
0.0 25.0 50.0
0 1 2 3 4 5
Stream
Sp
e
e
d
(
k
m
/h
)
w ith VMS w ithout VMS
0:36:56
Fig. 4. Travel time comparison in congested streams between with and without VMS
0:32:04
Fig. 5. Delay time comparison in congested streams between with and without VMS
0:32:04
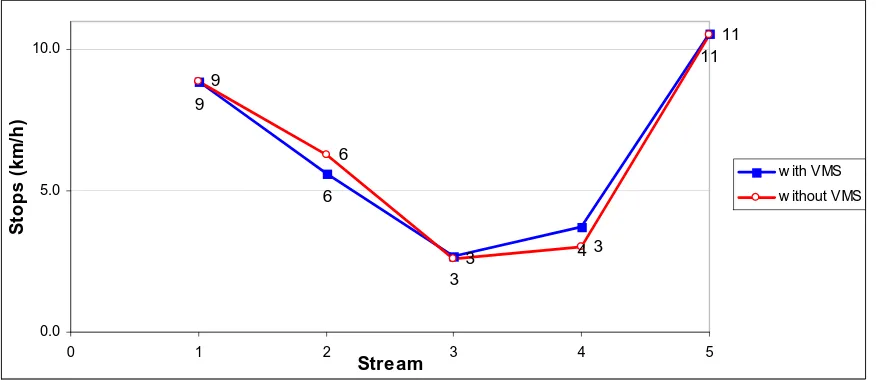
related to the congested roads under consideration (Table 2), and density, speed, travel time, delay time, stop time, and number of stops in the congested streams (Figures 2 to 7). In Figures 2 to 7, stream number 1 is Jend. Sudirman East to West, number 2 H. Juanda South to North, number 3 Jend. A. Yani West to East, number 4 Pungkur East to West, and number 5 Pungkur West to East.
Based on drivers’ respond to the VMS that was presented in Table 1 and traffic performance results presented in Table 2 and Figures 2 to 7 above, the main findings are discussed below:
Table 1 presents that drivers’ respond to choose alternative roads are between 4% and 10%. This decision is not significant since drivers’ decision after reading VMS is to rely much on their experience of traffic conditions commonly occur in the city.
It can be seen in Table 2 that the influence of VMS to traffic flow and queue length were not significant in fact worse i.e. decrease throughput by 6% at H.Juanda – Sulanjana intersection and increase queue length by 6.63% at Merdeka – R.E. Martadinata intersection.
In general, Figures 2 to 7 show that:
- The influence of VMS to increase traffic per-formance measures on the congested streams was better on stream number 1 Jend. A. Yani East to West and stream number 2 H. Juanda South to North since there were many alternative roads along the congested streams.
- The influence of VMS to increase traffic per-formance measures on the congested streams was worse on other observed congested streams since there were restricted alterna-tive roads along the streams.
Onclusions
This study evaluated the impact of VMS on traffic performance measures in a large city in a developing country that has a number of specific local conditions. AIMSUN micro simulator was used as a tool to evaluate the performance. The results presented in this paper clearly demonstrated that VMS has insignificant impact to the performance measures. This condition occurs since the driver behaviour in choosing their route rely much on their experience of traffic conditions commonly occur in the city. Another result also indicated that influence of VMS was better on the roads with higher number of alternative roads. In conclusion, the benefit of VMS certainly depends on local specific geometric conditions and local traffic behaviour in the city.
References
1. Park, E., Predictive VMS Control Strategy for Alternative Routes, Proceedings of the 6th
Eastern Asia Society for Transportation Studies
International Conference, Bangkok, Thailand,
September 2005, pp. 2307 – 2320.
2. Sinha, K. C., Can Technologies Cure Transpor-tation Ills? Proceedings of the Sixth International Conference on Application of Advance
Techno-logy in Transportation Engineering, Singapore,
2000.
3. Sutandi., A. C., Dia, H., Performance Evaluation of An Advance Traffic Control Systems in A Developing Country, Proceedings of the 6th
Eastern Asia Society for Transportation Studies
International Conference in Bangkok, Thailand,
September 2005, p. 345.
4. Dia, H., Advanced Traveller Information
Sys-tems, Short Course on Intelligent Transport
Systems, 2-3 November 2000, Brisbane,
Aus-tralia, 2000.
5. Hendrickson, C. T., Ritchie, S. G., Applications of Advanced Technologies in Transportation,
Pro-ceedings of the fifth International Conference,
April 26 – 29, 1998, ASCE, USA, 1998.
6. Dia, H., Funes, C. A., Client Server Architecture for A Real Time Traffic Information System on the Internet, Proceedings of the 19th ARRB
Trans-port Research Conference Roads 98: Investing in
Transport, pp.50-70, December 7–11, 1998, Syd-ney, Australia, 1998.
7. Alder, J., Dynamic Route Guidance and In Vehicle Systems, Short Course on Intelligent
Transport Systems, 2-3 November 2000,
Bris-bane, Australia 2000.
8. Morichi, S., Long-term Strategy for Transport System in Asian Mega cities, Journals of the 6th
Eastern Asia Society for Transportation Studies
International Conference in Bangkok, Thailand,
September 2005, pp. 1 – 21.
9. Sutandi., A. C., Dia, H., Evaluation of the Impacts of Traffic Signal Control Parameters on Network Performance, Proceedings of the 27th
Conference of the Australian Institutes of
Trans-port Research, December 2005, Queensland
University of Technology, Brisbane, Australia, 2005.
10. Sutandi, A. C., Performance Evaluation of Ad-vanced Traffic Control Systems In A Developing
Country, Ph. D Dissertation (The University of
Queensland, Brisbane, Australia), 2006.
11. AWA Plessey, Bandung Area Traffic Control,
Final System Design, Directorate General of
Land Transport, Ministry of Communications, Government of Republic of Indonesia, 1996.
12. AWA Plessey, Bandung Area Traffic Control, SCATS Presentation and "Before" Traffic Study
Details, Directorate General of Land Transport,
Ministry of Communications, Government of Republic of Indonesia, 1996.
13. TSS, Transport Simulation Systems, available from http://www.tss-bcn.com, 2004.
14. TSS, GETRAM Manual, Open Traffic Simulation Environment, February 2004, available from
http://www.aimsun.com/v4.2/Manual.zip, 2004.
15. Mason, R. L., Gunst, R. F., Hess, J. L, Statistical Design and Analysis of Experiments with
Applications of Engineering and Science, 2nd
edition, John Willey and Sons Hoboken, New Jersey, 2003.
16. Montgomery, D. C., Runger, G. C., Applied
Statis-tics and Probability for Engineers, 3rd edition,
John Wiley and Sons, Inc., 2003.
17. Ott, R. L., Longnecker, M., An Introduction to
Statistical Methods and Data Analysis, 5th